 Multi-family
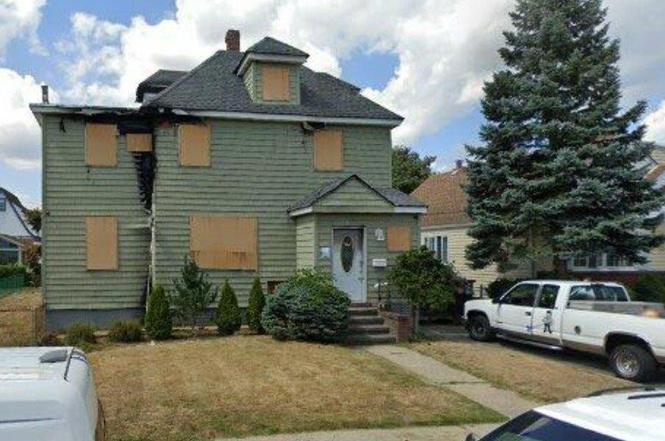
26 Sycamore St · West Hempstead, NY
Flood risk 1/10 · Minimal
- FEMA flood zone
- X (unshaded)
- Chance of flooding over 30 yrs
- 0.0%
- Est. flood insurance / yr
- $473 – $860
Fire risk 1/10 · Minimal
- Est. fire insurance / yr
- $691 – $1,283
Heat risk 6/10 · Moderate
- Hot days now (above 97°F)
- 7 days/yr
- Hot days in 30 yrs
- 16 days/yr
Wind risk 6/10 · Moderate
- Chance of severe wind over 30 yrs
- 54.0%
Air-quality risk 3/10 · Minor
- Unhealthy air days now
- 4 days/yr
- Unhealthy air days in 30 yrs
- 4 days/yr
Risk factors via First Street. Map © Google.
Why this score? — see what drove the B grade
The composite is a weighted blend of 9 inputs, each scored 0–100. Each bar is that input's sub-score; the figure is the points it added to the 100-point composite (weight × sub-score).
- Cash flow +30.0/30.0
- 1% rule +10.0/10.0
- DSCR +10.0/10.0
- ARV discount +7.5/15.0
- Schools +5.4/10.0
- Livability +4.3/5.0
- Rent growth +2.5/5.0
- Condition / age +2.5/5.0
- Appreciation +0.0/10.0
$300,000
🖨 Deal sheet (PDF) 📄 Offer letter ✓ Due diligence
Multi-family units
County records classify this as Multi-Family (2-4 Unit). Listing-text estimate: 1 unit. estimate disagrees with records
Listing remarks
SHORT SALE, SOLD AS IS, SUBJECT TO BANK APPROVAL
Key facts
- 6,000 sq ft lot
- Built 1918
Neighborhood map
What this means for you Summary
Snapshot
- This is a ?-bed/2.0-bath multifamily listed at $300k.
Deal economics
- At list price, monthly cash flow is $4k ($47k/yr) — positive.
- The deal already cash-flows at list — no discount required.
- Meets the 1% rule at list price ($8k rent vs $300k).
- Cap rate 21.9% vs local median 3.8% in West Hempstead — top-decile yield for the area; either an underpriced asset or a hidden risk that comps aren't pricing in. Stress-test before assuming the spread holds.
Location & tenants
- Location reads 86/100 on livability (#19 in NY, #382 nationally) — a professional / high-income tenant draw. Strengths: amenities A+, commute A+, employment A+; Watch: cost of living F.
- West Hempstead Union Free School District (suburban): math 54% / reading 63% proficiency, ranked #191 of 590 in NY (top 32%) — acceptable for families but not a draw, mixed tenant base, ~2y average lease.
- Zoned schools: George Washington School (math 39% / reading 54%, grade D+, #330 of 729 statewide, top 46%, 336 students, 48% FRL); West Hempstead Secondary School (math 92% / reading 92%, grade A+, #171 of 1,100 statewide, top 18%, 783 students, 50% FRL) — zoned schools average 49% FRL vs 29% district-wide (20 pts higher); higher-poverty schools than district average — tighter screening recommended.
- Market conditions: 101 active listings in the ZIP; 6 comparable units currently listed for rent nearby; rentals leasing fast (median 9d on market — plan ~1-2 weeks tenant-placement turnaround); high-income renter base; 824 units permitted in Nassau County in 2024 (153 in 5+ unit buildings).
- At $8,011/mo this rent would consume 62% of the median local household income ($155k/yr) (locally 208% of renters already pay >50% of income on rent) — very limited rent-growth headroom before tenants either downsize or default.
Forward outlook
- Local home prices are declining (-3.0%/yr); year-one equity from $2k of loan paydown is wiped out by about $9k of value loss. Plan a longer hold.
- Nassau County population projected at +7% by 2050 — modest demand growth; plan on rents tracking national, not racing it.
- At projected returns (-3.0% appreciation + 3.0% rent growth), your $84k cash investment doubles in ~3 years — after that, you're playing with house money.
Negotiation context
- Only 0 days on market — expect competitive offers; lowballing is unlikely to land.
- 6 sale attempts since 13y ago with the ask held roughly flat each time — persistent listings suggest the price (not the market) is what's stuck; bring a comps-based counter.
Risks & watch-outs
- Watch-outs: property tax is 2.9% of price; built in 1918 — expect roof / HVAC / electrical / plumbing capex.
- Climate carrying-cost: major wind risk, 54% chance of damaging wind over 30y; extreme-heat days projected 7→16/yr by 2055 (HVAC capex compounding) — expect insurance premiums to compound above CPI over the hold.
Questions for the listing agent
- Built in 1918 — when were the roof, HVAC, electrical panel, plumbing, and water heater last replaced?
- Property tax is high relative to price — has the assessment been appealed recently, and will the sale trigger a re-assessment?
- Is there a deadline driving the sale (1031 exchange, divorce, estate, relocation)? That informs how much negotiation room exists.
- Schools are A-rated — typically a magnet for longer-tenancy family renters. What's the average tenant stay here, and is there a school-zone premium baked into asking?
- What's the average days-on-market for RENTAL listings here right now (not sales)? A rising rental-DOM trend means longer vacancies and softer asking-rent achievability than the comps imply.
- What's the recent tenant-quality profile in this submarket — average credit score on applications, eviction rate, late-payment / NSF rate, and stable-employment percentage? A property-management company in the area should have these aggregated.
- How much new apartment / multifamily construction is in the pipeline within 1–3 miles? Heavy new supply (>2% of stock underway) typically softens rents 12–24 months out; light construction supports rent growth.
Investment metrics
- 1% rule
- 2.67% ✓
- Cap rate
- 21.87%
- Cash-on-cash
- 55.63%
- DSCR
- 3.48
- GRM
- 3.1
CMA / ARV
- ARV (on-the-fly)
- $1,015,870
- Comps found
- 1
Show comp detail 1 sale within ~0.75 mi
| Address | Dist | Beds/Ba | Sqft | Sold | Price | $/sf | Match |
|---|---|---|---|---|---|---|---|
| 447 Birch St | 0.63mi | 3/2.0 | 1,574 (-12%) | 12mo | $890,000 | $565 | 40 |
Match score weights: distance 35% · size 25% · config 20% · recency 20%. Top-matched comps best support the ARV.
Projected returns pro-forma
-3.0% appreciation · 3.0% rent growth · sell at horizon
- IRR
- 54.0%
- Equity multiple
- 3.38×
- Total profit
- $199,733
- Equity at exit
- $44,731
- IRR
- 59.1%
- Equity multiple
- 6.89×
- Total profit
- $494,660
- Equity at exit
- $25,939
Cash invested: $84,000 (down + closing). Projections, not guarantees.
Landlord ↔ Tenant lean methodology
- Overall (STATE)
- 15 Strongly Tenant-Friendly
- State New York
- 15 Strongly Tenant-Friendly · D+10
- County
- — inherits STATE
- City
- — inherits STATE
ZIP-level market 11552
- Active inventory
- 101
- Price-to-rent
- 6.2×
Monthly cashflow live
- Estimated rent
- $8,011 high interval (Pro) →
- Mortgage (P&I)
- −$1,573
- Tax from tax record
- −$737 /mo · $8,839/yr
- Insurance
- −$125
- HOA
- −$0
- Vacancy / Maint / Mgmt
- −$1,682
- Net cashflow
- $3,894
Break-even live
Sensitivity live
| Price | -10% $4,064 | -5% $3,979 | +0% $3,894 | +5% $3,809 | +10% $3,724 |
|---|---|---|---|---|---|
| Rent | -10% $3,261 | -5% $3,577 | +0% $3,894 | +5% $4,210 | +10% $4,527 |
| Rate | -1.0pp $4,045 | -0.5pp $3,970 | base $3,894 | +0.5pp $3,816 | +1.0pp $3,737 |
2-unit breakdown (identical units grouped — click to expand)
| Units | Beds | Baths | Est. rent |
|---|---|---|---|
| 2× units | 2 | 1.5 | $8,012 |
| #1 | 2 | 1.5 | $4,006 |
| #2 | 2 | 1.5 | $4,006 |
| Total (2 units) | $8,011 | ||
UW: 25.0% down · 7.5% · 30yr · 1.5% tax · 5.0% vac · 8.0% maint · 8.0% mgmt
Financing live
Cash to close
- Down payment
- $75,000
- Closing costs
- $9,000
- Reserves months
- —
- Total cash needed
- —
Loan-product check · same deal, 3 products live
Conventional
25% down · 7.5% · 30yr
- Down + closing
- —
- Monthly P&I
- —
- Monthly cashflow
- —
- DSCR
- —
- Eligible?
- —
Personal DTI + credit; lowest rate.
DSCR
20% down · 8.5% · 30yr
- Down + closing
- —
- Monthly P&I
- —
- Monthly cashflow
- —
- DSCR
- —
- Eligible?
- —
No personal income docs; deal must DSCR.
Hard money
10% down · 12.0% · 12mo
- Down + closing
- —
- Monthly P&I
- —
- Monthly cashflow
- —
- DSCR
- —
- Eligible?
- —
Short-term bridge; refi at stabilization.
Rent comps 6 comps
| Address | Beds | Baths | Sqft | Rent | $/sqft | DOM | Units | Dist |
|---|---|---|---|---|---|---|---|---|
| 111 Hempstead Tpke West Hempstead, NY | 3.0 | 1.0–2.5 | 1226 | $5,539 | $4.52 | 0d | 88 | 0.37mi |
| 130 Hempstead Ave West Hempstead, NY | 1.0–3.0 | 1.0–2.0 | 1113 | $4,550 | $4.09 | 0d | 6 | 0.43mi |
| 281 Dogwood Ave West Hempstead, NY | 2.0 | 1.0 | 2400 | $3,500 | $1.46 | 0d | 1 | 0.82mi |
| 849 Taft St West Hempstead, NY | 2.0 | 1.0 | 1368 | $2,500 | $1.83 | 14d | 1 | 1.31mi |
| 111 Virginia Ave Hempstead, NY | 1.0 | 1.0 | 1274 | $1,200 | $0.94 | 9d | 1 | 1.36mi |
| 44 Hilton Ave Unit C2 Garden City, NY | 2.0 | 1.0 | 1345 | $2,750 | $2.04 | 12d | 1 | 1.40mi |
Listing history 14 events
-
2024-12-05historical
-
2024-11-01status Active
-
2024-10-09$300,000 Active
-
2024-09-11$300,000
-
2018-09-14historical
-
2018-09-11$280,000 New
-
2017-08-08historical
-
2017-07-03status Under Contract
-
2017-06-15$295,000 New
-
2015-01-15historical
-
2013-09-08historical
-
2013-09-08$295,000
-
2007-11-21soldstatus $425,000
-
1981-07-01soldstatus $20,000
ⓘ Source: listings_history table (triggers on properties + properties_extension) + one-shot
backfill from property_details.listing_events for pre-trigger history.
Tax reassessment forecast NY · Partial reset (capped growth)
- Current annual tax
- $8,839 · $737/mo
- Projected year-2 tax
- $8,839 · $737/mo
- Expected delta
- $0/yr ($0/mo · 0.0%)
ⓘ Screening estimate from a state-policy table — verify with the county assessor before closing.
Climate risk First Street
- Flood 1/10 Low FEMA zone X (unshaded) · 0% chance over 30 yrs
- Wildfire 1/10 Low
- Heat 6/10 Major 7 d/yr ≥97°F today · 16 d/yr by 30 yrs out
- Wind 6/10 Major 54% chance of damaging wind over 30 yrs
- Air quality 3/10 Moderate 4 unhealthy d/yr today · 4 by 30 yrs out
Nearby sold comps map
Loading sold comps map…
Walkable amenities ~0.75 mi
Loading nearby amenities…
Taxation est. · year 1
- Rental income
- $96,132
- − Mortgage interest
- −$16,805
- − Property taxes
- −$8,839
- − Insurance
- −$1,500
- − Repairs & maintenance
- −$7,691
- − Management
- −$7,691
- − Depreciation
- −$8,727
- Taxable income
- $44,880
- Est. tax owed @ 24.0%
- −$10,771
- After-tax cash flow
- $35,955/yr
For passive investors: Depreciation is non-cash, so a rental often shows a tax loss while cash-flowing — sheltering income. Rental losses are passive: they offset passive income freely, and up to $25,000/yr can offset ordinary (W-2) income if you actively participate and your MAGI is under $100k (phasing out to $0 by $150k); unused losses carry forward. On sale, claimed depreciation is recaptured at up to 25%, and gains may owe capital-gains tax (a 1031 exchange can defer both). Figures are a year-1 estimate at your 24.0% rate — not tax advice; consult a CPA.
Schools (NCES district)
- District
- West Hempstead Union Free School District
- NCES district ID
- 3630660
- Math proficiency
- 54% ▼ -3.00%
- Reading proficiency
- 63% ▲ 7.00%
- Median HH income
- $98,641
- Composite
- 54.45/100
- National rank
- #1354
- State rank
- #191 of 590 in NY
Livability — West Hempstead
- Score
- 86/100
- State rank
- #19
- US rank
- #382
Category grades
Schools grade is shown separately in the Schools card above.
Census & demographics
- Census place
- West Hempstead, NY
- County
- Nassau County · 653,051 people
- City population
- 25,174
- Metro
- New York-Newark-Jersey City, NY-NJ-PA
- Population (ZIP)
- 25,174
- Household income
- $155,154
- Rent vs Own
- Severe rent burden
- 208.0
Population outlook (Nassau County) Hauer SSP2
- Today (2025)
- 1,409,302 people
- By 2030
- 1,431,482 · +1.6%
- By 2040
- 1,471,607 · +4.4%
- By 2050
- 1,502,845 · +6.6%
- By 2075
- 1,575,403 · +11.8%
- By 2100
- 1,554,356 · +10.3%
Race, ethnicity, and origin ACS 2023
- Neighborhood character
- Diverse neighborhood (Simpson 0.68)
- Race & ethnicity
- White 48% Hispanic / Latino 24% Black 18% Two or more races 8% Asian 5%
- Hispanic origin (detail)
- Puerto Rican 4% Dominican 7%
- Common ancestry
- Romanian 6% Hispanic 3% Scotch-Irish 2%
- Foreign-born
- 22% · Canada, Jamaica, China
- Languages at home
- 70% English-only · Spanish 17% Other Indo-European 3% French/Haitian/Cajun 2%
Political lean MEDSL · Nassau
- 2024 margin
- Toss-up / Even · D 47.9% · R 52.1%
- 2008→2024 swing
- -12.6pp toward R · 2008: 8.4pp · 2024: -4.2pp
- All cycles
- 2024: R+4.2 2020: D+9.5 2016: D+5.3 2012: D+6.7 2008: D+8.4
Not yet ingested
- Civics
- —
Market trends
- HPI YoY
- ▼ -803.45%
- Current HPI
- 335.0721
- Rent YoY
- —
- Metro
- New York-Newark-Jersey City, NY-NJ-PA
- State GDP YoY
- ▲ 2.60%
- F500 in state
- 92
Industry mix (Fortune 500 HQ in NY)
| Industry | F500 HQs | Revenue |
|---|---|---|
| Financial Services | 10 | $950B |
|
||
| Consumer Goods | 9 | $162B |
|
||
| Insurance | 4 | $225B |
|
||
| Telecommunications | 2 | $144B |
|
||
| Pharmaceuticals | 2 | $112B |
|
||
| Media / Entertainment | 2 | $69B |
|
||
Price history
+1400.0% since first listed14 events — show timeline
- 2024-12-05 Listing Removed — OneKey® MLS as Distributed by MLS Grid
- 2024-11-01 Relisted — OneKey® MLS as Distributed by MLS Grid
- 2024-10-09 Listed $300,000 OneKey® MLS as Distributed by MLS Grid
- 2024-09-11 Listed $300,000 OneKey® MLS as Distributed by MLS Grid
- 2018-09-14 Listing Removed — OneKey® MLS as Distributed by MLS Grid
- 2018-09-11 Listed $280,000 OneKey® MLS as Distributed by MLS Grid
- 2017-08-08 Listing Removed — OneKey® MLS as Distributed by MLS Grid
- 2017-07-03 Pending — OneKey® MLS as Distributed by MLS Grid
- 2017-06-15 Listed $295,000 OneKey® MLS as Distributed by MLS Grid
- 2015-01-15 Listing Removed — OneKey® MLS as Distributed by MLS Grid
- 2013-09-08 Listed $295,000 OneKey® MLS as Distributed by MLS Grid
- 2013-09-08 Listing Removed — OneKey® MLS as Distributed by MLS Grid
- 2007-11-21 Sold (Public Records) $425,000 Public Records
- 1981-07-01 Sold (Public Records) $20,000 Public Records
Property tax history
-0.7%/yrLatest (2024): $8,839 · -50.9% YoY. Source: county tax records.
Cash-flow waterfall
monthlySold comps — $/sqft
last 12 mo · ≤1 miLoading sold comps…