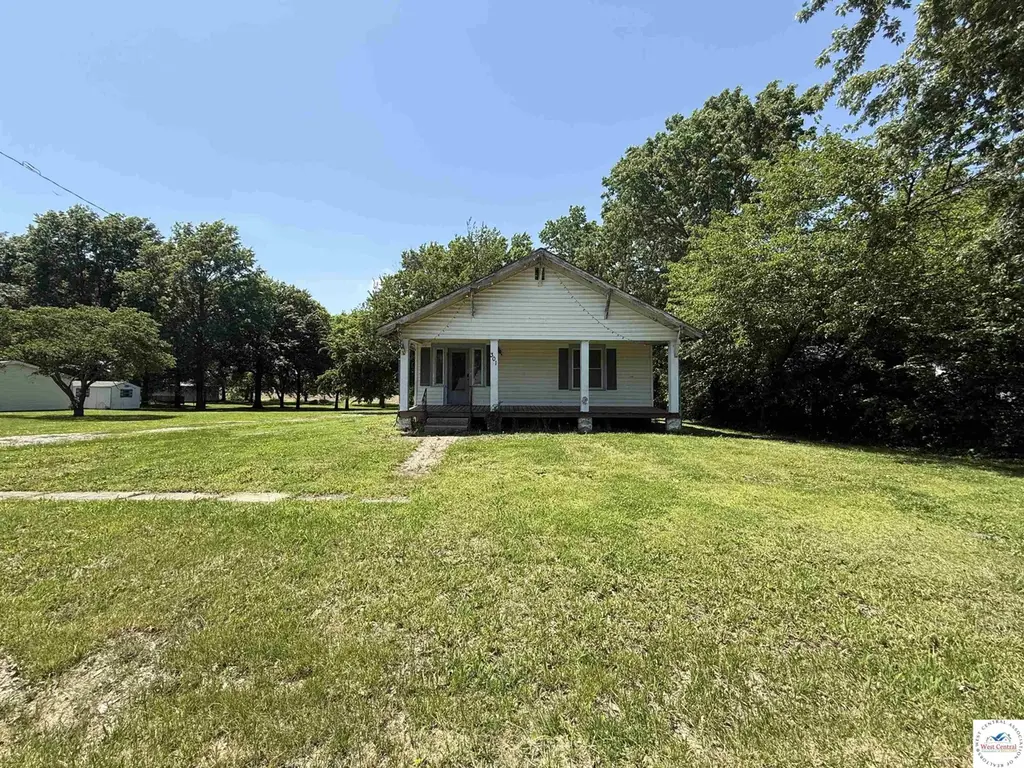
301 N Oak St · La Monte, MO
Flood risk 1/10 · Minimal
- FEMA flood zone
- X (unshaded)
- Chance of flooding over 30 yrs
- 0.0%
- Est. flood insurance / yr
- $473 – $860
Fire risk 3/10 · Minor
- Est. fire insurance / yr
- $1,054 – $1,958
Heat risk 4/10 · Minor
- Hot days now (above 106°F)
- 7 days/yr
- Hot days in 30 yrs
- 17 days/yr
Wind risk 2/10 · Minimal
- Chance of severe wind over 30 yrs
- 0.0%
Air-quality risk 2/10 · Minimal
- Unhealthy air days now
- 0 days/yr
- Unhealthy air days in 30 yrs
- 1 days/yr
Risk factors via First Street. Map © Google.
Why this score? — see what drove the B+ grade
The composite is a weighted blend of 9 inputs, each scored 0–100. Each bar is that input's sub-score; the figure is the points it added to the 100-point composite (weight × sub-score).
- Cash flow +27.8/30.0
- ARV discount +15.0/15.0
- DSCR +9.8/10.0
- Appreciation +7.7/10.0
- 1% rule +6.6/10.0
- Livability +3.1/5.0
- Schools +2.8/10.0
- Rent growth +2.5/5.0
- Condition / age +2.5/5.0
$85,000
🖨 Deal sheet 📄 Offer letter ✓ Due diligence
Listing remarks
This fixer-upper opportunity is packed with potential and sitting on over half an acre with plenty of room to grow! Step inside the spacious home and you’ll find charming original features throughout, including hardwood floors, classic wood trim, and generously sized rooms full of character. The main floor offers two large bedrooms, an oversized dining room, and a spacious kitchen with a convenient laundry/pantry area. Downstairs, the basement provides endless possibilities with space for up to three additional bedrooms, another family room, and a bathroom — making this property ideal for expanding living space or maximizing investment potential. Outside, you’ll love the l
Key facts
- Over half an acre
- Spacious kitchen
- Classic wood trim
Tags
Property features AI
Finance
- Other: Lot approximately 0.52 acre (about 22,651 sq ft)
Exterior
- Parking: Detached 2-car garage; 2 covered parking spaces (2 total parking spaces)
- Home design: Single-family residence; Residential property
- Construction: Vinyl siding; Composition roof
- Exterior features: Covered porch; Covered patio
Interior
- Bathrooms: 2 full bathrooms
- Interior features: Partial basement
Neighborhood map
What this means for you Summary
Snapshot
- This is a 3-bed/1.0-bath single-family listed at $85k.
Deal economics
- At list price, monthly cash flow is $259 ($3k/yr) — positive.
- The deal already cash-flows at list — no discount required.
- Meets the 1% rule at list price ($987 rent vs $85k).
- Recommended offer: $82k (3.0% below list) — sets the bar for market timing.
Location & tenants
- Location reads 62/100 on livability (#393 in MO) — a middle-class / working-renter tenant base. Strengths: cost of living A+, housing A+, crime B+; Watch: schools F, amenities F, commute F.
- La Monte R-IV (rural): math 25% / reading 35% proficiency, ranked #455 of 535 in MO (top 85%) — families likely to look elsewhere, expect single-tenant / working-renter base with shorter leases.
- Market conditions: 9 active listings in the ZIP; 109 units permitted in Pettis County in 2024 (46 in 5+ unit buildings).
Forward outlook
- In year one you build about $5k of equity ($588 loan paydown + $5k appreciation (5.4% local appreciation)).
- Pettis County population projected to shrink 7% by 2050 — rents likely to lag national; underwrite the cash flow, not the appreciation.
- At projected returns (5.4% appreciation + 3.0% rent growth), your $24k cash investment doubles in ~3 years — after that, you're playing with house money.
- By year 7, paydown + projected appreciation supports a ~$33k cash-out refi (75% LTV) — recoverable capital for the next deal without selling this one.
Negotiation context
- It's been on market 32 days — a 3% lower offer ($82k) is reasonable based on typical stale-listing flexibility.
Risks & watch-outs
- Watch-outs: built in 1925 — expect roof / HVAC / electrical / plumbing capex.
Questions for the listing agent
- It's been on market 32 days. Have you received any prior offers? Is the seller open to a 3% concession, seller financing, or rate buy-down credit?
- Built in 1925 — when were the roof, HVAC, electrical panel, plumbing, and water heater last replaced?
- Is there a deadline driving the sale (1031 exchange, divorce, estate, relocation)? That informs how much negotiation room exists.
- Schools are F-rated, which usually means shorter tenancies and higher turnover. Who's the typical renter profile here, and what's been the actual vacancy rate?
- What's the average days-on-market for RENTAL listings here right now (not sales)? A rising rental-DOM trend means longer vacancies and softer asking-rent achievability than the comps imply.
- What's the recent tenant-quality profile in this submarket — average credit score on applications, eviction rate, late-payment / NSF rate, and stable-employment percentage? A property-management company in the area should have these aggregated.
- How much new for-sale + rental construction is in the pipeline within 1–3 miles? Heavy new supply typically softens prices + rents 12–24 months out; constrained supply supports both.
Investment metrics
- 1% rule
- 1.16% ✓
- Cap rate
- 9.96%
- Cash-on-cash
- 13.08%
- DSCR
- 1.58
- GRM
- 7.2
CMA / ARV
- ARV (on-the-fly)
- $154,560
- Comps found
- 1
Show comp detail 1 sale within ~0.75 mi
| Address | Dist | Beds/Ba | Sqft | Sold | Price | $/sf | Match |
|---|---|---|---|---|---|---|---|
| 411 E Olive St | 0.43mi | 3/1.5 | 1,198 (+7%) | 14mo | $165,000 | $138 | 55 |
Match score weights: distance 35% · size 25% · config 20% · recency 20%. Top-matched comps best support the ARV.
Projected returns pro-forma
5.37% appreciation · 3.0% rent growth · sell at horizon
- IRR
- 24.9%
- Equity multiple
- 2.59×
- Total profit
- $37,904
- Equity at exit
- $50,102
- IRR
- 23.8%
- Equity multiple
- 5.18×
- Total profit
- $99,455
- Equity at exit
- $88,113
Cash invested: $23,800 (down + closing). Projections, not guarantees.
Landlord ↔ Tenant lean methodology
- Overall (STATE)
- 81 Strongly Landlord-Friendly
- State Missouri
- 81 Strongly Landlord-Friendly · R+10
- County
- — inherits STATE
- City
- — inherits STATE
ZIP-level market 65337
- Home prices YoY
- 2.3%
- Active inventory
- 9
- Price-to-rent
- 7.2×
Monthly cashflow live
- Estimated rent
- $987 medium interval (Pro) →
- Mortgage (P&I)
- −$446
- Tax from tax record
- −$39 /mo · $471/yr
- Insurance
- −$35
- HOA
- −$0
- Vacancy / Maint / Mgmt
- −$207
- Net cashflow
- $259
Break-even live
UW: 25.0% down · 7.5% · 30yr · 1.5% tax · 5.0% vac · 8.0% maint · 8.0% mgmt
Financing live
Cash to close
- Down payment
- $21,250
- Closing costs
- $2,550
- Reserves months
- —
- Total cash needed
- —
Loan-product check · same deal, 3 products live
Conventional
25% down · 7.5% · 30yr
- Down + closing
- —
- Monthly P&I
- —
- Monthly cashflow
- —
- DSCR
- —
- Eligible?
- —
Personal DTI + credit; lowest rate.
DSCR
20% down · 8.5% · 30yr
- Down + closing
- —
- Monthly P&I
- —
- Monthly cashflow
- —
- DSCR
- —
- Eligible?
- —
No personal income docs; deal must DSCR.
Hard money
10% down · 12.0% · 12mo
- Down + closing
- —
- Monthly P&I
- —
- Monthly cashflow
- —
- DSCR
- —
- Eligible?
- —
Short-term bridge; refi at stabilization.
Listing history 17 events
-
2026-06-19days on market $85,000 Active 32 DOM
-
2026-06-18days on market $85,000 Active 31 DOM
-
2026-06-17days on market $85,000 Active 30 DOM
-
2026-06-16days on market $85,000 Active 29 DOM
-
2026-06-15days on market $85,000 Active 28 DOM
-
2026-06-14days on market $85,000 Active 26 DOM
-
2026-06-12days on market $85,000 Active 25 DOM
-
2026-06-09days on market $85,000 Active 22 DOM
-
2026-06-08days on market $85,000 Active 21 DOM
-
2026-06-07days on market $85,000 Active 20 DOM
-
2026-06-05days on market $85,000 Active 17 DOM
-
2026-06-03days on market $85,000 Active 16 DOM
-
2026-06-02days on market $85,000 Active 15 DOM
-
2026-06-01days on market $85,000 Active 14 DOM
-
2026-05-31days on market $85,000 Active 13 DOM
-
2026-05-30days on market $85,000 Active 12 DOM
-
2026-05-14$85,000 Active
ⓘ Source: listings_history table (triggers on properties + properties_extension) + one-shot
backfill from property_details.listing_events for pre-trigger history.
Tax reassessment forecast MO · Resets to sale price
- Current annual tax
- $471 · $39/mo
- Projected year-2 tax
- $824 · $69/mo
- Expected delta
- +$353/yr (+$29/mo · 74.9%)
ⓘ Screening estimate from a state-policy table — verify with the county assessor before closing.
Climate risk First Street
- Flood 1/10 Low FEMA zone X (unshaded) · 0% chance over 30 yrs
- Wildfire 3/10 Moderate
- Heat 4/10 Moderate 7 d/yr ≥106°F today · 17 d/yr by 30 yrs out
- Wind 2/10 Low 0% chance of damaging wind over 30 yrs
- Air quality 2/10 Low 0 unhealthy d/yr today · 1 by 30 yrs out
Nearby sold comps map
Loading sold comps map…
Walkable amenities ~0.75 mi
Loading nearby amenities…
Taxation est. · year 1
- Rental income
- $11,846
- − Mortgage interest
- −$4,761
- − Property taxes
- −$471
- − Insurance
- −$425
- − Repairs & maintenance
- −$948
- − Management
- −$948
- − Depreciation
- −$2,473
- Taxable income
- $1,820
- Est. tax owed @ 24.0%
- −$437
- After-tax cash flow
- $2,676/yr
For passive investors: Depreciation is non-cash, so a rental often shows a tax loss while cash-flowing — sheltering income. Rental losses are passive: they offset passive income freely, and up to $25,000/yr can offset ordinary (W-2) income if you actively participate and your MAGI is under $100k (phasing out to $0 by $150k); unused losses carry forward. On sale, claimed depreciation is recaptured at up to 25%, and gains may owe capital-gains tax (a 1031 exchange can defer both). Figures are a year-1 estimate at your 24.0% rate — not tax advice; consult a CPA.
Schools (NCES district)
- District
- La Monte R-IV
- NCES district ID
- 2916920
- Math proficiency
- 25% ▬ 0.00%
- Reading proficiency
- 35% ▲ 5.00%
- Median HH income
- $43,109
- Composite
- 28.36/100
- National rank
- #12132
- State rank
- #455 of 535 in MO
Livability — La Monte
- Score
- 62/100
- State rank
- #393
- US rank
- #16922
Category grades
Schools grade is shown separately in the Schools card above.
Census & demographics
- Census place
- La Monte, MO
- Population (ZIP)
- 1,786
Population outlook (Pettis County) Hauer SSP2
- Today (2025)
- 41,992 people
- By 2030
- 41,584 · -1.0%
- By 2040
- 40,483 · -3.6%
- By 2050
- 39,049 · -7.0%
- By 2075
- 35,413 · -15.7%
- By 2100
- 30,870 · -26.5%
Race, ethnicity, and origin ACS 2023
- Neighborhood character
- Predominantly White (74%)
- Race & ethnicity
- White 74% Hispanic / Latino 22% Two or more races 4%
- Hispanic origin (detail)
- Mexican 21%
- Common ancestry
- Slovak 1% Portuguese 1% Italian 1%
- Foreign-born
- 12% · Canada
- Languages at home
- 83% English-only · Spanish 16% Other Asian/Pacific 1%
Political lean MEDSL · Pettis
- 2024 margin
- Solid R (+48.8) · D 24.9% · R 73.7% · Other 1.4%
- 2008→2024 swing
- -26.3pp toward R · 2008: -22.4pp · 2024: -48.8pp
- All cycles
- 2024: R+48.8 2020: R+47.5 2016: R+46.9 2012: R+28.8 2008: R+22.4
Not yet ingested
- Civics
- —
Market trends
- HPI YoY
- ▲ 5.37%
- Current HPI
- 236.7412
- Rent YoY
- —
- Metro
- —
- State GDP YoY
- ▲ 1.84%
- F500 in state
- 20
Industry mix (Fortune 500 HQ in MO)
| Industry | F500 HQs | Revenue |
|---|---|---|
| Healthcare | 1 | $163B |
|
||
| Insurance | 1 | $21B |
|
||
| Industrial Technology | 1 | $17B |
|
||
| Retail | 1 | $16B |
|
||
| Industrial Distribution | 1 | $10B |
|
||
| Utilities | 1 | $9B |
|
||
Price history
1 event — show timeline
- 2026-05-14 Listed $85,000 WCAR
Property tax history
-0.6%/yrLatest (2025): $471 · +4.7% YoY. Source: county tax records.
Cash-flow waterfall
monthlySold comps — $/sqft
last 12 mo · ≤1 miLoading sold comps…