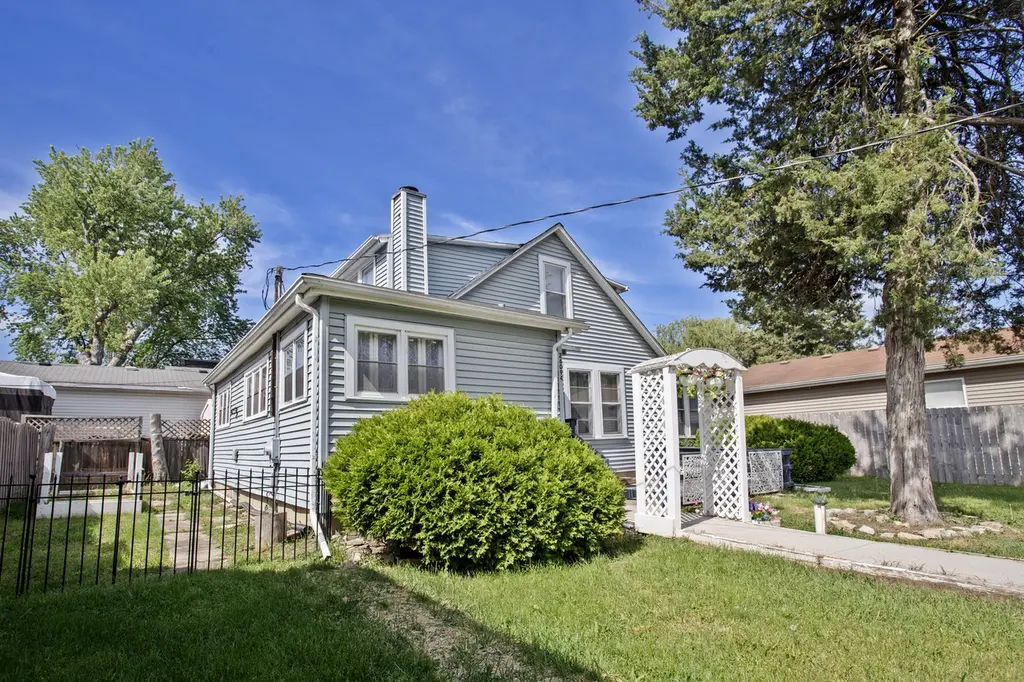
26094 W Ingleside Ave · Long Lake, IL
Flood risk 3/10 · Minor
- FEMA flood zone
- X (unshaded)
- Chance of flooding over 30 yrs
- 0.17%
- Est. flood insurance / yr
- $473 – $860
Fire risk 2/10 · Minimal
- Est. fire insurance / yr
- $804 – $1,492
Heat risk 2/10 · Minimal
- Hot days now (above 100°F)
- 7 days/yr
- Hot days in 30 yrs
- 14 days/yr
Wind risk 2/10 · Minimal
- Chance of severe wind over 30 yrs
- —
Air-quality risk 3/10 · Minor
- Unhealthy air days now
- 2 days/yr
- Unhealthy air days in 30 yrs
- 3 days/yr
Risk factors via First Street. Map © Google.
Why this score? — see what drove the C grade
The composite is a weighted blend of 9 inputs, each scored 0–100. Each bar is that input's sub-score; the figure is the points it added to the 100-point composite (weight × sub-score).
- Cash flow +21.0/30.0
- ARV discount +12.5/15.0
- DSCR +6.7/10.0
- 1% rule +5.3/10.0
- Livability +3.4/5.0
- Rent growth +2.5/5.0
- Condition / age +2.5/5.0
- Schools +2.3/10.0
- Appreciation +0.0/10.0
$215,000
🖨 Deal sheet 📄 Offer letter ✓ Due diligence
Listing remarks
Welcome to this charming 3-bedroom, 2-bath home in the heart of Ingleside with tons of potential for sweat equity! Offering a versatile floor plan with a convenient main-level bedroom and full bath, this home provides flexibility for guests, or a home office. The spacious layout features comfortable living areas, ample natural light, and plenty of room to make it your own. Outdoor enthusiasts will love the optional HOA membership, which may provide access to a boat slip on beautiful Long Lake when available-perfect for boating, fishing, and enjoying lake life. Whether you're looking for a year-round residence or a weekend retreat, this property offers the best of both worlds with neighborho
Key facts
- Main-level bedroom
- Full bath
- Long lake
Tags
Property features AI
Finance
- Other: Possession at closing
- Financial info: Special service area: No
- HOA & community: No master association fee required
Exterior
- Parking: 3 parking spaces
- Utilities: Well water; Public sewer
- Home design: Detached single-family home; 2-story residence; Fee simple ownership; Built over 100 years ago; Vinyl siding
- Construction: Vinyl siding construction; Built before 1978
- Exterior features: Lot dimensions approximately 55 x 122 x 55 x 122; Less than 0.25 acre lot; Water rights (community feature)
Interior
- Kitchen: Kitchen (approx. 7 x 15)
- Bedrooms: 3 bedrooms (Master on second level; other bedrooms on main and second levels); Bedroom dimensions include 10 x 13 (master), 10 x 10, and 12 x 9
- Bathrooms: 2 full bathrooms
- Heating & cooling: Natural gas heating
- Interior features: 7 total rooms; Full, unfinished basement
- Laundry & utility: Main-level laundry (approx. 5 x 6)
Neighborhood map
What this means for you Summary
Snapshot
- This is a 3-bed/1.0-bath single-family listed at $215k.
Deal economics
- At list price, monthly cash flow is $305 ($4k/yr) — positive.
- The deal already cash-flows at list — no discount required.
- Meets the 1% rule at list price ($2k rent vs $215k).
- Recommended offer: $212k (1.5% below list) — sets the bar for market timing.
Location & tenants
- Location reads 67/100 on livability (#527 in IL) — a middle-class / working-renter tenant base. Strengths: employment A+, cost of living A+, housing A+; Watch: amenities F, commute F, health & safety F.
- Grant Chsd 124 (suburban): math 23% / reading 27% proficiency, ranked #296 of 620 in IL (top 48%) — low school quality limits family demand, transient renter base, plan for 1-2y turnover.
- Zoned schools: Grant Community High School (math 23% / reading 27%, grade F, #247 of 693 statewide, top 36%, 1,837 students, 0% FRL).
- Market conditions: 35 active listings in the ZIP; 2 comparable units currently listed for rent nearby; 948 units permitted in Lake County in 2024 (424 in 5+ unit buildings).
Forward outlook
- Local home prices are declining (-3.0%/yr); year-one equity from $1k of loan paydown is wiped out by about $6k of value loss. Plan a longer hold.
- Lake County population projected to shrink 8% by 2050 — rents likely to lag national; underwrite the cash flow, not the appreciation.
Negotiation context
- It's been on market 15 days — a 2% lower offer ($212k) is reasonable based on typical stale-listing flexibility.
- Current owner paid $124k; list at $215k implies a 73% gain — meaningful room to come down on a strong offer.
Risks & watch-outs
- Watch-outs: built in 1925 — expect roof / HVAC / electrical / plumbing capex.
Questions for the listing agent
- Built in 1925 — when were the roof, HVAC, electrical panel, plumbing, and water heater last replaced?
- Is there a deadline driving the sale (1031 exchange, divorce, estate, relocation)? That informs how much negotiation room exists.
- Schools are D-rated, which usually means shorter tenancies and higher turnover. Who's the typical renter profile here, and what's been the actual vacancy rate?
- What's the average days-on-market for RENTAL listings here right now (not sales)? A rising rental-DOM trend means longer vacancies and softer asking-rent achievability than the comps imply.
- What's the recent tenant-quality profile in this submarket — average credit score on applications, eviction rate, late-payment / NSF rate, and stable-employment percentage? A property-management company in the area should have these aggregated.
- How much new for-sale + rental construction is in the pipeline within 1–3 miles? Heavy new supply typically softens prices + rents 12–24 months out; constrained supply supports both.
Investment metrics
- 1% rule
- 1.03% ✓
- Cap rate
- 7.99%
- Cash-on-cash
- 6.07%
- DSCR
- 1.27
- GRM
- 8.1
CMA / ARV
- ARV (on-the-fly)
- $242,017
- Comps found
- 12
Show comp detail 12 sales within ~0.75 mi
| Address | Dist | Beds/Ba | Sqft | Sold | Price | $/sf | Match |
|---|---|---|---|---|---|---|---|
| 26177 W Lakeview Ave | 0.11mi | 2/1.0 (-1) | 1,182 (+3%) | 3mo | $199,000 | $168 | 82 |
| 35706 N Benjamin Ave | 0.30mi | 3/2.0 | 1,100 (-4%) | 1mo | $250,000 | $227 | 74 |
| 35729 N Watson Ave | 0.30mi | 3/2.0 | 1,092 (-5%) | 7mo | $230,000 | $211 | 68 |
| 35790 N Wilson Rd | 0.37mi | 3/1.0 | 1,188 (+4%) | 12mo | $280,000 | $236 | 67 |
| 35737 N Hunt Ave | 0.32mi | 3/1.5 | 1,300 (+13%) | 1mo | $350,000 | $269 | 60 |
| 35694 N Helendale Rd | 0.31mi | 3/1.0 | 1,275 (+11%) | 10mo | $179,900 | $141 | 59 |
| 35728 N Benjamin Ave | 0.33mi | 4/2.0 (+1) | 1,028 (-10%) | 3mo | $240,000 | $233 | 56 |
| 35944 N Wilson Rd | 0.52mi | 3/1.0 | 1,031 (-10%) | 6mo | $200,000 | $194 | 54 |
| 35850 N Benjamin Ave | 0.44mi | 3/2.5 | 1,260 (+10%) | 12mo | $297,500 | $236 | 47 |
| 35193 N Wilson Rd | 0.26mi | 2/1.0 (-1) | 1,314 (+15%) | 14mo | $230,000 | $175 | 47 |
| 35104 N Rosewood Ave | 0.58mi | 2/2.0 (-1) | 1,281 (+12%) | 13mo | $190,000 | $148 | 34 |
| 35569 N Olive St | 0.58mi | 4/3.5 (+1) | 1,292 (+13%) | 15mo | $260,000 | $201 | 25 |
Match score weights: distance 35% · size 25% · config 20% · recency 20%. Top-matched comps best support the ARV.
Projected returns pro-forma
-3.0% appreciation · 3.0% rent growth · sell at horizon
- IRR
- -6.9%
- Equity multiple
- 0.74×
- Total profit
- $-15,432
- Equity at exit
- $32,057
- IRR
- 2.7%
- Equity multiple
- 1.19×
- Total profit
- $11,584
- Equity at exit
- $18,589
Cash invested: $60,200 (down + closing). Projections, not guarantees.
Landlord ↔ Tenant lean methodology
- Overall (STATE)
- 43 Moderately Tenant-Leaning
- State Illinois
- 43 Moderately Tenant-Leaning · D+7
- County
- — inherits STATE
- City
- — inherits STATE
ZIP-level market 60041
- Home prices YoY
- -25.0%
- Active inventory
- 35
- Price-to-rent
- 8.1×
Monthly cashflow live
- Estimated rent
- $2,220 medium interval (Pro) →
- Mortgage (P&I)
- −$1,127
- Tax from tax record
- −$233 /mo · $2,790/yr
- Insurance
- −$90
- HOA
- −$0
- Vacancy / Maint / Mgmt
- −$466
- Net cashflow
- $305
Break-even live
UW: 25.0% down · 7.5% · 30yr · 1.5% tax · 5.0% vac · 8.0% maint · 8.0% mgmt
Financing live
Cash to close
- Down payment
- $53,750
- Closing costs
- $6,450
- Reserves months
- —
- Total cash needed
- —
Loan-product check · same deal, 3 products live
Conventional
25% down · 7.5% · 30yr
- Down + closing
- —
- Monthly P&I
- —
- Monthly cashflow
- —
- DSCR
- —
- Eligible?
- —
Personal DTI + credit; lowest rate.
DSCR
20% down · 8.5% · 30yr
- Down + closing
- —
- Monthly P&I
- —
- Monthly cashflow
- —
- DSCR
- —
- Eligible?
- —
No personal income docs; deal must DSCR.
Hard money
10% down · 12.0% · 12mo
- Down + closing
- —
- Monthly P&I
- —
- Monthly cashflow
- —
- DSCR
- —
- Eligible?
- —
Short-term bridge; refi at stabilization.
Rent comps 2 comps
| Address | Beds | Baths | Sqft | Rent | $/sqft | DOM | Units | Dist |
|---|---|---|---|---|---|---|---|---|
| 1431 W Split Oak Cir Round Lake Beach, IL | 2.0 | 1.5 | 1080 | $2,150 | $1.99 | 44d | 1 | 1.44mi |
| 1217 N Village Dr Round Lake Beach, IL | 2.0 | 1.5 | 1330 | $2,300 | $1.73 | 1d | 1 | 1.49mi |
Listing history 11 events
-
2026-06-18days on market $215,000 Active 15 DOM
-
2026-06-17days on market $215,000 Active 14 DOM
-
2026-06-16days on market $215,000 Active 13 DOM
-
2026-06-15days on market $215,000 Active 12 DOM
-
2026-06-13statusdays on market $215,000 Active 10 DOM
-
2026-06-09days on market $215,000 Contingent - Continue to Show 6 DOM
-
2026-06-08days on market $215,000 Contingent - Continue to Show 5 DOM
-
2026-06-08status $215,000 Contingent - Continue to Show 4 DOM
-
2026-06-07days on market $215,000 Active 4 DOM
-
2026-06-04remarks 699-char remark
-
2026-06-04$215,000 Active 1 DOM
ⓘ Source: listings_history table (triggers on properties + properties_extension) + one-shot
backfill from property_details.listing_events for pre-trigger history.
Tax reassessment forecast IL · Partial reset (capped growth)
- Current annual tax
- $2,790 · $233/mo
- Projected year-2 tax
- $3,835 · $320/mo
- Expected delta
- +$1,045/yr (+$87/mo · 37.5%)
ⓘ Screening estimate from a state-policy table — verify with the county assessor before closing.
Climate risk First Street
- Flood 3/10 Moderate FEMA zone X (unshaded) · 17% chance over 30 yrs
- Wildfire 2/10 Low
- Heat 2/10 Low 7 d/yr ≥100°F today · 14 d/yr by 30 yrs out
- Wind 2/10 Low
- Air quality 3/10 Moderate 2 unhealthy d/yr today · 3 by 30 yrs out
Nearby sold comps map
Loading sold comps map…
Walkable amenities ~0.75 mi
Loading nearby amenities…
Taxation est. · year 1
- Rental income
- $26,645
- − Mortgage interest
- −$12,043
- − Property taxes
- −$2,790
- − Insurance
- −$1,075
- − Repairs & maintenance
- −$2,132
- − Management
- −$2,132
- − Depreciation
- −$6,255
- Taxable income
- $219
- Est. tax owed @ 24.0%
- −$52
- After-tax cash flow
- $3,602/yr
For passive investors: Depreciation is non-cash, so a rental often shows a tax loss while cash-flowing — sheltering income. Rental losses are passive: they offset passive income freely, and up to $25,000/yr can offset ordinary (W-2) income if you actively participate and your MAGI is under $100k (phasing out to $0 by $150k); unused losses carry forward. On sale, claimed depreciation is recaptured at up to 25%, and gains may owe capital-gains tax (a 1031 exchange can defer both). Figures are a year-1 estimate at your 24.0% rate — not tax advice; consult a CPA.
Schools (NCES district)
- District
- Grant Chsd 124
- NCES district ID
- 1717340
- Math proficiency
- 23% ▼ -9.00%
- Reading proficiency
- 27% ▼ -7.00%
- Median HH income
- $59,450
- Composite
- 22.95/100
- National rank
- #7989
- State rank
- #296 of 620 in IL
Livability — Long Lake
- Score
- 67/100
- State rank
- #527
- US rank
- #10914
Category grades
Schools grade is shown separately in the Schools card above.
Census & demographics
- Census place
- Long Lake, IL
- Population (ZIP)
- 8,920
Population outlook (Lake County) Hauer SSP2
- Today (2025)
- 700,217 people
- By 2030
- 693,290 · -1.0%
- By 2040
- 673,588 · -3.8%
- By 2050
- 643,556 · -8.1%
- By 2075
- 562,792 · -19.6%
- By 2100
- 457,715 · -34.6%
Race, ethnicity, and origin ACS 2023
- Neighborhood character
- Predominantly White (65%)
- Race & ethnicity
- White 65% Hispanic / Latino 23% Two or more races 15% Black 4% Asian 2%
- Hispanic origin (detail)
- Mexican 15% Puerto Rican 2% Cuban 2%
- Common ancestry
- Romanian 12% Lithuanian 3% Iranian 2%
- Foreign-born
- 8% · Canada
- Languages at home
- 83% English-only · Spanish 15% Russian/Polish/Slavic 1% French/Haitian/Cajun 1%
Political lean MEDSL · Lake
- 2024 margin
- Strong D (+20.8) · D 59.7% · R 38.9% · Other 1.4%
- 2008→2024 swing
- +1.1pp toward D · 2008: 19.6pp · 2024: 20.8pp
- All cycles
- 2024: D+20.8 2020: D+24.1 2016: D+20.3 2012: D+8.1 2008: D+19.6
Not yet ingested
- Civics
- —
Market trends
- HPI YoY
- ▼ -76.75%
- Current HPI
- 230.4464
- Rent YoY
- —
- Metro
- —
- State GDP YoY
- ▲ 1.59%
- F500 in state
- 60
Industry mix (Fortune 500 HQ in IL)
| Industry | F500 HQs | Revenue |
|---|---|---|
| Insurance | 4 | $201B |
|
||
| Consumer Goods | 4 | $87B |
|
||
| Industrial Machinery | 3 | $64B |
|
||
| Healthcare | 2 | $55B |
|
||
| Retail / Pharmacy | 1 | $148B |
|
||
| Agriculture / Food | 1 | $86B |
|
||
Price history
+73.4% since first listed2 events — show timeline
- 2026-06-03 Listed $215,000 MRED as Distributed by MLS Grid
- 2004-12-22 Sold (Public Records) $124,000 Public Records
Property tax history
+1.7%/yrLatest (2024): $2,790 · -2.3% YoY. Source: county tax records.
Cash-flow waterfall
monthlySold comps — $/sqft
last 12 mo · ≤1 miLoading sold comps…