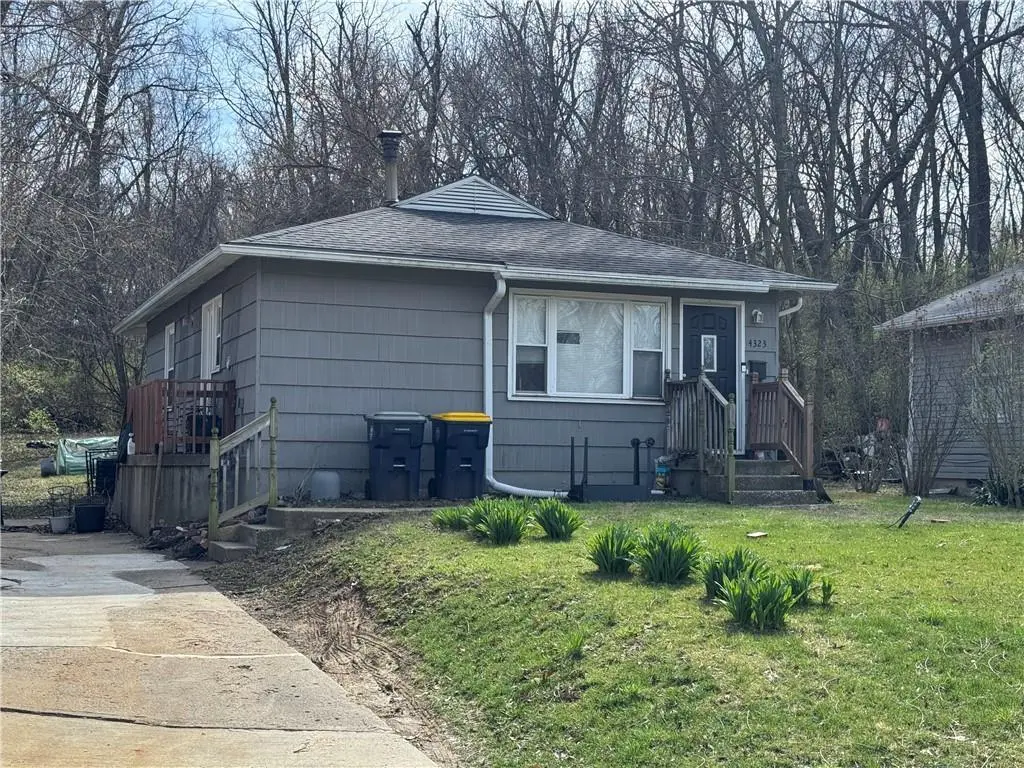
4323 Towers Rd · Kansas City, MO
Flood risk 1/10 · Minimal
- FEMA flood zone
- X (unshaded)
- Chance of flooding over 30 yrs
- 0.0%
- Est. flood insurance / yr
- $507 – $1,088
Fire risk 1/10 · Minimal
- Est. fire insurance / yr
- $1,054 – $1,958
Heat risk 4/10 · Minor
- Hot days now (above 107°F)
- 7 days/yr
- Hot days in 30 yrs
- 16 days/yr
Wind risk 2/10 · Minimal
- Chance of severe wind over 30 yrs
- —
Air-quality risk 3/10 · Minor
- Unhealthy air days now
- 3 days/yr
- Unhealthy air days in 30 yrs
- 5 days/yr
Risk factors via First Street. Map © Google.
Why this score? — see what drove the B- grade
The composite is a weighted blend of 9 inputs, each scored 0–100. Each bar is that input's sub-score; the figure is the points it added to the 100-point composite (weight × sub-score).
- Cash flow +30.0/30.0
- DSCR +10.0/10.0
- 1% rule +7.7/10.0
- ARV discount +7.0/15.0
- Livability +3.9/5.0
- Rent growth +3.6/5.0
- Condition / age +2.5/5.0
- Schools +1.5/10.0
- Appreciation +0.0/10.0
$103,750
🖨 Deal sheet (PDF) 📄 Offer letter ✓ Due diligence
Listing remarks MLS
Turnkey investment opportunity in Kansas City! This 3-bedroom, 1-bath ranch sits on a quiet street with a tenant already in place — no waiting for cash flow from day one. Updated kitchen, bathrooms and hardwood floors make this gem appealing. This property is being sold as part of a 6 property package deal see MLS#'s
Key facts
- Quiet street
- Updated bathrooms
- Updated kitchen
Tags
Neighborhood map
What this means for you Summary
Snapshot
- This is a 3-bed/1.0-bath single-family listed at $104k.
Deal economics
- At list price, monthly cash flow is $418 ($5k/yr) — positive.
- The deal already cash-flows at list — no discount required.
- Meets the 1% rule at list price ($1k rent vs $104k).
- Recommended offer: $98k (6.0% below list) — sets the bar for market timing.
- Cap rate 11.1% vs local median 3.9% in Kansas City — top-decile yield for the area; either an underpriced asset or a hidden risk that comps aren't pricing in. Stress-test before assuming the spread holds.
Location & tenants
- Location reads 78/100 on livability (#28 in MO, #2,671 nationally) — a middle-class / working-renter tenant base. Strengths: amenities A+, commute A+, cost of living A+; Watch: crime F.
- Kansas City 33 (urban): math 12% / reading 24% proficiency, ranked #308 of 324 in MO (top 95%) — low school quality limits family demand, transient renter base, plan for 1-2y turnover; 75% free/reduced lunch — lower-income household profile, screen leases tightly.
- Zoned schools: M. L. King Elementary (math 2% / reading 8%, grade F, #1,072 of 1,115 statewide, top 98%, 665 students, 100% FRL); Central Middle School (math 0% / reading 9%, grade F, #388 of 391 statewide, top 99%, 428 students, 99% FRL); Central High School (math 2% / reading 17%, grade F, #507 of 521 statewide, top 98%, 535 students, 99% FRL) — zoned schools average 99% FRL vs 75% district-wide (24 pts higher); higher-poverty schools than district average — tighter screening recommended.
- Market conditions: Rents rising fast (+4.4%/yr); 185 active listings in the ZIP; 31 comparable units currently listed for rent nearby; rentals at typical pace (median 18d on market — plan ~3-4 weeks tenant-placement turnaround); lower-income renter base — watch delinquency; 4,002 units permitted in Jackson County in 2024 (2,271 in 5+ unit buildings).
- This rent runs 37% of the median local income ($42k/yr) — at the standard rent-burdened threshold; future hikes will face affordability resistance.
Forward outlook
- Local home prices are declining (-3.0%/yr); year-one equity from $718 of loan paydown is wiped out by about $3k of value loss. Plan a longer hold.
- Jackson County population projected at +4% by 2050 — modest demand growth; plan on rents tracking national, not racing it.
- At projected returns (-3.0% appreciation + 4.4% rent growth), your $29k cash investment doubles in ~7 years — after that, you're playing with house money.
Negotiation context
- It's been on market 63 days — a 6% lower offer ($98k) is reasonable based on typical stale-listing flexibility.
- 4 sale attempts since 8y ago with the ask held roughly flat each time — persistent listings suggest the price (not the market) is what's stuck; bring a comps-based counter.
Risks & watch-outs
- Watch-outs: built in 1956 — expect roof / HVAC / electrical / plumbing capex.
Questions for the listing agent
- It's been on market 63 days. Have you received any prior offers? Is the seller open to a 6% concession, seller financing, or rate buy-down credit?
- Built in 1956 — when were the roof, HVAC, electrical panel, plumbing, and water heater last replaced?
- Why hasn't it sold? Are there any deal-killer items the seller is aware of (foundation, flood, title, zoning, code violations)?
- Is there a deadline driving the sale (1031 exchange, divorce, estate, relocation)? That informs how much negotiation room exists.
- Crime grade is F in this area — have there been break-ins, vandalism, or insurance claims at this property in the last 3 years? What carrier currently insures it and at what premium?
- What's the average days-on-market for RENTAL listings here right now (not sales)? A rising rental-DOM trend means longer vacancies and softer asking-rent achievability than the comps imply.
- What's the recent tenant-quality profile in this submarket — average credit score on applications, eviction rate, late-payment / NSF rate, and stable-employment percentage? A property-management company in the area should have these aggregated.
- How much new for-sale + rental construction is in the pipeline within 1–3 miles? Heavy new supply typically softens prices + rents 12–24 months out; constrained supply supports both.
Investment metrics
- 1% rule
- 1.27% ✓
- Cap rate
- 11.12%
- Cash-on-cash
- 17.25%
- DSCR
- 1.77
- GRM
- 6.6
CMA / ARV
- ARV (median comp)
- $102,498
- List price
- $103,750
- Delta
- 1.22%
- Verdict
- FAIR
- Comps
- 20 within 1.0 mi
Show comp detail 12 sales within ~0.75 mi
| Address | Dist | Beds/Ba | Sqft | Sold | Price | $/sf | Match |
|---|---|---|---|---|---|---|---|
| 3938 Myrtle Ave | 0.37mi | 2/1.0 (-1) | 805 (-1%) | 0mo | $65,000 | $81 | 75 |
| 4132 Spruce Ave | 0.08mi | 3/1.0 | 912 (+12%) | 2mo | $99,995 | $110 | 75 |
| 4521 Lawn Ave | 0.49mi | 3/1.0 | 816 (0%) | 4mo | $88,000 | $108 | 74 |
| 4504 E 43rd St | 0.16mi | 2/1.0 (-1) | 907 (+11%) | 2mo | $140,000 | $154 | 68 |
| 4135 Jackson Ave | 0.13mi | 2/1.0 (-1) | 720 (-12%) | 2mo | $68,900 | $96 | 68 |
| 4338 Myrtle Ave | 0.38mi | 2/1.0 (-1) | 780 (-4%) | 3mo | $125,000 | $160 | 67 |
| 3918 Oakley Ave | 0.74mi | 3/1.0 | 816 (0%) | 3mo | $106,000 | $130 | 63 |
| 3942 Myrtle Ave | 0.36mi | 2/1.0 (-1) | 890 (+9%) | 3mo | $85,000 | $96 | 61 |
| 4410 Myrtle Ave | 0.42mi | 3/1.0 | 912 (+12%) | 4mo | $80,000 | $88 | 57 |
| 3630 Jackson Ave | 0.66mi | 2/1.0 (-1) | 888 (+9%) | 5mo | $59,000 | $66 | 46 |
| 3601 Norton Ave | 0.73mi | 2/1.0 (-1) | 725 (-11%) | 3mo | $40,000 | $55 | 39 |
| 3640 Cleveland Ave | 0.74mi | 2/2.0 (-1) | 900 (+10%) | 4mo | $105,000 | $117 | 36 |
Match score weights: distance 35% · size 25% · config 20% · recency 20%. Top-matched comps best support the ARV.
Projected returns pro-forma
-3.0% appreciation · 4.42% rent growth · sell at horizon
- IRR
- 10.0%
- Equity multiple
- 1.40×
- Total profit
- $11,663
- Equity at exit
- $15,469
- IRR
- 20.2%
- Equity multiple
- 2.80×
- Total profit
- $52,329
- Equity at exit
- $8,970
Cash invested: $29,050 (down + closing). Projections, not guarantees.
Landlord ↔ Tenant lean methodology
- Overall (STATE)
- 81 Strongly Landlord-Friendly
- State Missouri
- 81 Strongly Landlord-Friendly · R+10
- County
- — inherits STATE
- City
- — inherits STATE
ZIP-level market 64130
- Home prices YoY
- -21.5%
- Rents YoY
- 4.4%
- Active inventory
- 185
- Price-to-rent
- 6.6×
Monthly cashflow live
- Estimated rent
- $1,319 high interval (Pro) →
- Mortgage (P&I)
- −$544
- Tax from tax record
- −$37 /mo · $443/yr
- Insurance
- −$43
- HOA
- −$0
- Vacancy / Maint / Mgmt
- −$277
- Net cashflow
- $418
Break-even live
Sensitivity live
| Price | -10% $476 | -5% $447 | +0% $418 | +5% $388 | +10% $359 |
|---|---|---|---|---|---|
| Rent | -10% $313 | -5% $366 | +0% $418 | +5% $470 | +10% $522 |
| Rate | -1.0pp $470 | -0.5pp $444 | base $418 | +0.5pp $391 | +1.0pp $363 |
UW: 25.0% down · 7.5% · 30yr · 1.5% tax · 5.0% vac · 8.0% maint · 8.0% mgmt
Financing live
Cash to close
- Down payment
- $25,938
- Closing costs
- $3,112
- Reserves months
- —
- Total cash needed
- —
Loan-product check · same deal, 3 products live
Conventional
25% down · 7.5% · 30yr
- Down + closing
- —
- Monthly P&I
- —
- Monthly cashflow
- —
- DSCR
- —
- Eligible?
- —
Personal DTI + credit; lowest rate.
DSCR
20% down · 8.5% · 30yr
- Down + closing
- —
- Monthly P&I
- —
- Monthly cashflow
- —
- DSCR
- —
- Eligible?
- —
No personal income docs; deal must DSCR.
Hard money
10% down · 12.0% · 12mo
- Down + closing
- —
- Monthly P&I
- —
- Monthly cashflow
- —
- DSCR
- —
- Eligible?
- —
Short-term bridge; refi at stabilization.
Rent comps 31 comps
| Address | Beds | Baths | Sqft | Rent | $/sqft | DOM | Units | Dist |
|---|---|---|---|---|---|---|---|---|
| 4028 Myrtle Ave Kansas City, MO | 3.0 | 1.0 | 1100 | $1,490 | $1.35 | 45d | 1 | 0.29mi |
| 4216 Cleveland Ave Kansas City, MO | 2.0 | 1.0 | 780 | $1,125 | $1.44 | 17d | 1 | 0.40mi |
| 4206 Vineyard Rd Kansas City, MO | 4.0 | 1.5 | 1056 | $1,500 | $1.42 | 16d | 1 | 0.45mi |
| 3736 Cypress Ave Kansas City, MO | 3.0 | 1.0 | 1100 | $1,200 | $1.09 | 9d | 1 | 0.48mi |
| 4902 E 39th St Kansas City, MO | 2.0 | 1.0 | 820 | $1,300 | $1.59 | 17d | 1 | 0.51mi |
| 4005 Bales Ave Kansas City, MO | 2.0 | 1.0 | 792 | $1,050 | $1.33 | 45d | 1 | 0.58mi |
| 4309 College Ave Kansas City, MO | 3.0 | 2.0 | 1040 | $1,550 | $1.49 | 17d | 1 | 0.70mi |
| 4144 College Ave Kansas City, MO | 3.0 | 1.0 | 1108 | $1,095 | $0.99 | 25d | 1 | 0.70mi |
| 5601 E 39th Ter Kansas City, MO | 3.0 | 1.0 | 816 | $1,225 | $1.50 | 4d | 1 | 0.74mi |
| 3911 Oakley Ave Kansas City, MO | 2.0 | 1.0 | 816 | $1,195 | $1.46 | 14d | 1 | 0.77mi |
| 5636 E 40th St Kansas City, MO | 3.0 | 1.0 | 816 | $1,225 | $1.50 | 4d | 1 | 0.82mi |
| 5700 E 40th St Kansas City, MO | 3.0 | 1.0 | 816 | $1,245 | $1.53 | 22d | 1 | 0.83mi |
| 5707 E 40th St Kansas City, MO | 3.0 | 1.0 | 816 | $1,295 | $1.59 | 13d | 1 | 0.85mi |
| 3437 Jackson Ave Kansas City, MO | 2.0 | 1.0 | 700 | $1,150 | $1.64 | 17d | 1 | 0.87mi |
| 3414 Elmwood Ave Kansas City, MO | 4.0 | 1.0 | 1109 | $1,300 | $1.17 | 17d | 1 | 0.92mi |
| 4427 Agnes Ave Kansas City, MO | 3.0 | 1.0 | 1100 | $1,350 | $1.23 | 17d | 1 | 0.94mi |
| 4534 S Benton Ave Kansas City, MO | 2.0 | 1.0 | 912 | $1,045 | $1.15 | 17d | 1 | 1.09mi |
| 3949 Doctor Martin Luther King Junior Blvd Kansas City, MO | 1.0–2.0 | 1.0–2.0 | 945 | $1,565 | $1.66 | 3d | 3 | 1.11mi |
| 3310 College Ave Kansas City, MO | 3.0 | 1.0 | 874 | $995 | $1.14 | 45d | 1 | 1.26mi |
| 3243 Denver Dr Kansas City, MO | 1.0–3.0 | 1.0 | 862 | $1,226 | $1.42 | 45d | 1 | 1.26mi |
| 3841 Olive St Kansas City, MO | 2.0 | 1.0 | 792 | $985 | $1.24 | 16d | 1 | 1.28mi |
| 3118 Chelsea Ave Kansas City, MO | 2.0 | 1.0 | 864 | $980 | $1.13 | 45d | 1 | 1.29mi |
| 2305 E 41st St Kansas City, MO | 2.0 | 1.0 | 750 | $1,000 | $1.33 | 9d | 1 | 1.29mi |
| 3710 Wabash Ave Unit 2S Kansas City, MO | 2.0 | 1.0 | 875 | $850 | $0.97 | 25d | 1 | 1.32mi |
| 4911 S Benton Ave Kansas City, MO | 2.0 | 1.0 | 1000 | $1,100 | $1.10 | 18d | 1 | 1.33mi |
| 4917 S Benton Ave Kansas City, MO | 2.0 | 1.0 | 1000 | $1,100 | $1.10 | 25d | 1 | 1.34mi |
| 3330 Agnes Ave Kansas City, MO | 3.0 | 1.0 | 1000 | $1,410 | $1.41 | 45d | 1 | 1.34mi |
| 3032 Elmwood Ave Kansas City, MO | 3.0 | 1.0 | 1027 | $1,275 | $1.24 | 9d | 1 | 1.37mi |
| 5013 S Benton Ave Kansas City, MO | 3.0 | 1.0 | 978 | $1,225 | $1.25 | 25d | 1 | 1.42mi |
| 3017 E 51st St Kansas City, MO | 2.0 | 1.0 | 621 | $1,303 | $2.10 | 9d | 1 | 1.45mi |
| 3315 E 52nd St Kansas City, MO | 2.0 | 1.0 | 662 | $1,125 | $1.70 | 25d | 1 | 1.45mi |
Listing history 9 events
-
2026-03-24$103,750 Active 324-char remark
Show marketing remark (324 chars)
Turnkey investment opportunity in Kansas City! This 3-bedroom, 1-bath ranch sits on a quiet street with a tenant already in place — no waiting for cash flow from day one. Updated kitchen, bathrooms and hardwood floors make this gem appealing. This property is being sold as part of a 6 property package deal see MLS#'s
-
2024-03-18historical $1,100
-
2024-03-13price $1,100
-
2024-03-12$900
-
2019-08-27status Pending
-
2019-08-27$75,950 Active
-
2018-10-11soldstatus Sold
-
2018-10-04status Pending
-
2018-09-23$23,900 Active
ⓘ Source: listings_history table (triggers on properties + properties_extension) + one-shot
backfill from property_details.listing_events for pre-trigger history.
Tax reassessment forecast MO · Resets to sale price
- Current annual tax
- $443 · $37/mo
- Projected year-2 tax
- $1,006 · $84/mo
- Expected delta
- +$564/yr (+$47/mo · 127.4%)
ⓘ Screening estimate from a state-policy table — verify with the county assessor before closing.
Climate risk First Street
- Flood 1/10 Low FEMA zone X (unshaded) · 0% chance over 30 yrs
- Wildfire 1/10 Low
- Heat 4/10 Moderate 7 d/yr ≥107°F today · 16 d/yr by 30 yrs out
- Wind 2/10 Low
- Air quality 3/10 Moderate 3 unhealthy d/yr today · 5 by 30 yrs out
Nearby sold comps map
Loading sold comps map…
Walkable amenities ~0.75 mi
Loading nearby amenities…
Taxation est. · year 1
- Rental income
- $15,825
- − Mortgage interest
- −$5,812
- − Property taxes
- −$443
- − Insurance
- −$519
- − Repairs & maintenance
- −$1,266
- − Management
- −$1,266
- − Depreciation
- −$3,018
- Taxable income
- $3,502
- Est. tax owed @ 24.0%
- −$841
- After-tax cash flow
- $4,171/yr
For passive investors: Depreciation is non-cash, so a rental often shows a tax loss while cash-flowing — sheltering income. Rental losses are passive: they offset passive income freely, and up to $25,000/yr can offset ordinary (W-2) income if you actively participate and your MAGI is under $100k (phasing out to $0 by $150k); unused losses carry forward. On sale, claimed depreciation is recaptured at up to 25%, and gains may owe capital-gains tax (a 1031 exchange can defer both). Figures are a year-1 estimate at your 24.0% rate — not tax advice; consult a CPA.
Schools (NCES district)
- District
- Kansas City 33
- NCES district ID
- 2916400
- Math proficiency
- 12% ▼ -8.00%
- Reading proficiency
- 24% ▬ 0.00%
- Median HH income
- $35,227
- Composite
- 14.8/100
- National rank
- #9387
- State rank
- #308 of 324 in MO
Livability — Kansas City
- Score
- 78/100
- State rank
- #28
- US rank
- #2671
Category grades
Schools grade is shown separately in the Schools card above.
Census & demographics
- Census place
- Kansas City, MO
- County
- Jackson County · 687,798 people
- City population
- 439,467
- Metro
- Kansas City, MO-KS
- Population (ZIP)
- 19,644
- Household income
- $42,221
- Rent vs Own
- Severe rent burden
- 1132.0
Population outlook (Jackson County) Hauer SSP2
- Today (2025)
- 719,589 people
- By 2030
- 731,456 · +1.6%
- By 2040
- 746,689 · +3.8%
- By 2050
- 749,289 · +4.1%
- By 2075
- 736,227 · +2.3%
- By 2100
- 668,210 · -7.1%
Race, ethnicity, and origin ACS 2023
- Neighborhood character
- Predominantly Black (80%)
- Race & ethnicity
- Black 80% White 9% Hispanic / Latino 8% Two or more races 6%
- Hispanic origin (detail)
- Mexican 5%
- Common ancestry
- Lithuanian 1% Swedish 0%
- Foreign-born
- 6% · Canada
- Languages at home
- 92% English-only · Spanish 7%
Political lean MEDSL · Jackson
- 2024 margin
- D (+19.3) · D 58.9% · R 39.5% · Other 1.6%
- 2008→2024 swing
- -6.1pp toward R · 2008: 25.4pp · 2024: 19.3pp
- All cycles
- 2024: D+19.3 2020: D+22.0 2016: D+16.6 2012: D+19.0 2008: D+25.4
Not yet ingested
- Civics
- —
Market trends
- HPI YoY
- ▼ -73.32%
- Current HPI
- 267.491
- Rent YoY
- ▲ 4.42%
- Metro
- Kansas City, MO-KS
- State GDP YoY
- ▲ 1.84%
- F500 in state
- 20
Industry mix (Fortune 500 HQ in MO)
| Industry | F500 HQs | Revenue |
|---|---|---|
| Healthcare | 1 | $163B |
|
||
| Insurance | 1 | $21B |
|
||
| Industrial Technology | 1 | $17B |
|
||
| Retail | 1 | $16B |
|
||
| Industrial Distribution | 1 | $10B |
|
||
| Utilities | 1 | $9B |
|
||
Price history
+334.1% since first listed9 events — show timeline
- 2026-03-24 Listed $103,750 Heartland MLS as Distributed by MLS Grid
- 2024-03-18 Rental Removed $1,100 BUILDIUM
- 2024-03-13 Price Changed $1,100 BUILDIUM
- 2024-03-12 Listed for Rent $900 BUILDIUM
- 2019-08-27 Pending — Heartland MLS as Distributed by MLS Grid
- 2019-08-27 Listed $75,950 Heartland MLS as Distributed by MLS Grid
- 2018-10-11 Sold (MLS) — Heartland MLS as Distributed by MLS Grid
- 2018-10-04 Pending — Heartland MLS as Distributed by MLS Grid
- 2018-09-23 Listed $23,900 Heartland MLS as Distributed by MLS Grid
Property tax history
+1.3%/yrLatest (2025): $443 · -30.7% YoY. Source: county tax records.
Cash-flow waterfall
monthlySold comps — $/sqft
last 12 mo · ≤1 miLoading sold comps…