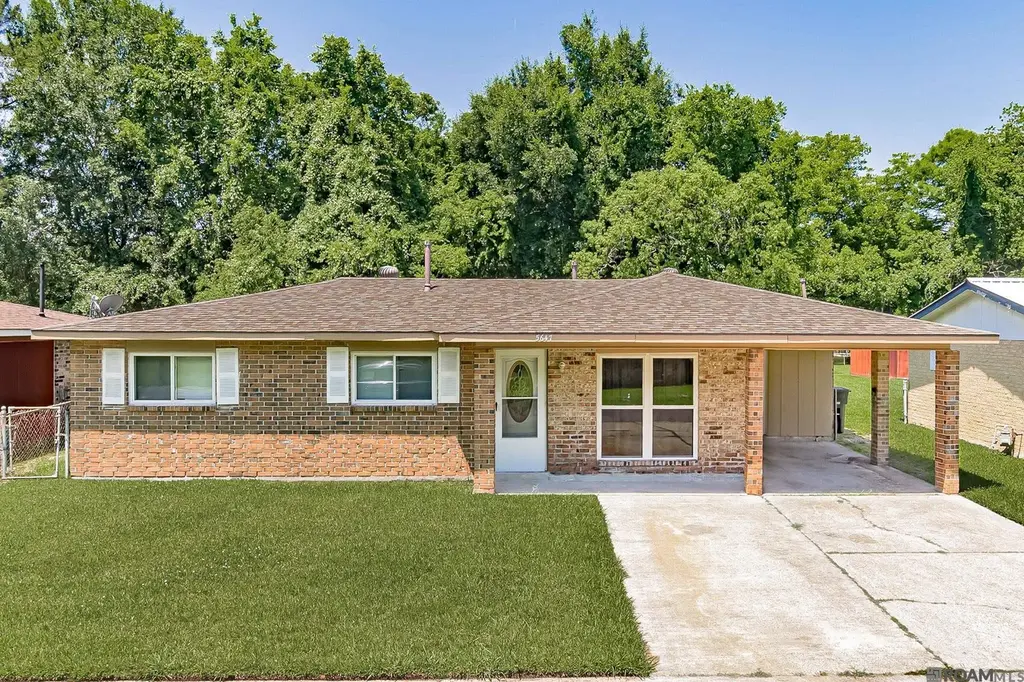
5647 Atlanta Ave · Merrydale, LA
Flood risk 1/10 · Minimal
- FEMA flood zone
- X (unshaded)
- Chance of flooding over 30 yrs
- 0.0%
- Est. flood insurance / yr
- $507 – $1,088
Fire risk 1/10 · Minimal
- Est. fire insurance / yr
- $1,269 – $2,357
Heat risk 8/10 · Major
- Hot days now (above 108°F)
- 7 days/yr
- Hot days in 30 yrs
- 20 days/yr
Wind risk 9/10 · Severe
- Chance of severe wind over 30 yrs
- 99.0%
Air-quality risk 3/10 · Minor
- Unhealthy air days now
- 3 days/yr
- Unhealthy air days in 30 yrs
- 4 days/yr
Risk factors via First Street. Map © Google.
Why this score? — see what drove the C grade
The composite is a weighted blend of 9 inputs, each scored 0–100. Each bar is that input's sub-score; the figure is the points it added to the 100-point composite (weight × sub-score).
- Cash flow +20.3/30.0
- Appreciation +8.0/10.0
- ARV discount +7.3/15.0
- DSCR +6.4/10.0
- 1% rule +4.6/10.0
- Livability +2.9/5.0
- Rent growth +2.5/5.0
- Condition / age +2.5/5.0
- Schools +2.4/10.0
$125,000
🖨 Deal sheet 📄 Offer letter ✓ Due diligence
Listing remarks MLS
Charming brick home with a NEW ROOF (MARCH 2026) and NEW WINDOWS throughout! This 3-bedroom, 1.5-bath home offers a comfortable layout and a spacious fenced backyard perfect for relaxing or entertaining. Features include a window unit in the living room with both A/C and heat, a covered carport, and plenty of outdoor space for kids, pets, or gatherings. A great opportunity for homeowners or investors alike!
Key facts
- Covered carport
- Outdoor space
- Fenced backyard
Tags
Property features AI
Finance
- Other: Located in the East Fairlane subdivision; Directions available
Exterior
- Parking: Carport
- Utilities: Public water; Public sewer
- Home design: Detached single-family residence; Residential property
- Construction: Brick construction; Slab foundation; Built in 2026
- Exterior features: Chain link fence
Interior
- Kitchen: Gas cooktop
- Flooring: Laminate
- Bathrooms: 1 full bathroom; 1 partial bathroom
- Heating & cooling: Window unit(s) for cooling; Other heating
- Interior features: Laminate flooring; Gas cooktop
Neighborhood map
What this means for you Summary
Snapshot
- This is a 3-bed/1.5-bath single-family listed at $125k.
Deal economics
- At list price, monthly cash flow is $159 ($2k/yr) — positive.
- The deal already cash-flows at list — no discount required.
- To meet the 1% rule (rent ≥ 1% of price), the offer needs to be $120k (4.2% below list).
- Recommended offer: $120k (4.2% below list) — sets the bar for 1% rule.
Location & tenants
- Location reads 58/100 on livability (#301 in LA) — a working-class tenant base; expect higher turnover. Strengths: cost of living A+, housing A; Watch: schools C-, crime F, amenities F.
- East Baton Rouge Parish (urban): math 22% / reading 34% proficiency, ranked #47 of 98 in LA (top 48%) — low school quality limits family demand, transient renter base, plan for 1-2y turnover; 77% free/reduced lunch — lower-income household profile, screen leases tightly.
- Market conditions: 39 active listings in the ZIP; 12 comparable units currently listed for rent nearby; rentals at typical pace (median 24d on market — plan ~3-4 weeks tenant-placement turnaround); 2,252 units permitted in East Baton Rouge Parish in 2024 (440 in 5+ unit buildings).
Forward outlook
- In year one you build about $8k of equity ($864 loan paydown + $7k appreciation (5.9% local appreciation)).
- East Baton Rouge County population projected at +4% by 2050 — modest demand growth; plan on rents tracking national, not racing it.
- At projected returns (5.9% appreciation + 3.0% rent growth), your $35k cash investment doubles in ~4 years — after that, you're playing with house money.
- By year 5, paydown + projected appreciation supports a ~$36k cash-out refi (75% LTV) — recoverable capital for the next deal without selling this one.
Negotiation context
- It's been on market 17 days — a 2% lower offer ($123k) is reasonable based on typical stale-listing flexibility.
- 2 sale attempts with the ask held roughly flat each time — persistent listings suggest the price (not the market) is what's stuck; bring a comps-based counter.
Risks & watch-outs
- Climate carrying-cost: severe wind risk, 99% chance of damaging wind over 30y; extreme-heat days projected 7→20/yr by 2055 (HVAC capex compounding) — expect insurance premiums to compound above CPI over the hold.
Questions for the listing agent
- Built in 1975 — when were the roof, HVAC, electrical panel, plumbing, and water heater last replaced?
- Is there a deadline driving the sale (1031 exchange, divorce, estate, relocation)? That informs how much negotiation room exists.
- Crime grade is F in this area — have there been break-ins, vandalism, or insurance claims at this property in the last 3 years? What carrier currently insures it and at what premium?
- What's the average days-on-market for RENTAL listings here right now (not sales)? A rising rental-DOM trend means longer vacancies and softer asking-rent achievability than the comps imply.
- What's the recent tenant-quality profile in this submarket — average credit score on applications, eviction rate, late-payment / NSF rate, and stable-employment percentage? A property-management company in the area should have these aggregated.
- How much new for-sale + rental construction is in the pipeline within 1–3 miles? Heavy new supply typically softens prices + rents 12–24 months out; constrained supply supports both.
Investment metrics
- 1% rule
- 0.96% ✗
- Cap rate
- 7.82%
- Cash-on-cash
- 5.46%
- DSCR
- 1.24
- GRM
- 8.7
CMA / ARV
- ARV (on-the-fly)
- $124,320
- Comps found
- 12
Show comp detail 12 sales within ~0.75 mi
| Address | Dist | Beds/Ba | Sqft | Sold | Price | $/sf | Match |
|---|---|---|---|---|---|---|---|
| 5656 Atlanta Ave | 0.03mi | 3/1.5 | 1,038 (+0%) | 10mo | $92,900 | $89 | 90 |
| 5912 Atlanta Ave | 0.20mi | 3/2.0 | 1,064 (+3%) | 6mo | $139,700 | $131 | 79 |
| 7884 Grayson Ave | 0.30mi | 3/1.5 | 1,023 (-1%) | 9mo | $98,500 | $96 | 76 |
| 5621 Lanier Dr | 0.32mi | 3/1.5 | 1,081 (+4%) | 11mo | $160,000 | $148 | 69 |
| 5911 Benson Dr | 0.24mi | 3/1.5 | 1,133 (+9%) | 5mo | $99,900 | $88 | 69 |
| 5837 Denova St | 0.29mi | 3/2.0 | 1,150 (+11%) | 6mo | $139,000 | $121 | 62 |
| 7751 Bringhurst Ave | 0.32mi | 3/1.5 | 1,180 (+14%) | 12mo | $134,900 | $114 | 51 |
| 6734 Autumn Ave | 0.70mi | 3/1.0 | 1,062 (+2%) | 12mo | $127,600 | $120 | 51 |
| 6814 Spring Dr | 0.57mi | 2/1.0 (-1) | 1,008 (-3%) | 19mo | $45,000 | $45 | 46 |
| 6197 Flag St | 0.41mi | 3/1.0 | 1,150 (+11%) | 18mo | $120,000 | $104 | 45 |
| 7173 Poinsettia Dr | 0.57mi | 4/1.0 (+1) | 1,003 (-3%) | 19mo | $130,000 | $130 | 45 |
| 5907 Silverleaf Ave | 0.75mi | 3/1.5 | 1,118 (+8%) | 18mo | $139,900 | $125 | 37 |
Match score weights: distance 35% · size 25% · config 20% · recency 20%. Top-matched comps best support the ARV.
Projected returns pro-forma
5.93% appreciation · 3.0% rent growth · sell at horizon
- IRR
- 19.7%
- Equity multiple
- 2.31×
- Total profit
- $45,675
- Equity at exit
- $78,027
- IRR
- 19.0%
- Equity multiple
- 4.61×
- Total profit
- $126,494
- Equity at exit
- $141,024
Cash invested: $35,000 (down + closing). Projections, not guarantees.
Landlord ↔ Tenant lean methodology
- Overall (STATE)
- 90 Strongly Landlord-Friendly
- State Louisiana
- 90 Strongly Landlord-Friendly · R+12
- County
- — inherits STATE
- City
- — inherits STATE
ZIP-level market 70812
- Home prices YoY
- 3.5%
- Active inventory
- 39
- Price-to-rent
- 8.7×
Monthly cashflow live
- Estimated rent
- $1,197 high interval (Pro) →
- Mortgage (P&I)
- −$656
- Tax from tax record
- −$79 /mo · $946/yr
- Insurance
- −$52
- HOA
- −$0
- Vacancy / Maint / Mgmt
- −$251
- Net cashflow
- $159
Break-even live
UW: 25.0% down · 7.5% · 30yr · 1.5% tax · 5.0% vac · 8.0% maint · 8.0% mgmt
Financing live
Cash to close
- Down payment
- $31,250
- Closing costs
- $3,750
- Reserves months
- —
- Total cash needed
- —
Loan-product check · same deal, 3 products live
Conventional
25% down · 7.5% · 30yr
- Down + closing
- —
- Monthly P&I
- —
- Monthly cashflow
- —
- DSCR
- —
- Eligible?
- —
Personal DTI + credit; lowest rate.
DSCR
20% down · 8.5% · 30yr
- Down + closing
- —
- Monthly P&I
- —
- Monthly cashflow
- —
- DSCR
- —
- Eligible?
- —
No personal income docs; deal must DSCR.
Hard money
10% down · 12.0% · 12mo
- Down + closing
- —
- Monthly P&I
- —
- Monthly cashflow
- —
- DSCR
- —
- Eligible?
- —
Short-term bridge; refi at stabilization.
Rent comps 12 comps
| Address | Beds | Baths | Sqft | Rent | $/sqft | DOM | Units | Dist |
|---|---|---|---|---|---|---|---|---|
| 5255 Astoria Dr Baton Rouge, LA | 3.0 | 2.0 | 1463 | $1,295 | $0.89 | 43d | 1 | 0.43mi |
| 8614 Forestwood Ave Baton Rouge, LA | 3.0 | 2.0 | 1313 | $1,700 | $1.29 | 14d | 1 | 0.89mi |
| 9173 Cedar Ct Baton Rouge, LA | 4.0 | 2.0 | 1405 | $1,596 | $1.14 | 14d | 1 | 1.12mi |
| 9062 Cedar Ct Baton Rouge, LA | 3.0 | 2.0 | 1350 | $1,158 | $0.86 | 23d | 1 | 1.16mi |
| 5665 McClelland Dr Apt 220 Baton Rouge, LA | 3.0 | 1.5 | 870 | $950 | $1.09 | 14d | 1 | 1.36mi |
| 5665 McClelland Dr Apt 201 Baton Rouge, LA | 3.0 | 1.5 | 870 | $1,050 | $1.21 | 43d | 1 | 1.36mi |
| 5665 McClelland Dr Apt 133 Baton Rouge, LA | 2.0 | 1.0 | 775 | $825 | $1.06 | 43d | 1 | 1.36mi |
| 5665 McClelland Dr Unit 245 Baton Rouge, LA | 2.0 | 1.5 | 765 | $800 | $1.05 | 43d | 1 | 1.36mi |
| 5315 McClelland Dr Baton Rouge, LA | 3.0 | 2.0 | 1369 | $1,000 | $0.73 | 23d | 1 | 1.38mi |
| 5665 McClelland Dr Baton Rouge, LA | 2.0 | 1.0 | 775 | $825 | $1.06 | 23d | 1 | 1.39mi |
| 5423 Banyan Trace Dr Baton Rouge, LA | 4.0 | 2.0 | 1469 | $1,300 | $0.88 | 23d | 1 | 1.42mi |
| 5553 Banyan Ct Baton Rouge, LA | 4.0 | 2.0 | 1459 | $1,350 | $0.93 | 23d | 1 | 1.47mi |
Listing history 12 events
-
2026-06-09status $125,000 Pending 17 DOM
-
2026-06-08days on market $125,000 Active 17 DOM
-
2026-06-07days on market $125,000 Active 16 DOM
-
2026-06-05days on market $125,000 Active 13 DOM
-
2026-06-03days on market $125,000 Active 12 DOM
-
2026-06-02days on market $125,000 Active 11 DOM
-
2026-06-01days on market $125,000 Active 10 DOM
-
2026-05-31days on market $125,000 Active 9 DOM
-
2026-05-31days on market $125,000 Active 8 DOM
-
2026-05-22$125,000 Active
Show marketing remark (410 chars)
Charming brick home with a NEW ROOF (MARCH 2026) and NEW WINDOWS throughout! This 3-bedroom, 1.5-bath home offers a comfortable layout and a spacious fenced backyard perfect for relaxing or entertaining. Features include a window unit in the living room with both A/C and heat, a covered carport, and plenty of outdoor space for kids, pets, or gatherings. A great opportunity for homeowners or investors alike!
-
2026-05-22$125,000 Active 410-char remark
Show marketing remark (410 chars)
Charming brick home with a NEW ROOF (MARCH 2026) and NEW WINDOWS throughout! This 3-bedroom, 1.5-bath home offers a comfortable layout and a spacious fenced backyard perfect for relaxing or entertaining. Features include a window unit in the living room with both A/C and heat, a covered carport, and plenty of outdoor space for kids, pets, or gatherings. A great opportunity for homeowners or investors alike!
-
1983-08-12soldstatus
ⓘ Source: listings_history table (triggers on properties + properties_extension) + one-shot
backfill from property_details.listing_events for pre-trigger history.
Tax reassessment forecast LA · Resets to sale price
- Current annual tax
- $946 · $79/mo
- Projected year-2 tax
- $946 · $79/mo
- Expected delta
- $0/yr ($0/mo · 0.0%)
ⓘ Screening estimate from a state-policy table — verify with the county assessor before closing.
Climate risk First Street
- Flood 1/10 Low FEMA zone X (unshaded) · 0% chance over 30 yrs
- Wildfire 1/10 Low
- Heat 8/10 Severe 7 d/yr ≥108°F today · 20 d/yr by 30 yrs out
- Wind 9/10 Extreme 99% chance of damaging wind over 30 yrs
- Air quality 3/10 Moderate 3 unhealthy d/yr today · 4 by 30 yrs out
Nearby sold comps map
Loading sold comps map…
Walkable amenities ~0.75 mi
Loading nearby amenities…
Taxation est. · year 1
- Rental income
- $14,363
- − Mortgage interest
- −$7,002
- − Property taxes
- −$946
- − Insurance
- −$625
- − Repairs & maintenance
- −$1,149
- − Management
- −$1,149
- − Depreciation
- −$3,636
- Taxable loss
- −$145
- Est. tax savings @ 24.0%
- +$35
- After-tax cash flow
- $1,944/yr
For passive investors: Depreciation is non-cash, so a rental often shows a tax loss while cash-flowing — sheltering income. Rental losses are passive: they offset passive income freely, and up to $25,000/yr can offset ordinary (W-2) income if you actively participate and your MAGI is under $100k (phasing out to $0 by $150k); unused losses carry forward. On sale, claimed depreciation is recaptured at up to 25%, and gains may owe capital-gains tax (a 1031 exchange can defer both). Figures are a year-1 estimate at your 24.0% rate — not tax advice; consult a CPA.
Schools (NCES district)
- District
- East Baton Rouge Parish
- NCES district ID
- 2200540
- Math proficiency
- 22% ▼ -36.00%
- Reading proficiency
- 34% ▼ -31.00%
- Median HH income
- $46,263
- Composite
- 24.14/100
- National rank
- #7745
- State rank
- #47 of 98 in LA
Livability — Merrydale
- Score
- 58/100
- State rank
- #301
- US rank
- #21115
Category grades
Schools grade is shown separately in the Schools card above.
Census & demographics
- Census place
- Merrydale, LA
- City population
- 11,124
- Population (ZIP)
- 11,124
Population outlook (East Baton Rouge County) Hauer SSP2
- Today (2025)
- 464,810 people
- By 2030
- 472,137 · +1.6%
- By 2040
- 480,243 · +3.3%
- By 2050
- 484,422 · +4.2%
- By 2075
- 492,069 · +5.9%
- By 2100
- 476,347 · +2.5%
Race, ethnicity, and origin ACS 2023
- Neighborhood character
- Predominantly Black (97%)
- Race & ethnicity
- Black 97% Hispanic / Latino 2% White 1%
- Foreign-born
- 1% · Canada
- Languages at home
- 99% English-only · Spanish 1%
Political lean MEDSL · East Baton Rouge
- 2024 margin
- D (+11.1) · D 54.5% · R 43.4% · Other 2.1%
- 2008→2024 swing
- +8.9pp toward D · 2008: 2.2pp · 2024: 11.1pp
- All cycles
- 2024: D+11.1 2020: D+13.1 2016: D+9.2 2012: D+5.2 2008: D+2.2
Not yet ingested
- Civics
- —
Market trends
- HPI YoY
- ▲ 5.93%
- Current HPI
- 174.6882
- Rent YoY
- —
- Metro
- —
- State GDP YoY
- ▲ 3.29%
- F500 in state
- 10
Industry mix (Fortune 500 HQ in LA)
| Industry | F500 HQs | Revenue |
|---|---|---|
| Telecommunications | 2 | $23B |
|
||
| Utilities | 1 | $12B |
|
||
| Wholesale / Distribution | 1 | $5B |
|
||
| Advertising | 1 | $2B |
|
||
Price history
+0.0% since first listed3 events — show timeline
- 2026-05-22 Listed $125,000 AcadianaMLS
- 2026-05-22 Listed $125,000 GBRMLS
- 1983-08-12 Sold (Public Records) — Public Records
Property tax history
+5.5%/yrLatest (2025): $946 · -0.4% YoY. Source: county tax records.
Cash-flow waterfall
monthlySold comps — $/sqft
last 12 mo · ≤1 miLoading sold comps…