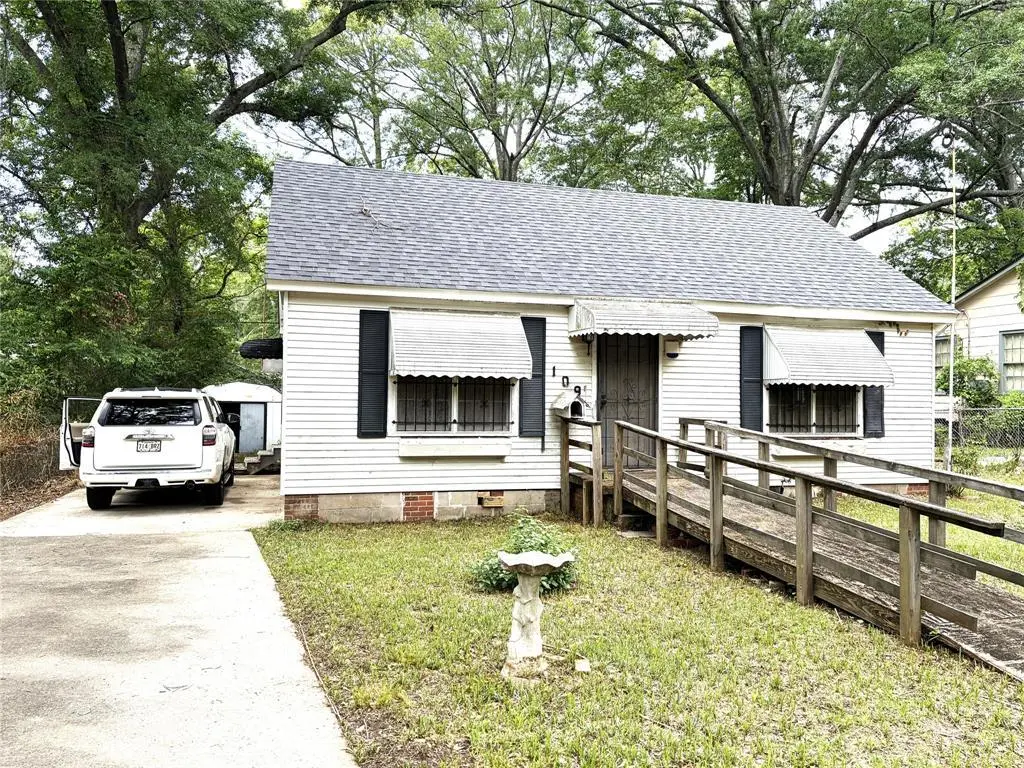
109 Washington St · Minden, LA
Flood risk 1/10 · Minimal
- FEMA flood zone
- X (unshaded)
- Chance of flooding over 30 yrs
- 0.0%
- Est. flood insurance / yr
- $507 – $1,088
Fire risk 3/10 · Minor
- Est. fire insurance / yr
- $1,269 – $2,357
Heat risk 7/10 · Major
- Hot days now (above 111°F)
- 7 days/yr
- Hot days in 30 yrs
- 21 days/yr
Wind risk 6/10 · Moderate
- Chance of severe wind over 30 yrs
- 65.0%
Air-quality risk 1/10 · Minimal
- Unhealthy air days now
- 0 days/yr
- Unhealthy air days in 30 yrs
- 0 days/yr
Risk factors via First Street. Map © Google.
Why this score? — see what drove the B- grade
The composite is a weighted blend of 9 inputs, each scored 0–100. Each bar is that input's sub-score; the figure is the points it added to the 100-point composite (weight × sub-score).
- Cash flow +30.0/30.0
- 1% rule +10.0/10.0
- DSCR +10.0/10.0
- ARV discount +7.5/15.0
- Livability +3.4/5.0
- Rent growth +2.5/5.0
- Condition / age +2.5/5.0
- Schools +1.8/10.0
- Appreciation +0.0/10.0
$54,500
🖨 Deal sheet 📄 Offer letter ✓ Due diligence
Listing remarks
This Cottage type home could be a precious with lots of TLC. The outside has lots of charm with window boxes and newer roof that was replaced with an architectural singles. When you enter the front door you are in the Living Room with faux F. P. that opens to Dining Room. The nice size kitchen is located off Dining Room with lots of cabinets and place for a small breakfast table. There are two bedrooms, large hall bathroom and nice size laundry room. The back yard is partially fenced. For parking there is a nice concrete slab. Roof installed 12-23-2018
Key facts
- Partially fenced
- Newer roof
- Concrete slab
Tags
Property features AI
Finance
- Financial info: Accepts cash and conventional financing; Treat as clear loan type; No second mortgage
- HOA & community: No association
Exterior
- Parking: Driveway; On-street parking
- Utilities: City water; City sewer; Cable available; Individual gas meter; Asphalt (street/paving)
- Home design: Single-family residence; One story; Residential property
- Construction: Built in 1940; Aluminum siding; Vinyl siding; Asphalt roof
- Exterior features: Partial backyard fencing; Backyard fenced (partial)
Interior
- Kitchen: Eat-in kitchen; No appliances reported
- Bedrooms: 2 bedrooms (both on the main level)
- Flooring: Carpet; Vinyl; Wood
- Bathrooms: 1 full bathroom
- Heating & cooling: No heating; No cooling
- Interior features: Cable TV available; Eat-in kitchen; High-speed internet available; Paneling; One living area; One dining area; Total rooms: 3; Living room fireplace
- Laundry & utility: Utility room
Neighborhood map
What this means for you Summary
Snapshot
- This is a 2-bed/1.0-bath single-family listed at $54k.
Deal economics
- At list price, monthly cash flow is $515 ($6k/yr) — positive.
- The deal already cash-flows at list — no discount required.
- Meets the 1% rule at list price ($1k rent vs $54k).
- Recommended offer: $53k (3.0% below list) — sets the bar for market timing.
- Cap rate 17.6% vs local median 5.2% in Minden — top-decile yield for the area; either an underpriced asset or a hidden risk that comps aren't pricing in. Stress-test before assuming the spread holds.
Location & tenants
- Location reads 68/100 on livability (#92 in LA) — a middle-class / working-renter tenant base. Strengths: cost of living A+, health & safety A+, housing A; Watch: schools C-, amenities D, crime F.
- Webster Parish (town): math 17% / reading 26% proficiency, ranked #67 of 98 in LA (top 68%) — low school quality limits family demand, transient renter base, plan for 1-2y turnover; 61% free/reduced lunch — lower-income household profile, screen leases tightly.
- Market conditions: 133 active listings in the ZIP; 36 units permitted in Webster Parish in 2024 (0 in 5+ unit buildings).
Forward outlook
- Local home prices are declining (-3.0%/yr); year-one equity from $377 of loan paydown is wiped out by about $2k of value loss. Plan a longer hold.
- Webster County population projected at -21% by 2050 — secular population decline; favor cash flow + early exit over multi-decade hold.
- At projected returns (-3.0% appreciation + 3.0% rent growth), your $15k cash investment doubles in ~3 years — after that, you're playing with house money.
Negotiation context
- It's been on market 37 days — a 3% lower offer ($53k) is reasonable based on typical stale-listing flexibility.
Risks & watch-outs
- Watch-outs: built in 1940 — expect roof / HVAC / electrical / plumbing capex.
- Climate carrying-cost: major wind risk, 65% chance of damaging wind over 30y; extreme-heat days projected 7→21/yr by 2055 (HVAC capex compounding) — expect insurance premiums to compound above CPI over the hold.
Questions for the listing agent
- It's been on market 37 days. Have you received any prior offers? Is the seller open to a 3% concession, seller financing, or rate buy-down credit?
- Built in 1940 — when were the roof, HVAC, electrical panel, plumbing, and water heater last replaced?
- Is there a deadline driving the sale (1031 exchange, divorce, estate, relocation)? That informs how much negotiation room exists.
- Crime grade is F in this area — have there been break-ins, vandalism, or insurance claims at this property in the last 3 years? What carrier currently insures it and at what premium?
- What's the average days-on-market for RENTAL listings here right now (not sales)? A rising rental-DOM trend means longer vacancies and softer asking-rent achievability than the comps imply.
- What's the recent tenant-quality profile in this submarket — average credit score on applications, eviction rate, late-payment / NSF rate, and stable-employment percentage? A property-management company in the area should have these aggregated.
- How much new for-sale + rental construction is in the pipeline within 1–3 miles? Heavy new supply typically softens prices + rents 12–24 months out; constrained supply supports both.
Investment metrics
- 1% rule
- 1.98% ✓
- Cap rate
- 17.63%
- Cash-on-cash
- 40.50%
- DSCR
- 2.80
- GRM
- 4.2
CMA / ARV
- ARV (median comp)
- $120,277
- List price
- $54,500
- Delta
- -54.69%
- Verdict
- UNDERPRICED
- Comps
- 20 within 1.0 mi
Show comp detail 12 sales within ~0.75 mi
| Address | Dist | Beds/Ba | Sqft | Sold | Price | $/sf | Match |
|---|---|---|---|---|---|---|---|
| 1205 Tillman Dr | 0.12mi | 3/1.0 (+1) | 1,208 (-0%) | 1mo | $115,000 | $95 | 88 |
| 819 Tillman Dr | 0.11mi | 3/1.0 (+1) | 1,245 (+3%) | 8mo | $105,000 | $84 | 78 |
| 242 Pecanview Dr | 0.23mi | 3/1.0 (+1) | 1,173 (-3%) | 2mo | $128,000 | $109 | 76 |
| 1100 Bonnie Ln | 0.22mi | 3/1.0 (+1) | 1,300 (+7%) | 2mo | $150,000 | $115 | 71 |
| 511 Lakeshore Dr | 0.27mi | 3/1.0 (+1) | 1,130 (-7%) | 9mo | $119,900 | $106 | 64 |
| 803 Center St | 0.49mi | 3/1.0 (+1) | 1,135 (-6%) | 11mo | $145,000 | $128 | 52 |
| 311 Summit St | 0.61mi | 2/2.0 | 1,277 (+5%) | 8mo | $165,000 | $129 | 52 |
| 507 W Marshall St | 0.69mi | 3/1.0 (+1) | 1,269 (+5%) | 5mo | $24,900 | $20 | 51 |
| 226 Virginia Ave | 0.38mi | 3/1.0 (+1) | 1,104 (-9%) | 15mo | $39,900 | $36 | 50 |
| 1101 Park Hwy | 0.54mi | 3/2.0 (+1) | 1,330 (+10%) | 6mo | $110,000 | $83 | 45 |
| 440 Pine St | 0.64mi | 3/1.0 (+1) | 1,312 (+8%) | 10mo | $75,000 | $57 | 44 |
| 400 Summit | 0.66mi | 3/2.5 (+1) | 1,365 (+12%) | 4mo | $239,000 | $175 | 34 |
Match score weights: distance 35% · size 25% · config 20% · recency 20%. Top-matched comps best support the ARV.
Projected returns pro-forma
-3.0% appreciation · 3.0% rent growth · sell at horizon
- IRR
- 36.9%
- Equity multiple
- 2.57×
- Total profit
- $23,961
- Equity at exit
- $8,126
- IRR
- 43.5%
- Equity multiple
- 5.13×
- Total profit
- $63,064
- Equity at exit
- $4,712
Cash invested: $15,260 (down + closing). Projections, not guarantees.
Landlord ↔ Tenant lean methodology
- Overall (STATE)
- 90 Strongly Landlord-Friendly
- State Louisiana
- 90 Strongly Landlord-Friendly · R+12
- County
- — inherits STATE
- City
- — inherits STATE
ZIP-level market 71055
- Active inventory
- 133
- Price-to-rent
- 4.2×
Monthly cashflow live
- Estimated rent
- $1,076 medium interval (Pro) →
- Mortgage (P&I)
- −$286
- Tax from tax record
- −$27 /mo · $323/yr
- Insurance
- −$23
- HOA
- −$0
- Vacancy / Maint / Mgmt
- −$226
- Net cashflow
- $515
Break-even live
UW: 25.0% down · 7.5% · 30yr · 1.5% tax · 5.0% vac · 8.0% maint · 8.0% mgmt
Financing live
Cash to close
- Down payment
- $13,625
- Closing costs
- $1,635
- Reserves months
- —
- Total cash needed
- —
Loan-product check · same deal, 3 products live
Conventional
25% down · 7.5% · 30yr
- Down + closing
- —
- Monthly P&I
- —
- Monthly cashflow
- —
- DSCR
- —
- Eligible?
- —
Personal DTI + credit; lowest rate.
DSCR
20% down · 8.5% · 30yr
- Down + closing
- —
- Monthly P&I
- —
- Monthly cashflow
- —
- DSCR
- —
- Eligible?
- —
No personal income docs; deal must DSCR.
Hard money
10% down · 12.0% · 12mo
- Down + closing
- —
- Monthly P&I
- —
- Monthly cashflow
- —
- DSCR
- —
- Eligible?
- —
Short-term bridge; refi at stabilization.
Listing history 15 events
-
2026-06-18days on market $54,500 Active 37 DOM
-
2026-06-17days on market $54,500 Active 36 DOM
-
2026-06-16days on market $54,500 Active 35 DOM
-
2026-06-15days on market $54,500 Active 34 DOM
-
2026-06-14days on market $54,500 Active 32 DOM
-
2026-06-13days on market $54,500 Active 31 DOM
-
2026-06-10days on market $54,500 Active 29 DOM
-
2026-06-09days on market $54,500 Active 28 DOM
-
2026-06-08days on market $54,500 Active 27 DOM
-
2026-06-07days on market $54,500 Active 26 DOM
-
2026-06-02days on market $54,500 Active 21 DOM
-
2026-06-01days on market $54,500 Active 20 DOM
-
2026-05-31days on market $54,500 Active 19 DOM
-
2026-05-30days on market $54,500 Active 18 DOM
-
2026-05-12$54,500 Active 531-char remark
ⓘ Source: listings_history table (triggers on properties + properties_extension) + one-shot
backfill from property_details.listing_events for pre-trigger history.
Tax reassessment forecast LA · Resets to sale price
- Current annual tax
- $323 · $27/mo
- Projected year-2 tax
- $323 · $27/mo
- Expected delta
- $0/yr ($0/mo · 0.0%)
ⓘ Screening estimate from a state-policy table — verify with the county assessor before closing.
Climate risk First Street
- Flood 1/10 Low FEMA zone X (unshaded) · 0% chance over 30 yrs
- Wildfire 3/10 Moderate
- Heat 7/10 Severe 7 d/yr ≥111°F today · 21 d/yr by 30 yrs out
- Wind 6/10 Major 65% chance of damaging wind over 30 yrs
- Air quality 1/10 Low 0 unhealthy d/yr today · 0 by 30 yrs out
Nearby sold comps map
Loading sold comps map…
Walkable amenities ~0.75 mi
Loading nearby amenities…
Taxation est. · year 1
- Rental income
- $12,918
- − Mortgage interest
- −$3,053
- − Property taxes
- −$323
- − Insurance
- −$272
- − Repairs & maintenance
- −$1,033
- − Management
- −$1,033
- − Depreciation
- −$1,585
- Taxable income
- $5,617
- Est. tax owed @ 24.0%
- −$1,348
- After-tax cash flow
- $4,832/yr
For passive investors: Depreciation is non-cash, so a rental often shows a tax loss while cash-flowing — sheltering income. Rental losses are passive: they offset passive income freely, and up to $25,000/yr can offset ordinary (W-2) income if you actively participate and your MAGI is under $100k (phasing out to $0 by $150k); unused losses carry forward. On sale, claimed depreciation is recaptured at up to 25%, and gains may owe capital-gains tax (a 1031 exchange can defer both). Figures are a year-1 estimate at your 24.0% rate — not tax advice; consult a CPA.
Schools (NCES district)
- District
- Webster Parish
- NCES district ID
- 2201890
- Math proficiency
- 17% ▼ -39.00%
- Reading proficiency
- 26% ▼ -38.00%
- Median HH income
- $33,011
- Composite
- 17.5/100
- National rank
- #9055
- State rank
- #67 of 98 in LA
Livability — Minden
- Score
- 68/100
- State rank
- #92
- US rank
- #9771
Category grades
Schools grade is shown separately in the Schools card above.
Census & demographics
- Census place
- Minden, LA
- Population (ZIP)
- 17,406
Population outlook (Webster County) Hauer SSP2
- Today (2025)
- 37,736 people
- By 2030
- 36,203 · -4.1%
- By 2040
- 32,988 · -12.6%
- By 2050
- 29,743 · -21.2%
- By 2075
- 22,346 · -40.8%
- By 2100
- 15,045 · -60.1%
Race, ethnicity, and origin ACS 2023
- Neighborhood character
- Majority White (56%)
- Race & ethnicity
- White 56% Black 40% Two or more races 3% Hispanic / Latino 2%
- Common ancestry
- Slovak 1% Serbian 1% Lithuanian 1%
- Foreign-born
- 2% · Canada
- Languages at home
- 97% English-only · Spanish 1%
Political lean MEDSL · Webster
- 2024 margin
- Solid R (+36.5) · D 31.2% · R 67.7% · Other 1.1%
- 2008→2024 swing
- -10.2pp toward R · 2008: -26.3pp · 2024: -36.5pp
- All cycles
- 2024: R+36.5 2020: R+31.1 2016: R+29.1 2012: R+25.0 2008: R+26.3
Not yet ingested
- Civics
- —
Market trends
- HPI YoY
- ▼ -89.40%
- Current HPI
- 117.9577
- Rent YoY
- —
- Metro
- —
- State GDP YoY
- ▲ 3.29%
- F500 in state
- 10
Industry mix (Fortune 500 HQ in LA)
| Industry | F500 HQs | Revenue |
|---|---|---|
| Telecommunications | 2 | $23B |
|
||
| Utilities | 1 | $12B |
|
||
| Wholesale / Distribution | 1 | $5B |
|
||
| Advertising | 1 | $2B |
|
||
Price history
1 event — show timeline
- 2026-05-12 Listed $54,500 NTREIS
Property tax history
+3.2%/yrLatest (2025): $323 · +1.4% YoY. Source: county tax records.
Cash-flow waterfall
monthlySold comps — $/sqft
last 12 mo · ≤1 miLoading sold comps…