None · Jennings, MO
Flood risk 1/10 · Minimal
- FEMA flood zone
- X (unshaded)
- Chance of flooding over 30 yrs
- 0.0%
- Est. flood insurance / yr
- $473 – $860
Fire risk 1/10 · Minimal
- Est. fire insurance / yr
- $1,054 – $1,958
Heat risk 5/10 · Moderate
- Hot days now (above 107°F)
- 7 days/yr
- Hot days in 30 yrs
- 20 days/yr
Wind risk 2/10 · Minimal
- Chance of severe wind over 30 yrs
- 1.0%
Air-quality risk 4/10 · Minor
- Unhealthy air days now
- 4 days/yr
- Unhealthy air days in 30 yrs
- 5 days/yr
Risk factors via First Street. Map © Google.
Why this score? — see what drove the A- grade
The composite is a weighted blend of 9 inputs, each scored 0–100. Each bar is that input's sub-score; the figure is the points it added to the 100-point composite (weight × sub-score).
- Cash flow +30.0/30.0
- ARV discount +15.0/15.0
- 1% rule +10.0/10.0
- DSCR +10.0/10.0
- Appreciation +6.9/10.0
- Rent growth +3.7/5.0
- Livability +3.4/5.0
- Condition / age +2.5/5.0
- Schools +1.1/10.0
$43,450
🖨 Deal sheet 📄 Offer letter ✓ Due diligence
Listing remarks MLS
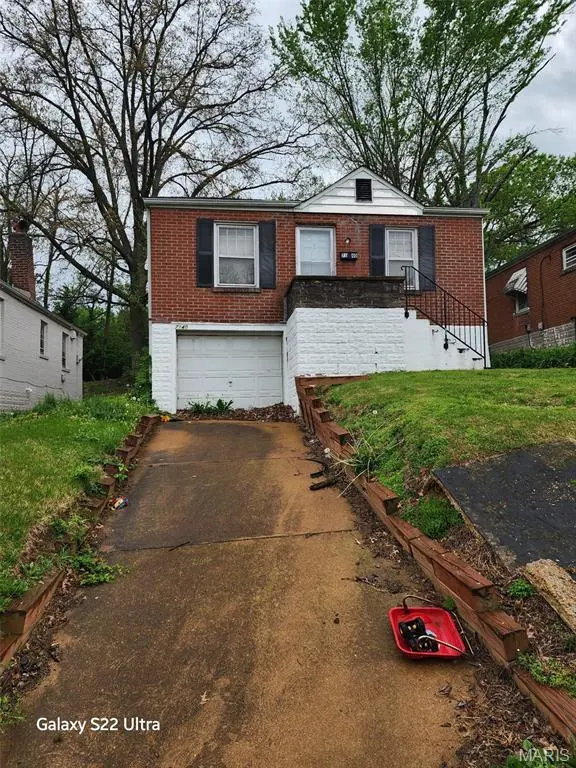
This home has tons of potential and is perfect for the investor or handy person looking for a little sweat equity. Owner-occupant buyers could possibly utilize 203k financing to make this one their own. Ready for its new owner! Living room and Dining room w/ 2-bedroom, 1-bath. All-brick Bungalow home offers over 1,100 square feet, with a full Bonus room off the kitchen that provides direct access to a large backyard. A 1-car attached garage tucked into the basement keeps the car protected and provides quick access to the basement area. Property to be sold AS-IS, seller to perform no repairs or provide any municipal inspections. No inspection contingency. Buyers are to exercise due diligence before submitting any offers. Please submit offers on Special Sale Contract Only. Close to highways and all of the downtown St. Louis attractions.
Key facts
- 6,359 sq ft lot
- Garage
- Built 1941
Neighborhood map
What this means for you Summary
Snapshot
- This is a 2-bed/1.0-bath single-family listed at $43k.
Deal economics
- At list price, monthly cash flow is $575 ($7k/yr) — positive.
- The deal already cash-flows at list — no discount required.
- Meets the 1% rule at list price ($1k rent vs $43k).
- Recommended offer: $42k (3.0% below list) — sets the bar for market timing.
- Cap rate 22.2% vs local median 12.2% in Jennings — top-decile yield for the area; either an underpriced asset or a hidden risk that comps aren't pricing in. Stress-test before assuming the spread holds.
Location & tenants
- Location reads 67/100 on livability (#208 in MO) — a middle-class / working-renter tenant base. Strengths: cost of living A+, commute A-, housing A-; Watch: schools D-, crime F, amenities F.
- Jennings (suburban): math 8% / reading 20% proficiency, ranked #315 of 324 in MO (top 97%) — low school quality limits family demand, transient renter base, plan for 1-2y turnover; 86% free/reduced lunch — lower-income household profile, screen leases tightly.
- Market conditions: Rents rising fast (+5.0%/yr); 372 active listings in the ZIP; 40 comparable units currently listed for rent nearby; rentals at typical pace (median 24d on market — plan ~3-4 weeks tenant-placement turnaround); lower-income renter base — watch delinquency; 920 units permitted in St. Louis County in 2024 (250 in 5+ unit buildings).
- This rent runs 33% of the median local income ($41k/yr) — at the standard rent-burdened threshold; future hikes will face affordability resistance.
Forward outlook
- In year one you build about $2k of equity ($300 loan paydown + $2k appreciation (3.8% local appreciation)).
- At projected returns (3.8% appreciation + 5.0% rent growth), your $12k cash investment doubles in ~2 years — after that, you're playing with house money.
Negotiation context
- It's been on market 45 days — a 3% lower offer ($42k) is reasonable based on typical stale-listing flexibility.
Risks & watch-outs
- Watch-outs: built in 1941 — expect roof / HVAC / electrical / plumbing capex.
- Climate carrying-cost: extreme-heat days projected 7→20/yr by 2055 (HVAC capex compounding) — expect insurance premiums to compound above CPI over the hold.
Questions for the listing agent
- It's been on market 45 days. Have you received any prior offers? Is the seller open to a 3% concession, seller financing, or rate buy-down credit?
- Built in 1941 — when were the roof, HVAC, electrical panel, plumbing, and water heater last replaced?
- Is there a deadline driving the sale (1031 exchange, divorce, estate, relocation)? That informs how much negotiation room exists.
- Schools are D-rated, which usually means shorter tenancies and higher turnover. Who's the typical renter profile here, and what's been the actual vacancy rate?
- Crime grade is F in this area — have there been break-ins, vandalism, or insurance claims at this property in the last 3 years? What carrier currently insures it and at what premium?
- What's the average days-on-market for RENTAL listings here right now (not sales)? A rising rental-DOM trend means longer vacancies and softer asking-rent achievability than the comps imply.
- What's the recent tenant-quality profile in this submarket — average credit score on applications, eviction rate, late-payment / NSF rate, and stable-employment percentage? A property-management company in the area should have these aggregated.
- How much new for-sale + rental construction is in the pipeline within 1–3 miles? Heavy new supply typically softens prices + rents 12–24 months out; constrained supply supports both.
Investment metrics
- 1% rule
- 2.62% ✓
- Cap rate
- 22.18%
- Cash-on-cash
- 56.73%
- DSCR
- 3.52
- GRM
- 3.2
CMA / ARV
- ARV (median comp)
- $64,658
- List price
- $43,450
- Delta
- -32.80%
- Verdict
- UNDERPRICED
- Comps
- 20 within 1.0 mi
Show comp detail 12 sales within ~0.75 mi
| Address | Dist | Beds/Ba | Sqft | Sold | Price | $/sf | Match |
|---|---|---|---|---|---|---|---|
| 7126 Theodore Ave | 0.16mi | 3/1.0 (+1) | 1,123 (-2%) | 2mo | $34,900 | $31 | 84 |
| 7138 Garesche Ave | 0.01mi | 3/1.0 (+1) | 1,220 (+7%) | 6mo | $99,750 | $82 | 78 |
| 7056 Idlewild Ave | 0.08mi | 3/1.0 (+1) | 1,234 (+8%) | 4mo | $59,900 | $49 | 74 |
| 7133 Beulah Ave | 0.19mi | 3/1.0 (+1) | 1,039 (-9%) | 1mo | $70,000 | $67 | 71 |
| 7029 Lena Ave | 0.40mi | 2/1.0 | 1,080 (-5%) | 7mo | $55,400 | $51 | 67 |
| 5637 Jennings Station Rd | 0.51mi | 3/1.0 (+1) | 1,116 (-2%) | 2mo | $30,000 | $27 | 66 |
| 5468 Janet Ave | 0.36mi | 3/2.0 (+1) | 1,188 (+4%) | 5mo | $79,000 | $66 | 62 |
| 7220 Eunice Ave | 0.51mi | 2/1.0 | 1,035 (-9%) | 5mo | $55,900 | $54 | 56 |
| 5454 Hodiamont Ave | 0.46mi | 2/1.5 | 969 (-15%) | 6mo | $40,000 | $41 | 47 |
| 5614 Albia Ter | 0.57mi | 3/2.0 (+1) | 988 (-13%) | 0mo | $125,000 | $127 | 42 |
| 6706 Daiber St | 0.69mi | 3/2.0 (+1) | 1,056 (-7%) | 6mo | $95,000 | $90 | 41 |
| 6331 Saloma Ave | 0.69mi | 3/1.5 (+1) | 1,008 (-12%) | 1mo | $80,000 | $79 | 40 |
Match score weights: distance 35% · size 25% · config 20% · recency 20%. Top-matched comps best support the ARV.
Projected returns pro-forma
3.79% appreciation · 4.97% rent growth · sell at horizon
- IRR
- 64.5%
- Equity multiple
- 4.78×
- Total profit
- $46,042
- Equity at exit
- $21,499
- IRR
- 64.1%
- Equity multiple
- 10.38×
- Total profit
- $114,057
- Equity at exit
- $34,745
Cash invested: $12,166 (down + closing). Projections, not guarantees.
Landlord ↔ Tenant lean methodology
- Overall (STATE)
- 81 Strongly Landlord-Friendly
- State Missouri
- 81 Strongly Landlord-Friendly · R+10
- County
- — inherits STATE
- City
- — inherits STATE
ZIP-level market 63136
- Home prices YoY
- 0.9%
- Rents YoY
- 5.0%
- Active inventory
- 372
- Price-to-rent
- 3.2×
Monthly cashflow live
- Estimated rent
- $1,139 high interval (Pro) →
- Mortgage (P&I)
- −$228
- Tax from tax record
- −$78 /mo · $942/yr
- Insurance
- −$18
- HOA
- −$0
- Vacancy / Maint / Mgmt
- −$239
- Net cashflow
- $575
Break-even live
UW: 25.0% down · 7.5% · 30yr · 1.5% tax · 5.0% vac · 8.0% maint · 8.0% mgmt
Financing live
Cash to close
- Down payment
- $10,862
- Closing costs
- $1,304
- Reserves months
- —
- Total cash needed
- —
Loan-product check · same deal, 3 products live
Conventional
25% down · 7.5% · 30yr
- Down + closing
- —
- Monthly P&I
- —
- Monthly cashflow
- —
- DSCR
- —
- Eligible?
- —
Personal DTI + credit; lowest rate.
DSCR
20% down · 8.5% · 30yr
- Down + closing
- —
- Monthly P&I
- —
- Monthly cashflow
- —
- DSCR
- —
- Eligible?
- —
No personal income docs; deal must DSCR.
Hard money
10% down · 12.0% · 12mo
- Down + closing
- —
- Monthly P&I
- —
- Monthly cashflow
- —
- DSCR
- —
- Eligible?
- —
Short-term bridge; refi at stabilization.
Rent comps 40 comps
| Address | Beds | Baths | Sqft | Rent | $/sqft | DOM | Units | Dist |
|---|---|---|---|---|---|---|---|---|
| 7131 Garesche Ave Saint Louis, MO | 2.0 | 1.0 | 918 | $1,090 | $1.19 | 4d | 1 | 0.05mi |
| 7121 Garesche Ave Saint Louis, MO | 3.0 | 1.0 | 1156 | $1,200 | $1.04 | 43d | 1 | 0.09mi |
| 7036 Garesche Ave Saint Louis, MO | 2.0 | 1.0 | 864 | $950 | $1.10 | 17d | 1 | 0.13mi |
| 5225 Fletcher St Saint Louis, MO | 3.0 | 2.0 | 918 | $1,295 | $1.41 | 23d | 1 | 0.21mi |
| 7160 Beulah Ave Saint Louis, MO | 2.0 | 1.0 | 784 | $1,059 | $1.35 | 43d | 1 | 0.22mi |
| 7030 Emma Ave Saint Louis, MO | 2.0 | 1.0 | 801 | $1,350 | $1.69 | 43d | 1 | 0.25mi |
| 5516 Fairridge Ct Saint Louis, MO | 2.0 | 1.0 | 1110 | $995 | $0.90 | 23d | 1 | 0.32mi |
| 7218 Albright Ave Saint Louis, MO | 2.0 | 1.0 | 1100 | $980 | $0.89 | 23d | 1 | 0.40mi |
| 7304 Albright Ave Saint Louis, MO | 2.0 | 1.0 | 800 | $1,100 | $1.38 | 43d | 1 | 0.43mi |
| 5439 Hodiamont Ave Saint Louis, MO | 2.0 | 1.0 | 770 | $950 | $1.23 | 17d | 1 | 0.44mi |
| 7315 Albright Ave Saint Louis, MO | 3.0 | 1.0 | 888 | $1,150 | $1.30 | 43d | 1 | 0.46mi |
| 7120 Greenhaven Dr Saint Louis, MO | 3.0 | 2.0 | 1131 | $1,050 | $0.93 | 23d | 1 | 0.48mi |
| 5415 Hamilton Ave Unit Labs Jennings, MO | 2.0 | 1.0 | 864 | $1,100 | $1.27 | 23d | 1 | 0.49mi |
| 5637 Jennings Station Rd Saint Louis, MO | 3.0 | 1.0 | 1116 | $895 | $0.80 | 43d | 1 | 0.52mi |
| 5615 Beldon Dr Saint Louis, MO | 2.0 | 1.0 | 850 | $950 | $1.12 | 43d | 1 | 0.52mi |
| 7431 Esterbrook Dr Saint Louis, MO | 2.0 | 1.0 | 792 | $1,350 | $1.70 | 43d | 1 | 0.53mi |
| 5361 Wilborn Dr Saint Louis, MO | 3.0 | 1.0 | 900 | $1,420 | $1.58 | 17d | 1 | 0.54mi |
| 5612 Hodiamont Ave Saint Louis, MO | 3.0 | 1.5 | 1200 | $1,150 | $0.96 | 10d | 1 | 0.60mi |
| 5640 Sapphire Ave Saint Louis, MO | 2.0 | 1.0 | 900 | $1,100 | $1.22 | 43d | 1 | 0.60mi |
| 5515 Wilborn Dr Saint Louis, MO | 3.0 | 1.0 | 1248 | $1,400 | $1.12 | 43d | 1 | 0.61mi |
| 7142 Lamont Dr Saint Louis, MO | 2.0 | 1.0 | 750 | $1,100 | $1.47 | 17d | 1 | 0.62mi |
| 7414 Pleaseway Dr Saint Louis, MO | 2.0 | 1.0 | 768 | $1,100 | $1.43 | 43d | 1 | 0.67mi |
| 7420 Pleaseway Dr Saint Louis, MO | 2.0 | 1.0 | 952 | $1,250 | $1.31 | 22d | 1 | 0.68mi |
| 7205 Calvin Ave Saint Louis, MO | 3.0 | 1.0 | 832 | $750 | $0.90 | 43d | 1 | 0.71mi |
| 5613 Statler Ave Saint Louis, MO | 2.0 | 1.0 | 864 | $1,300 | $1.50 | 4d | 1 | 0.73mi |
| 5636 Statler Ave Saint Louis, MO | 1.0 | 1.0 | 777 | $1,200 | $1.54 | 23d | 1 | 0.75mi |
| 5662 Wilborn Dr Saint Louis, MO | 1.0 | 1.0 | 768 | $850 | $1.11 | 23d | 1 | 0.77mi |
| 6150 Sherry Ave Saint Louis, MO | 2.0 | 1.0 | 1032 | $896 | $0.87 | 23d | 1 | 0.78mi |
| 6153 Laura Ave Saint Louis, MO | 2.0 | 1.0 | 834 | $1,000 | $1.20 | 23d | 1 | 0.79mi |
| 5654 Acme Ave Saint Louis, MO | 2.0 | 1.0 | 968 | $325 | $0.34 | 22d | 1 | 0.80mi |
| 7426 Calvin Ave Saint Louis, MO | 2.0 | 1.0 | 1100 | $1,125 | $1.02 | 17d | 1 | 0.80mi |
| 5546 Floy Ave Saint Louis, MO | 2.0 | 2.0 | 850 | $1,273 | $1.50 | 20d | 1 | 0.84mi |
| 7441 Calvin Ave Saint Louis, MO | 3.0 | 1.0 | 1068 | $1,350 | $1.26 | 12d | 1 | 0.84mi |
| 8344 Eton Pl Saint Louis, MO | 2.0 | 1.0 | 750 | $895 | $1.19 | 4d | 1 | 0.87mi |
| 8347 Eton Pl Saint Louis, MO | 2.0 | 1.0 | 750 | $1,075 | $1.43 | 43d | 1 | 0.87mi |
| 5721 Floy Ave Saint Louis, MO | 2.0 | 1.0 | 1032 | $1,120 | $1.09 | 23d | 1 | 0.88mi |
| 5741 Floy Ave Saint Louis, MO | 2.0 | 1.0 | 1000 | $1,100 | $1.10 | 23d | 1 | 0.90mi |
| 5574 Era Ave Saint Louis, MO | 3.0 | 1.0 | 850 | $1,400 | $1.65 | 12d | 1 | 0.90mi |
| 5756 Floy Ave Saint Louis, MO | 2.0 | 1.0 | 1080 | $995 | $0.92 | 43d | 1 | 0.94mi |
| 7516 Chandler Ave Saint Louis, MO | 1.0 | 1.0 | 728 | $1,000 | $1.37 | 43d | 1 | 0.94mi |
Listing history 10 events
-
2026-06-15status $43,450 Pending 45 DOM
-
2026-06-13statusdays on market $43,450 Active 45 DOM
-
2026-06-07statusdays on market $43,450 Pending 44 DOM
-
2026-06-03days on market $43,450 Active 42 DOM
-
2026-06-02days on market $43,450 Active 41 DOM
-
2026-06-01days on market $43,450 Active 40 DOM
-
2026-05-31days on market $43,450 Active 39 DOM
-
2026-04-23$53,450 Active 853-char remark
Show marketing remark (853 chars)
This home has tons of potential and is perfect for the investor or handy person looking for a little sweat equity. Owner-occupant buyers could possibly utilize 203k financing to make this one their own. Ready for its new owner! Living room and Dining room w/ 2-bedroom, 1-bath. All-brick Bungalow home offers over 1,100 square feet, with a full Bonus room off the kitchen that provides direct access to a large backyard. A 1-car attached garage tucked into the basement keeps the car protected and provides quick access to the basement area. Property to be sold AS-IS, seller to perform no repairs or provide any municipal inspections. No inspection contingency. Buyers are to exercise due diligence before submitting any offers. Please submit offers on Special Sale Contract Only. Close to highways and all of the downtown St. Louis attractions.
-
2026-04-21historical $53,450 853-char remark
Show marketing remark (853 chars)
This home has tons of potential and is perfect for the investor or handy person looking for a little sweat equity. Owner-occupant buyers could possibly utilize 203k financing to make this one their own. Ready for its new owner! Living room and Dining room w/ 2-bedroom, 1-bath. All-brick Bungalow home offers over 1,100 square feet, with a full Bonus room off the kitchen that provides direct access to a large backyard. A 1-car attached garage tucked into the basement keeps the car protected and provides quick access to the basement area. Property to be sold AS-IS, seller to perform no repairs or provide any municipal inspections. No inspection contingency. Buyers are to exercise due diligence before submitting any offers. Please submit offers on Special Sale Contract Only. Close to highways and all of the downtown St. Louis attractions.
-
1983-05-01soldstatus
ⓘ Source: listings_history table (triggers on properties + properties_extension) + one-shot
backfill from property_details.listing_events for pre-trigger history.
Tax reassessment forecast MO · Resets to sale price
- Current annual tax
- $942 · $78/mo
- Projected year-2 tax
- $942 · $78/mo
- Expected delta
- $0/yr ($0/mo · 0.0%)
ⓘ Screening estimate from a state-policy table — verify with the county assessor before closing.
Climate risk First Street
- Flood 1/10 Low FEMA zone X (unshaded) · 0% chance over 30 yrs
- Wildfire 1/10 Low
- Heat 5/10 Major 7 d/yr ≥107°F today · 20 d/yr by 30 yrs out
- Wind 2/10 Low 100% chance of damaging wind over 30 yrs
- Air quality 4/10 Moderate 4 unhealthy d/yr today · 5 by 30 yrs out
Nearby sold comps map
Loading sold comps map…
Walkable amenities ~0.75 mi
Loading nearby amenities…
Taxation est. · year 1
- Rental income
- $13,665
- − Mortgage interest
- −$2,434
- − Property taxes
- −$942
- − Insurance
- −$217
- − Repairs & maintenance
- −$1,093
- − Management
- −$1,093
- − Depreciation
- −$1,264
- Taxable income
- $6,621
- Est. tax owed @ 24.0%
- −$1,589
- After-tax cash flow
- $5,312/yr
For passive investors: Depreciation is non-cash, so a rental often shows a tax loss while cash-flowing — sheltering income. Rental losses are passive: they offset passive income freely, and up to $25,000/yr can offset ordinary (W-2) income if you actively participate and your MAGI is under $100k (phasing out to $0 by $150k); unused losses carry forward. On sale, claimed depreciation is recaptured at up to 25%, and gains may owe capital-gains tax (a 1031 exchange can defer both). Figures are a year-1 estimate at your 24.0% rate — not tax advice; consult a CPA.
Schools (NCES district)
- District
- Jennings
- NCES district ID
- 2916290
- Math proficiency
- 8% ▼ -16.00%
- Reading proficiency
- 20% ▼ -4.00%
- Median HH income
- $30,595
- Composite
- 11.04/100
- National rank
- #9739
- State rank
- #315 of 324 in MO
Livability — Jennings
- Score
- 67/100
- State rank
- #208
- US rank
- #10499
Category grades
Schools grade is shown separately in the Schools card above.
Census & demographics
- Census place
- Jennings, MO
- County
- Saint Louis County · 888,823 people
- Metro
- St. Louis, MO-IL
- Population (ZIP)
- 40,929
- Household income
- $41,154
- Rent vs Own
- Severe rent burden
- 3085.0
Population outlook (St. Louis County) Hauer SSP2
- Today (2025)
- 1,025,227 people
- By 2030
- 1,028,023 · +0.3%
- By 2040
- 1,020,940 · -0.4%
- By 2050
- 1,007,280 · -1.8%
- By 2075
- 987,277 · -3.7%
- By 2100
- 921,984 · -10.1%
Race, ethnicity, and origin ACS 2023
- Neighborhood character
- Predominantly Black (90%)
- Race & ethnicity
- Black 90% White 5% Two or more races 3%
- Foreign-born
- 1% · Canada
Political lean MEDSL · St. Louis
- 2024 margin
- Strong D (+23.4) · D 60.8% · R 37.4% · Other 1.7%
- 2008→2024 swing
- +3.5pp toward D · 2008: 19.9pp · 2024: 23.4pp
- All cycles
- 2024: D+23.4 2020: D+24.0 2016: D+16.2 2012: D+13.7 2008: D+19.9
Not yet ingested
- Civics
- —
Market trends
- HPI YoY
- ▲ 3.79%
- Current HPI
- 420.28
- Rent YoY
- ▲ 4.97%
- Metro
- St. Louis, MO-IL
- State GDP YoY
- ▲ 1.84%
- F500 in state
- 20
Industry mix (Fortune 500 HQ in MO)
| Industry | F500 HQs | Revenue |
|---|---|---|
| Healthcare | 1 | $163B |
|
||
| Insurance | 1 | $21B |
|
||
| Industrial Technology | 1 | $17B |
|
||
| Retail | 1 | $16B |
|
||
| Industrial Distribution | 1 | $10B |
|
||
| Utilities | 1 | $9B |
|
||
Price history
+0.0% since first listed3 events — show timeline
- 2026-04-23 Listed $53,450 MARIS as Distributed by MLS Grid
- 2026-04-21 Coming Soon $53,450 MARIS as Distributed by MLS Grid
- 1983-05-01 Sold (Public Records) — Public Records
Property tax history
-0.7%/yrLatest (2022): $942 · +1.5% YoY. Source: county tax records.
Cash-flow waterfall
monthlySold comps — $/sqft
last 12 mo · ≤1 miLoading sold comps…