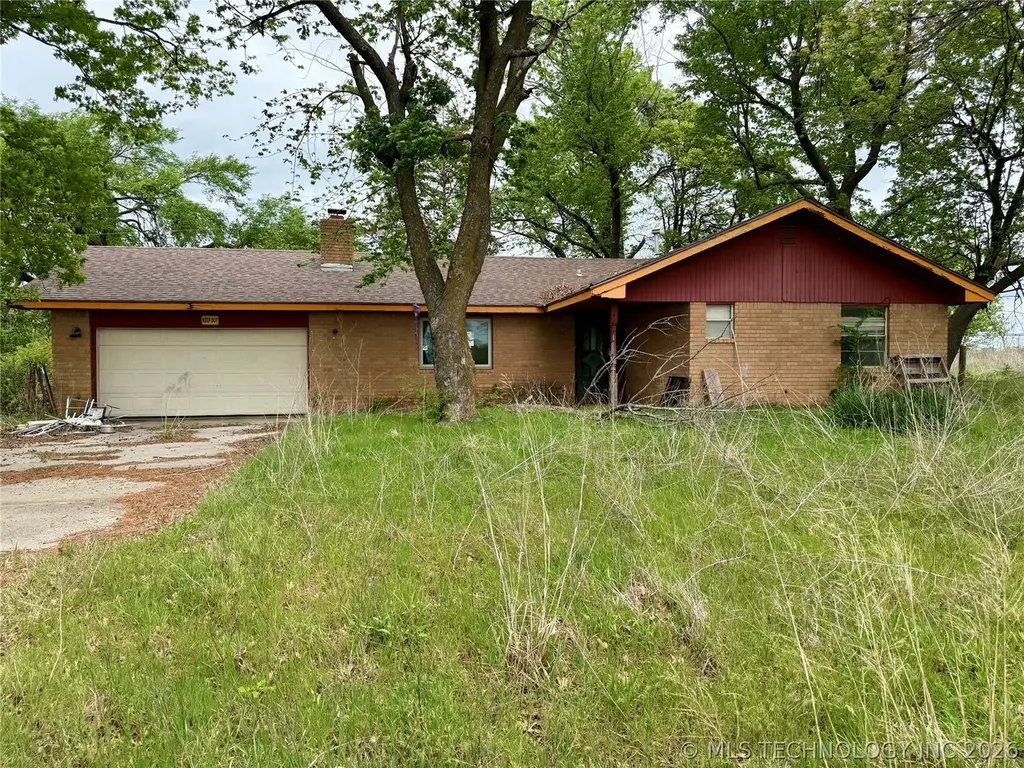
1214 Vinson · Allen, OK
Flood risk 1/10 · Minimal
- FEMA flood zone
- X (unshaded)
- Chance of flooding over 30 yrs
- 0.0%
- Est. flood insurance / yr
- $507 – $1,088
Fire risk 6/10 · Moderate
- Est. fire insurance / yr
- $2,463 – $4,575
Heat risk 6/10 · Moderate
- Hot days now (above 110°F)
- 7 days/yr
- Hot days in 30 yrs
- 19 days/yr
Wind risk 4/10 · Minor
- Chance of severe wind over 30 yrs
- 11.0%
Air-quality risk 2/10 · Minimal
- Unhealthy air days now
- 0 days/yr
- Unhealthy air days in 30 yrs
- 1 days/yr
Risk factors via First Street. Map © Google.
Why this score? — see what drove the B grade
The composite is a weighted blend of 9 inputs, each scored 0–100. Each bar is that input's sub-score; the figure is the points it added to the 100-point composite (weight × sub-score).
- Cash flow +30.0/30.0
- 1% rule +10.0/10.0
- DSCR +10.0/10.0
- ARV discount +7.5/15.0
- Appreciation +7.3/10.0
- Livability +3.0/5.0
- Rent growth +2.5/5.0
- Condition / age +2.5/5.0
- Schools +1.4/10.0
$60,000
🖨 Deal sheet 📄 Offer letter ✓ Due diligence
Listing remarks
Opportunity is knocking — and it’s loud. If you’ve been searching for a true fixer-upper with space to spread out, this 1.4 acre property at the end of a dead-end road might be exactly what you’ve been waiting for. Tucked away for privacy, this property offers the kind of setting that’s getting harder to find. The home itself will require significant renovation, but for the right buyer, the potential here is undeniable. Whether you’re looking to flip, invest, or create your own place from the ground up, this is your chance to bring new life to a property with a solid footprint and a great piece of land. 1.4 acres, End of dead-end road (low traffic, more p
Key facts
- 1.4 acre lot
- 2 garage spots
- Built 1977
Neighborhood map
What this means for you Summary
Snapshot
- This is a 3-bed/2.0-bath single-family listed at $60k.
Deal economics
- At list price, monthly cash flow is $511 ($6k/yr) — positive.
- The deal already cash-flows at list — no discount required.
- Meets the 1% rule at list price ($1k rent vs $60k).
Location & tenants
- Location reads 60/100 on livability (#339 in OK) — a middle-class / working-renter tenant base. Strengths: cost of living A+, housing A; Watch: schools F, amenities F, commute F.
- Allen (rural): math 17% / reading 15% proficiency, ranked #208 of 270 in OK (top 77%) — low school quality limits family demand, transient renter base, plan for 1-2y turnover; 65% free/reduced lunch — lower-income household profile, screen leases tightly.
- Market conditions: 25 active listings in the ZIP; 7 units permitted in Hughes County in 2024 (0 in 5+ unit buildings).
Forward outlook
- In year one you build about $3k of equity ($415 loan paydown + $3k appreciation (4.5% local appreciation)).
- At projected returns (4.5% appreciation + 3.0% rent growth), your $17k cash investment doubles in ~2 years — after that, you're playing with house money.
- By year 10, paydown + projected appreciation supports a ~$31k cash-out refi (75% LTV) — recoverable capital for the next deal without selling this one.
Negotiation context
- Only 9 days on market — expect competitive offers; lowballing is unlikely to land.
- Current owner paid $50k; 20% above their basis — modest negotiation headroom, anchor on the comps not their cost.
Risks & watch-outs
- Climate carrying-cost: major wildfire risk; extreme-heat days projected 7→19/yr by 2055 (HVAC capex compounding) — expect insurance premiums to compound above CPI over the hold.
Questions for the listing agent
- Built in 1977 — when were the roof, HVAC, electrical panel, plumbing, and water heater last replaced?
- Is there a deadline driving the sale (1031 exchange, divorce, estate, relocation)? That informs how much negotiation room exists.
- Schools are F-rated, which usually means shorter tenancies and higher turnover. Who's the typical renter profile here, and what's been the actual vacancy rate?
- What's the average days-on-market for RENTAL listings here right now (not sales)? A rising rental-DOM trend means longer vacancies and softer asking-rent achievability than the comps imply.
- What's the recent tenant-quality profile in this submarket — average credit score on applications, eviction rate, late-payment / NSF rate, and stable-employment percentage? A property-management company in the area should have these aggregated.
- How much new for-sale + rental construction is in the pipeline within 1–3 miles? Heavy new supply typically softens prices + rents 12–24 months out; constrained supply supports both.
Investment metrics
- 1% rule
- 1.98% ✓
- Cap rate
- 16.52%
- Cash-on-cash
- 36.53%
- DSCR
- 2.63
- GRM
- 4.2
CMA / ARV
- ARV (on-the-fly)
- $139,784
- Comps found
- 4
Show comp detail 4 sales within ~0.75 mi
| Address | Dist | Beds/Ba | Sqft | Sold | Price | $/sf | Match |
|---|---|---|---|---|---|---|---|
| 1214 Vinson | 0.01mi | 3/2.0 | 1,384 (0%) | 24mo | $50,000 | $36 | 79 |
| 302 S County Line | 0.21mi | 3/2.0 | 1,484 (+7%) | 4mo | $150,000 | $101 | 74 |
| 604 E Broadway | 0.52mi | 3/2.0 | 1,540 (+11%) | 1mo | $175,000 | $114 | 56 |
| 607 E Broadway | 0.49mi | 3/2.0 | 1,238 (-10%) | 10mo | $50,000 | $40 | 51 |
Match score weights: distance 35% · size 25% · config 20% · recency 20%. Top-matched comps best support the ARV.
Projected returns pro-forma
4.55% appreciation · 3.0% rent growth · sell at horizon
- IRR
- 44.5%
- Equity multiple
- 3.67×
- Total profit
- $44,914
- Equity at exit
- $32,388
- IRR
- 42.8%
- Equity multiple
- 7.45×
- Total profit
- $108,424
- Equity at exit
- $54,606
Cash invested: $16,800 (down + closing). Projections, not guarantees.
Landlord ↔ Tenant lean methodology
- Overall (STATE)
- 83 Strongly Landlord-Friendly
- State Oklahoma
- 83 Strongly Landlord-Friendly · R+20
- County
- — inherits STATE
- City
- — inherits STATE
ZIP-level market 74825
- Home prices YoY
- 1.7%
- Active inventory
- 25
- Price-to-rent
- 4.2×
Monthly cashflow live
- Estimated rent
- $1,187 medium interval (Pro) →
- Mortgage (P&I)
- −$315
- Tax from tax record
- −$86 /mo · $1,036/yr
- Insurance
- −$25
- HOA
- −$0
- Vacancy / Maint / Mgmt
- −$249
- Net cashflow
- $511
Break-even live
UW: 25.0% down · 7.5% · 30yr · 1.5% tax · 5.0% vac · 8.0% maint · 8.0% mgmt
Financing live
Cash to close
- Down payment
- $15,000
- Closing costs
- $1,800
- Reserves months
- —
- Total cash needed
- —
Loan-product check · same deal, 3 products live
Conventional
25% down · 7.5% · 30yr
- Down + closing
- —
- Monthly P&I
- —
- Monthly cashflow
- —
- DSCR
- —
- Eligible?
- —
Personal DTI + credit; lowest rate.
DSCR
20% down · 8.5% · 30yr
- Down + closing
- —
- Monthly P&I
- —
- Monthly cashflow
- —
- DSCR
- —
- Eligible?
- —
No personal income docs; deal must DSCR.
Hard money
10% down · 12.0% · 12mo
- Down + closing
- —
- Monthly P&I
- —
- Monthly cashflow
- —
- DSCR
- —
- Eligible?
- —
Short-term bridge; refi at stabilization.
Listing history 5 events
-
2026-04-23status Pending
-
2026-04-14$60,000 Active
-
2024-06-14soldstatus $50,000
-
2006-03-15soldstatus $67,000
-
2001-07-02soldstatus $40,000
ⓘ Source: listings_history table (triggers on properties + properties_extension) + one-shot
backfill from property_details.listing_events for pre-trigger history.
Tax reassessment forecast OK · Resets to sale price
- Current annual tax
- $1,036 · $86/mo
- Projected year-2 tax
- $1,036 · $86/mo
- Expected delta
- $0/yr ($0/mo · 0.0%)
ⓘ Screening estimate from a state-policy table — verify with the county assessor before closing.
Climate risk First Street
- Flood 1/10 Low FEMA zone X (unshaded) · 0% chance over 30 yrs
- Wildfire 6/10 Major
- Heat 6/10 Major 7 d/yr ≥110°F today · 19 d/yr by 30 yrs out
- Wind 4/10 Moderate 11% chance of damaging wind over 30 yrs
- Air quality 2/10 Low 0 unhealthy d/yr today · 1 by 30 yrs out
Nearby sold comps map
Loading sold comps map…
Walkable amenities ~0.75 mi
Loading nearby amenities…
Taxation est. · year 1
- Rental income
- $14,240
- − Mortgage interest
- −$3,361
- − Property taxes
- −$1,036
- − Insurance
- −$300
- − Repairs & maintenance
- −$1,139
- − Management
- −$1,139
- − Depreciation
- −$1,745
- Taxable income
- $5,519
- Est. tax owed @ 24.0%
- −$1,325
- After-tax cash flow
- $4,813/yr
For passive investors: Depreciation is non-cash, so a rental often shows a tax loss while cash-flowing — sheltering income. Rental losses are passive: they offset passive income freely, and up to $25,000/yr can offset ordinary (W-2) income if you actively participate and your MAGI is under $100k (phasing out to $0 by $150k); unused losses carry forward. On sale, claimed depreciation is recaptured at up to 25%, and gains may owe capital-gains tax (a 1031 exchange can defer both). Figures are a year-1 estimate at your 24.0% rate — not tax advice; consult a CPA.
Schools (NCES district)
- District
- Allen
- NCES district ID
- 4002760
- Math proficiency
- 17% ▲ 1.00%
- Reading proficiency
- 15% ▼ -7.00%
- Median HH income
- $44,024
- Composite
- 14.04/100
- National rank
- #9471
- State rank
- #208 of 270 in OK
Livability — Allen
- Score
- 60/100
- State rank
- #339
- US rank
- #18704
Category grades
Schools grade is shown separately in the Schools card above.
Census & demographics
- Census place
- Allen, OK
- Population (ZIP)
- 1,763
Population outlook (Hughes County) Hauer SSP2
- Today (2025)
- 13,323 people
- By 2030
- 13,172 · -1.1%
- By 2040
- 13,060 · -2.0%
- By 2050
- 13,130 · -1.4%
- By 2075
- 13,932 · +4.6%
- By 2100
- 14,649 · +10.0%
Race, ethnicity, and origin ACS 2023
- Neighborhood character
- Predominantly White (73%)
- Race & ethnicity
- White 73% Native American 16% Two or more races 6% Hispanic / Latino 5%
- Common ancestry
- Slovak 2% Lithuanian 2% Scottish 2%
- Foreign-born
- 2% · Canada
- Languages at home
- 95% English-only · Spanish 2%
Political lean MEDSL · Hughes
- 2024 margin
- Solid R (+62.5) · D 17.8% · R 80.4% · Other 1.8%
- 2008→2024 swing
- -33.1pp toward R · 2008: -29.4pp · 2024: -62.5pp
- All cycles
- 2024: R+62.5 2020: R+60.9 2016: R+53.6 2012: R+34.9 2008: R+29.4
Not yet ingested
- Civics
- —
Market trends
- HPI YoY
- ▲ 4.55%
- Current HPI
- 270.3801
- Rent YoY
- —
- Metro
- —
- State GDP YoY
- ▲ 1.55%
- F500 in state
- 6
Industry mix (Fortune 500 HQ in OK)
| Industry | F500 HQs | Revenue |
|---|---|---|
| Energy | 3 | $48B |
|
||
Price history
+50.0% since first listed5 events — show timeline
- 2026-04-23 Pending — MLS Technology, Inc.
- 2026-04-14 Listed $60,000 MLS Technology, Inc.
- 2024-06-14 Sold (Public Records) $50,000 Public Records
- 2006-03-15 Sold (Public Records) $67,000 Public Records
- 2001-07-02 Sold (Public Records) $40,000 Public Records
Property tax history
+7.6%/yrLatest (2025): $1,036 · +114.8% YoY. Source: county tax records.
Cash-flow waterfall
monthlySold comps — $/sqft
last 12 mo · ≤1 miLoading sold comps…