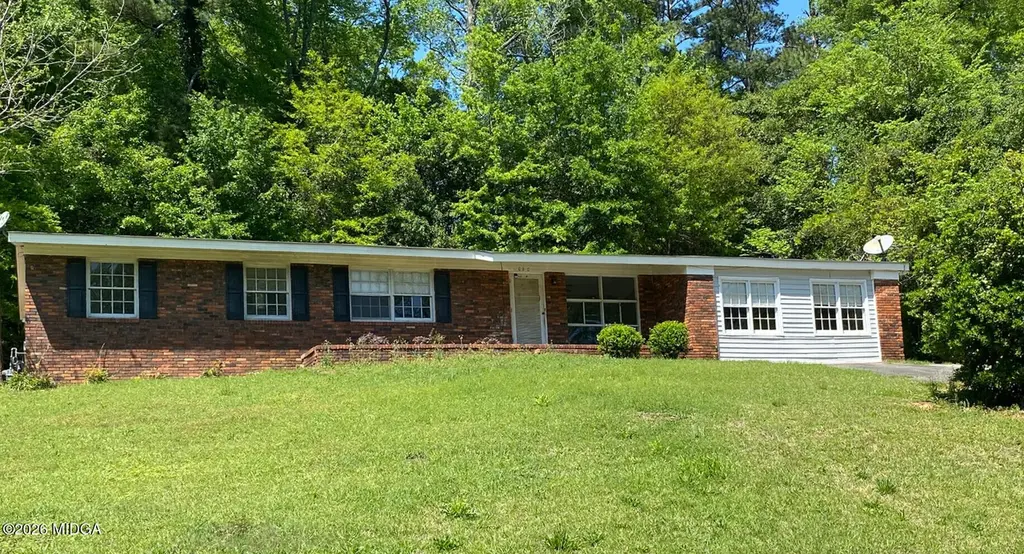
914 Glenbrook Rd · Macon-Bibb County, GA
Flood risk 1/10 · Minimal
- FEMA flood zone
- X (unshaded)
- Chance of flooding over 30 yrs
- 0.0%
- Est. flood insurance / yr
- $507 – $1,088
Fire risk 1/10 · Minimal
- Est. fire insurance / yr
- $963 – $1,789
Heat risk 7/10 · Major
- Hot days now (above 108°F)
- 7 days/yr
- Hot days in 30 yrs
- 17 days/yr
Wind risk 6/10 · Moderate
- Chance of severe wind over 30 yrs
- 63.0%
Air-quality risk 4/10 · Minor
- Unhealthy air days now
- 3 days/yr
- Unhealthy air days in 30 yrs
- 5 days/yr
Risk factors via First Street. Map © Google.
Why this score? — see what drove the D grade
The composite is a weighted blend of 9 inputs, each scored 0–100. Each bar is that input's sub-score; the figure is the points it added to the 100-point composite (weight × sub-score).
- Cash flow +14.1/30.0
- ARV discount +12.1/15.0
- DSCR +4.3/10.0
- 1% rule +3.3/10.0
- Rent growth +2.9/5.0
- Livability +2.5/5.0
- Condition / age +2.5/5.0
- Schools +1.2/10.0
- Appreciation +0.0/10.0
$189,000
🖨 Deal sheet (PDF) 📄 Offer letter ✓ Due diligence
Listing remarks MLS
All Brick One-Level Affordable 3 Bed 2 Ranch W/ Wraparound Driveway, Super Large Great Room, Separate Living Room, Dine-In Kitchen & Close To All North Macon Amenities. Currently Leased. Add To Your Portfolio Or Perfect Setting To Call Home. Priced To Sell!
Key facts
- Dine-in kitchen
- Wraparound driveway
- All brick
Tags
Neighborhood map
What this means for you Summary
Snapshot
- This is a 3-bed/2.0-bath single-family listed at $189k.
Deal economics
- At list price, monthly cash flow is $29 ($344/yr) — positive.
- The deal already cash-flows at list — no discount required.
- To meet the 1% rule (rent ≥ 1% of price), the offer needs to be $156k (17.2% below list).
- Recommended offer: $156k (17.2% below list) — sets the bar for 1% rule.
Location & tenants
- Location reads: area grade D — affects rentability + tenant quality, not the cash-flow math above.
- Bibb County (urban): math 11% / reading 18% proficiency, ranked #161 of 174 in GA (top 92%) — low school quality limits family demand, transient renter base, plan for 1-2y turnover; 75% free/reduced lunch — lower-income household profile, screen leases tightly.
- Zoned schools: Lane Elementary School (math 8% / reading 8%, grade F, #1,125 of 1,228 statewide, top 93%, 445 students, 100% FRL); Howard Middle School (math 16% / reading 30%, grade F, #321 of 470 statewide, top 69%, 992 students, 100% FRL); Howard High School (math 2% / reading 5%, grade F, #413 of 424 statewide, top 99%, 1,076 students, 100% FRL) — zoned schools average 100% FRL vs 75% district-wide (25 pts higher); higher-poverty schools than district average — tighter screening recommended.
- Market conditions: Rents rising (+1.7%/yr); 238 active listings in the ZIP; 9 comparable units currently listed for rent nearby; rentals at typical pace (median 23d on market — plan ~3-4 weeks tenant-placement turnaround); 44% of comp listings sitting > 30 days — soft ceiling on asking rent; solid renter incomes; 154 units permitted in Bibb County in 2024 (0 in 5+ unit buildings).
Forward outlook
- Local home prices are declining (-3.0%/yr); year-one equity from $1k of loan paydown is wiped out by about $6k of value loss. Plan a longer hold.
- Bibb County population projected at -12% by 2050 — secular population decline; favor cash flow + early exit over multi-decade hold.
Negotiation context
- It's been on market 69 days — a 6% lower offer ($178k) is reasonable based on typical stale-listing flexibility.
- 4 sale attempts since 3y ago with the ask held roughly flat each time — persistent listings suggest the price (not the market) is what's stuck; bring a comps-based counter.
- Current owner paid $125k; list at $189k implies a 51% gain — meaningful room to come down on a strong offer.
Risks & watch-outs
- Watch-outs: built in 1957 — expect roof / HVAC / electrical / plumbing capex.
- Climate carrying-cost: major wind risk, 63% chance of damaging wind over 30y; extreme-heat days projected 7→17/yr by 2055 (HVAC capex compounding) — expect insurance premiums to compound above CPI over the hold.
Questions for the listing agent
- It's been on market 69 days. Have you received any prior offers? Is the seller open to a 17% concession, seller financing, or rate buy-down credit?
- Built in 1957 — when were the roof, HVAC, electrical panel, plumbing, and water heater last replaced?
- Why hasn't it sold? Are there any deal-killer items the seller is aware of (foundation, flood, title, zoning, code violations)?
- Is there a deadline driving the sale (1031 exchange, divorce, estate, relocation)? That informs how much negotiation room exists.
- The area grade is low — what's the realistic commute time and amenity access for the typical tenant pool here? Any planned neighborhood developments (good or bad) we should know about?
- What's the average days-on-market for RENTAL listings here right now (not sales)? A rising rental-DOM trend means longer vacancies and softer asking-rent achievability than the comps imply.
- What's the recent tenant-quality profile in this submarket — average credit score on applications, eviction rate, late-payment / NSF rate, and stable-employment percentage? A property-management company in the area should have these aggregated.
- How much new for-sale + rental construction is in the pipeline within 1–3 miles? Heavy new supply typically softens prices + rents 12–24 months out; constrained supply supports both.
Investment metrics
- 1% rule
- 0.83% ✗
- Cap rate
- 6.47%
- Cash-on-cash
- 0.65%
- DSCR
- 1.03
- GRM
- 10.1
CMA / ARV
- ARV (median comp)
- $210,395
- List price
- $189,000
- Delta
- -10.17%
- Verdict
- UNDERPRICED
- Comps
- 20 within 1.0 mi
Show comp detail 12 sales within ~0.75 mi
| Address | Dist | Beds/Ba | Sqft | Sold | Price | $/sf | Match |
|---|---|---|---|---|---|---|---|
| 938 Lundy Ter | 0.16mi | 3/2.0 | 2,110 (+10%) | 6mo | $285,000 | $135 | 71 |
| 600 Lokchapee Rdg | 0.23mi | 4/3.5 (+1) | 1,996 (+4%) | 9mo | $260,000 | $130 | 64 |
| 673 Commanche Dr | 0.36mi | 4/2.0 (+1) | 2,086 (+9%) | 1mo | $210,000 | $101 | 63 |
| 859 Forest Lake Dr S | 0.25mi | 4/3.5 (+1) | 2,095 (+9%) | 3mo | $165,000 | $79 | 59 |
| 1412 Fern Dr | 0.75mi | 3/2.0 | 1,864 (-3%) | 2mo | $249,000 | $134 | 59 |
| 880 Winchester Cir | 0.62mi | 3/2.0 | 1,814 (-5%) | 5mo | $224,000 | $123 | 58 |
| 109 Kells Ct | 0.59mi | 4/2.5 (+1) | 1,925 (+0%) | 9mo | $265,500 | $138 | 57 |
| 718 Dogwood Cir | 0.49mi | 3/1.5 | 1,753 (-9%) | 7mo | $205,000 | $117 | 55 |
| 1246 Newport Rd | 0.61mi | 4/3.0 (+1) | 1,865 (-3%) | 5mo | $244,000 | $131 | 54 |
| 4515 N Beechwood Dr | 0.72mi | 3/2.0 | 2,028 (+6%) | 7mo | $219,900 | $108 | 51 |
| 1209 Normandy Rd | 0.42mi | 4/3.0 (+1) | 2,184 (+14%) | 2mo | $239,000 | $109 | 47 |
| 760 Blanton Blvd | 0.73mi | 4/2.0 (+1) | 1,727 (-10%) | 3mo | $212,062 | $123 | 42 |
Match score weights: distance 35% · size 25% · config 20% · recency 20%. Top-matched comps best support the ARV.
Projected returns pro-forma
-3.0% appreciation · 1.71% rent growth · sell at horizon
- IRR
- -16.6%
- Equity multiple
- 0.42×
- Total profit
- $-30,844
- Equity at exit
- $28,181
- IRR
- -10.8%
- Equity multiple
- 0.38×
- Total profit
- $-32,678
- Equity at exit
- $16,341
Cash invested: $52,920 (down + closing). Projections, not guarantees.
Landlord ↔ Tenant lean methodology
- Overall (STATE)
- 90 Strongly Landlord-Friendly
- State Georgia
- 90 Strongly Landlord-Friendly · R+3
- County
- — inherits STATE
- City
- — inherits STATE
ZIP-level market 31210
- Rents YoY
- 1.7%
- Active inventory
- 238
- Price-to-rent
- 10.1×
Monthly cashflow live
- Estimated rent
- $1,565 high interval (Pro) →
- Mortgage (P&I)
- −$991
- Tax from tax record
- −$138 /mo · $1,653/yr
- Insurance
- −$79
- HOA
- −$0
- Vacancy / Maint / Mgmt
- −$329
- Net cashflow
- $29
Break-even live
Sensitivity live
| Price | -10% $136 | -5% $82 | +0% $29 | +5% $-25 | +10% $-78 |
|---|---|---|---|---|---|
| Rent | -10% $-95 | -5% $-33 | +0% $29 | +5% $90 | +10% $152 |
| Rate | -1.0pp $124 | -0.5pp $77 | base $29 | +0.5pp $-20 | +1.0pp $-70 |
UW: 25.0% down · 7.5% · 30yr · 1.5% tax · 5.0% vac · 8.0% maint · 8.0% mgmt
Financing live
Cash to close
- Down payment
- $47,250
- Closing costs
- $5,670
- Reserves months
- —
- Total cash needed
- —
Loan-product check · same deal, 3 products live
Conventional
25% down · 7.5% · 30yr
- Down + closing
- —
- Monthly P&I
- —
- Monthly cashflow
- —
- DSCR
- —
- Eligible?
- —
Personal DTI + credit; lowest rate.
DSCR
20% down · 8.5% · 30yr
- Down + closing
- —
- Monthly P&I
- —
- Monthly cashflow
- —
- DSCR
- —
- Eligible?
- —
No personal income docs; deal must DSCR.
Hard money
10% down · 12.0% · 12mo
- Down + closing
- —
- Monthly P&I
- —
- Monthly cashflow
- —
- DSCR
- —
- Eligible?
- —
Short-term bridge; refi at stabilization.
Rent comps 9 comps
| Address | Beds | Baths | Sqft | Rent | $/sqft | DOM | Units | Dist |
|---|---|---|---|---|---|---|---|---|
| 3876 Northside Dr Macon, GA | 1.0–3.0 | 1.0–2.0 | 995 | $1,100 | $1.11 | 15d | 7 | 0.70mi |
| 3901 Northside Dr Macon, GA | 3.0 | 2.0 | 1250 | $1,100 | $0.88 | 23d | 1 | 0.84mi |
| 101 Village Ln Macon, GA | 2.0 | 2.0 | 1611 | $2,395 | $1.49 | 15d | 1 | 0.88mi |
| 777 Windsor Rd Macon, GA | 3.0 | 2.0 | 1442 | $1,850 | $1.28 | 45d | 1 | 1.05mi |
| 3896 Riverside Dr Macon, GA | 3.0 | 3.0 | 1550 | $1,324 | $0.85 | 23d | 1 | 1.15mi |
| 3896 Riverside Dr Macon, GA | 2.0 | 2.0 | 1305 | $1,024 | $0.78 | 45d | 1 | 1.15mi |
| 200 Charter Ln Macon, GA | 1.0–3.0 | 1.0–2.0 | 1088 | $1,525 | $1.40 | 15d | 18 | 1.23mi |
| 2962 Thornwood Dr Macon, GA | 3.0 | 2.0 | 1680 | $1,700 | $1.01 | 45d | 1 | 1.31mi |
| 810 Wesleyan Dr Macon, GA | 3.0 | 2.0 | 1337 | $1,900 | $1.42 | 45d | 1 | 1.33mi |
Listing history 28 events
-
2026-06-21days on market $189,000 Active 69 DOM
-
2026-06-19days on market $189,000 Active 67 DOM
-
2026-06-18days on market $189,000 Active 66 DOM
-
2026-06-17days on market $189,000 Active 65 DOM
-
2026-06-16days on market $189,000 Active 64 DOM
-
2026-06-15days on market $189,000 Active 63 DOM
-
2026-06-14days on market $189,000 Active 61 DOM
-
2026-06-13days on market $189,000 Active 60 DOM
-
2026-06-10days on market $189,000 Active 58 DOM
-
2026-06-09days on market $189,000 Active 57 DOM
-
2026-06-09days on market $189,000 Active 56 DOM
-
2026-06-07days on market $189,000 Active 55 DOM
-
2026-06-03days on market $189,000 Active 51 DOM
-
2026-06-02days on market $189,000 Active 50 DOM
-
2026-06-01days on market $189,000 Active 49 DOM
-
2026-05-31days on market $189,000 Active 48 DOM
-
2026-05-30days on market $189,000 Active 47 DOM
-
2026-04-13$189,000 Active 263-char remark
Show marketing remark (263 chars)
All Brick One-Level Affordable 3 Bed 2 Ranch W/ Wraparound Driveway, Super Large Great Room, Separate Living Room, Dine-In Kitchen & Close To All North Macon Amenities. Currently Leased. Add To Your Portfolio Or Perfect Setting To Call Home. Priced To Sell!
-
2023-03-10soldstatus $125,000 Sold 193-char remark
Show marketing remark (193 chars)
All brick 3 bedroom, 2 bath home in north Macon. house has tons of living space with huge great room, kitchen open to keeping room with fireplace. Perfect for first time home buyer or investor.
-
2023-03-10soldstatus $125,000
Show marketing remark (193 chars)
All brick 3 bedroom, 2 bath home in north Macon. house has tons of living space with huge great room, kitchen open to keeping room with fireplace. Perfect for first time home buyer or investor.
-
2023-03-10soldstatus $125,000 Closed
Show marketing remark (193 chars)
All brick 3 bedroom, 2 bath home in north Macon. house has tons of living space with huge great room, kitchen open to keeping room with fireplace. Perfect for first time home buyer or investor.
-
2023-02-07status Pending
Show marketing remark (193 chars)
All brick 3 bedroom, 2 bath home in north Macon. house has tons of living space with huge great room, kitchen open to keeping room with fireplace. Perfect for first time home buyer or investor.
-
2023-02-07status Under Contract 193-char remark
Show marketing remark (193 chars)
All brick 3 bedroom, 2 bath home in north Macon. house has tons of living space with huge great room, kitchen open to keeping room with fireplace. Perfect for first time home buyer or investor.
-
2023-02-02$124,500
-
2023-02-02$124,500 Active
-
2023-02-01$124,500 New 193-char remark
Show marketing remark (193 chars)
All brick 3 bedroom, 2 bath home in north Macon. house has tons of living space with huge great room, kitchen open to keeping room with fireplace. Perfect for first time home buyer or investor.
-
2006-02-28soldstatus $82,000
-
2005-08-02soldstatus $78,750
ⓘ Source: listings_history table (triggers on properties + properties_extension) + one-shot
backfill from property_details.listing_events for pre-trigger history.
Tax reassessment forecast GA · Resets to sale price
- Current annual tax
- $1,653 · $138/mo
- Projected year-2 tax
- $1,739 · $145/mo
- Expected delta
- +$86/yr (+$7/mo · 5.2%)
ⓘ Screening estimate from a state-policy table — verify with the county assessor before closing.
Climate risk First Street
- Flood 1/10 Low FEMA zone X (unshaded) · 0% chance over 30 yrs
- Wildfire 1/10 Low
- Heat 7/10 Severe 7 d/yr ≥108°F today · 17 d/yr by 30 yrs out
- Wind 6/10 Major 63% chance of damaging wind over 30 yrs
- Air quality 4/10 Moderate 3 unhealthy d/yr today · 5 by 30 yrs out
Nearby sold comps map
Loading sold comps map…
Walkable amenities ~0.75 mi
Loading nearby amenities…
Taxation est. · year 1
- Rental income
- $18,779
- − Mortgage interest
- −$10,587
- − Property taxes
- −$1,653
- − Insurance
- −$945
- − Repairs & maintenance
- −$1,502
- − Management
- −$1,502
- − Depreciation
- −$5,498
- Taxable loss
- −$2,909
- Est. tax savings @ 24.0%
- +$698
- After-tax cash flow
- $1,042/yr
For passive investors: Depreciation is non-cash, so a rental often shows a tax loss while cash-flowing — sheltering income. Rental losses are passive: they offset passive income freely, and up to $25,000/yr can offset ordinary (W-2) income if you actively participate and your MAGI is under $100k (phasing out to $0 by $150k); unused losses carry forward. On sale, claimed depreciation is recaptured at up to 25%, and gains may owe capital-gains tax (a 1031 exchange can defer both). Figures are a year-1 estimate at your 24.0% rate — not tax advice; consult a CPA.
Schools (NCES district)
- District
- Bibb County
- NCES district ID
- 1300420
- Math proficiency
- 11% ▼ -14.00%
- Reading proficiency
- 18% ▼ -11.00%
- Median HH income
- $37,426
- Composite
- 12.13/100
- National rank
- #9654
- State rank
- #161 of 174 in GA
Livability — Macon-Bibb County
No livability data for this city. (Only ~50 U.S. cities are tracked.)
Census & demographics
- Census place
- Macon-Bibb County, GA
- County
- Bibb County · 164,332 people
- City population
- 143,186
- Metro
- Macon-Bibb County, GA
- Population (ZIP)
- 33,288
- Household income
- $78,447
- Rent vs Own
- Severe rent burden
- 1845.0
Population outlook (Bibb County) Hauer SSP2
- Today (2025)
- 148,772 people
- By 2030
- 145,904 · -1.9%
- By 2040
- 139,404 · -6.3%
- By 2050
- 131,603 · -11.5%
- By 2075
- 111,050 · -25.4%
- By 2100
- 83,346 · -44.0%
Race, ethnicity, and origin ACS 2023
- Neighborhood character
- Diverse neighborhood (Simpson 0.62)
- Race & ethnicity
- White 52% Black 32% Two or more races 7% Hispanic / Latino 6% Asian 4%
- Hispanic origin (detail)
- Mexican 2% Cuban 1%
- Common ancestry
- Slovak 3% Serbian 1% Italian 1%
- Foreign-born
- 5% · Canada, China, South Korea
- Languages at home
- 93% English-only · Spanish 3% Other Indo-European 1% Chinese 1%
Political lean MEDSL · Bibb
- 2024 margin
- Strong D (+22.4) · D 61.0% · R 38.5%
- 2008→2024 swing
- +4.4pp toward D · 2008: 18.0pp · 2024: 22.4pp
- All cycles
- 2024: D+22.4 2020: D+23.8 2016: D+20.2 2012: D+20.0 2008: D+18.0
Not yet ingested
- Civics
- —
Market trends
- HPI YoY
- ▼ -144.60%
- Current HPI
- 172.1313
- Rent YoY
- ▲ 1.71%
- Metro
- Macon-Bibb County, GA
- State GDP YoY
- ▲ 2.66%
- F500 in state
- 28
Industry mix (Fortune 500 HQ in GA)
| Industry | F500 HQs | Revenue |
|---|---|---|
| Paper / Packaging | 2 | $29B |
|
||
| Retail | 1 | $160B |
|
||
| Transportation / Logistics | 1 | $91B |
|
||
| Airlines | 1 | $62B |
|
||
| Consumer Goods | 1 | $47B |
|
||
| Utilities | 1 | $25B |
|
||
Price history
+140.0% since first listed11 events — show timeline
- 2026-04-13 Listed $189,000 MGMLS
- 2023-03-10 Sold (MLS) $125,000 CGMLS
- 2023-03-10 Sold (MLS) $125,000 MGMLS
- 2023-03-10 Sold (MLS) $125,000 GAMLS
- 2023-02-07 Pending — CGMLS
- 2023-02-07 Pending — GAMLS
- 2023-02-02 Listed $124,500 CGMLS
- 2023-02-02 Listed $124,500 MGMLS
- 2023-02-01 Listed $124,500 GAMLS
- 2006-02-28 Sold (Public Records) $82,000 Public Records
- 2005-08-02 Sold (Public Records) $78,750 Public Records
Property tax history
+9.7%/yrLatest (2025): $1,653 · -1.3% YoY. Source: county tax records.
Cash-flow waterfall
monthlySold comps — $/sqft
last 12 mo · ≤1 miLoading sold comps…