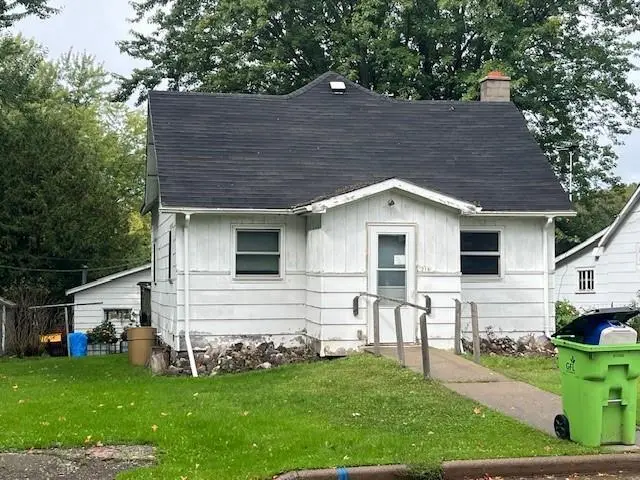
216 2nd St · Cornell, WI
Flood risk 1/10 · Minimal
- FEMA flood zone
- X (unshaded)
- Chance of flooding over 30 yrs
- 0.0%
- Est. flood insurance / yr
- $473 – $860
Fire risk 3/10 · Minor
- Est. fire insurance / yr
- $636 – $1,182
Heat risk 1/10 · Minimal
- Hot days now (above 95°F)
- 7 days/yr
- Hot days in 30 yrs
- 14 days/yr
Wind risk 1/10 · Minimal
- Chance of severe wind over 30 yrs
- —
Air-quality risk 2/10 · Minimal
- Unhealthy air days now
- 1 days/yr
- Unhealthy air days in 30 yrs
- 1 days/yr
Risk factors via First Street. Map © Google.
Why this score? — see what drove the C grade
The composite is a weighted blend of 9 inputs, each scored 0–100. Each bar is that input's sub-score; the figure is the points it added to the 100-point composite (weight × sub-score).
- Cash flow +19.4/30.0
- ARV discount +15.0/15.0
- DSCR +6.1/10.0
- 1% rule +4.3/10.0
- Schools +4.0/10.0
- Livability +3.6/5.0
- Rent growth +2.5/5.0
- Condition / age +2.5/5.0
- Appreciation +0.0/10.0
$122,900
🖨 Deal sheet 📄 Offer letter ✓ Due diligence
Listing remarks MLS
Lots of potential in the 4 bedroom home with an oversized, insulated 2 car garage. newer vinyl windows in 2016. Some newer flooring in the kitchen, living room, and dining room. Hardwood floors in upper bedrooms. 10x12 wood deck in backyard.
Key facts
- Wood deck
- Newer flooring
- Newer vinyl windows
Tags
Neighborhood map
What this means for you Summary
Snapshot
- This is a 3-bed/1.0-bath single-family listed at $123k.
Deal economics
- At list price, monthly cash flow is $138 ($2k/yr) — positive.
- The deal already cash-flows at list — no discount required.
- To meet the 1% rule (rent ≥ 1% of price), the offer needs to be $114k (7.2% below list).
- Recommended offer: $114k (7.2% below list) — sets the bar for 1% rule.
Location & tenants
- Location reads 71/100 on livability (#271 in WI) — a middle-class / working-renter tenant base. Strengths: crime A+, cost of living A+, housing A+; Watch: employment C-, amenities F, commute F.
- Cornell School District (rural): math 50% / reading 40% proficiency, ranked #190 of 426 in WI (top 45%) — families likely to look elsewhere, expect single-tenant / working-renter base with shorter leases.
- Market conditions: 11 active listings in the ZIP; 368 units permitted in Chippewa County in 2024 (142 in 5+ unit buildings).
Forward outlook
- Local home prices are declining (-3.0%/yr); year-one equity from $850 of loan paydown is wiped out by about $4k of value loss. Plan a longer hold.
- Chippewa County population projected to shrink 5% by 2050 — rents likely to lag national; underwrite the cash flow, not the appreciation.
Negotiation context
- It's been on market 78 days — a 6% lower offer ($116k) is reasonable based on typical stale-listing flexibility.
Risks & watch-outs
- Watch-outs: built in 1935 — expect roof / HVAC / electrical / plumbing capex.
Questions for the listing agent
- It's been on market 78 days. Have you received any prior offers? Is the seller open to a 7% concession, seller financing, or rate buy-down credit?
- Built in 1935 — when were the roof, HVAC, electrical panel, plumbing, and water heater last replaced?
- Why hasn't it sold? Are there any deal-killer items the seller is aware of (foundation, flood, title, zoning, code violations)?
- Is there a deadline driving the sale (1031 exchange, divorce, estate, relocation)? That informs how much negotiation room exists.
- What's the average days-on-market for RENTAL listings here right now (not sales)? A rising rental-DOM trend means longer vacancies and softer asking-rent achievability than the comps imply.
- What's the recent tenant-quality profile in this submarket — average credit score on applications, eviction rate, late-payment / NSF rate, and stable-employment percentage? A property-management company in the area should have these aggregated.
- How much new for-sale + rental construction is in the pipeline within 1–3 miles? Heavy new supply typically softens prices + rents 12–24 months out; constrained supply supports both.
Investment metrics
- 1% rule
- 0.93% ✗
- Cap rate
- 7.64%
- Cash-on-cash
- 4.81%
- DSCR
- 1.21
- GRM
- 9.0
CMA / ARV
- ARV (median comp)
- $149,993
- List price
- $122,900
- Delta
- -18.06%
- Verdict
- UNDERPRICED
- Comps
- 20 within 1.0 mi
Show comp detail 6 sales within ~0.75 mi
| Address | Dist | Beds/Ba | Sqft | Sold | Price | $/sf | Match |
|---|---|---|---|---|---|---|---|
| 213 2nd St | 0.03mi | 2/1.0 (-1) | 1,008 (-3%) | 3mo | $90,000 | $89 | 86 |
| 201 Thomas St | 0.07mi | 2/1.0 (-1) | 1,040 (0%) | 12mo | $165,000 | $159 | 82 |
| 116 5th St | 0.22mi | 2/1.0 (-1) | 1,010 (-3%) | 4mo | $161,000 | $159 | 76 |
| 113 5th St | 0.26mi | 2/1.0 (-1) | 984 (-5%) | 8mo | $167,500 | $170 | 67 |
| 208 2nd St | 0.02mi | 2/1.0 (-1) | 896 (-14%) | 12mo | $84,900 | $95 | 61 |
| 209 S 5th St | 0.33mi | 2/1.5 (-1) | 1,056 (+2%) | 23mo | $152,000 | $144 | 55 |
Match score weights: distance 35% · size 25% · config 20% · recency 20%. Top-matched comps best support the ARV.
Projected returns pro-forma
-3.0% appreciation · 3.0% rent growth · sell at horizon
- IRR
- -8.9%
- Equity multiple
- 0.68×
- Total profit
- $-11,172
- Equity at exit
- $18,325
- IRR
- 0.6%
- Equity multiple
- 1.04×
- Total profit
- $1,430
- Equity at exit
- $10,626
Cash invested: $34,412 (down + closing). Projections, not guarantees.
Landlord ↔ Tenant lean methodology
- Overall (STATE)
- 73 Landlord-Friendly
- State Wisconsin
- 73 Landlord-Friendly · R+2
- County
- — inherits STATE
- City
- — inherits STATE
ZIP-level market 54732
- Home prices YoY
- -14.7%
- Active inventory
- 11
- Price-to-rent
- 9.0×
Monthly cashflow live
- Estimated rent
- $1,140 medium interval (Pro) →
- Mortgage (P&I)
- −$645
- Tax from tax record
- −$67 /mo · $807/yr
- Insurance
- −$51
- HOA
- −$0
- Vacancy / Maint / Mgmt
- −$239
- Net cashflow
- $138
Break-even live
UW: 25.0% down · 7.5% · 30yr · 1.5% tax · 5.0% vac · 8.0% maint · 8.0% mgmt
Financing live
Cash to close
- Down payment
- $30,725
- Closing costs
- $3,687
- Reserves months
- —
- Total cash needed
- —
Loan-product check · same deal, 3 products live
Conventional
25% down · 7.5% · 30yr
- Down + closing
- —
- Monthly P&I
- —
- Monthly cashflow
- —
- DSCR
- —
- Eligible?
- —
Personal DTI + credit; lowest rate.
DSCR
20% down · 8.5% · 30yr
- Down + closing
- —
- Monthly P&I
- —
- Monthly cashflow
- —
- DSCR
- —
- Eligible?
- —
No personal income docs; deal must DSCR.
Hard money
10% down · 12.0% · 12mo
- Down + closing
- —
- Monthly P&I
- —
- Monthly cashflow
- —
- DSCR
- —
- Eligible?
- —
Short-term bridge; refi at stabilization.
Listing history 18 events
-
2026-06-18days on market $122,900 Active 78 DOM
-
2026-06-17days on market $122,900 Active 77 DOM
-
2026-06-16days on market $122,900 Active 76 DOM
-
2026-06-15days on market $122,900 Active 75 DOM
-
2026-06-15days on market $122,900 Active 74 DOM
-
2026-06-13days on market $122,900 Active 73 DOM
-
2026-06-12days on market $122,900 Active 72 DOM
-
2026-06-09days on market $122,900 Active 69 DOM
-
2026-06-08days on market $122,900 Active 68 DOM
-
2026-06-08days on market $122,900 Active 67 DOM
-
2026-06-05days on market $122,900 Active 65 DOM
-
2026-06-04price $122,900 Active 63 DOM
-
2026-06-03days on market $129,900 Active 63 DOM
-
2026-06-02days on market $129,900 Active 62 DOM
-
2026-06-01days on market $129,900 Active 61 DOM
-
2026-05-31days on market $129,900 Active 60 DOM
-
2026-05-01price $129,900 241-char remark
Show marketing remark (241 chars)
Lots of potential in the 4 bedroom home with an oversized, insulated 2 car garage. newer vinyl windows in 2016. Some newer flooring in the kitchen, living room, and dining room. Hardwood floors in upper bedrooms. 10x12 wood deck in backyard.
-
2026-03-31$139,900 Active 241-char remark
Show marketing remark (241 chars)
Lots of potential in the 4 bedroom home with an oversized, insulated 2 car garage. newer vinyl windows in 2016. Some newer flooring in the kitchen, living room, and dining room. Hardwood floors in upper bedrooms. 10x12 wood deck in backyard.
ⓘ Source: listings_history table (triggers on properties + properties_extension) + one-shot
backfill from property_details.listing_events for pre-trigger history.
Tax reassessment forecast WI · Partial reset (capped growth)
- Current annual tax
- $807 · $67/mo
- Projected year-2 tax
- $1,540 · $128/mo
- Expected delta
- +$733/yr (+$61/mo · 90.8%)
ⓘ Screening estimate from a state-policy table — verify with the county assessor before closing.
Climate risk First Street
- Flood 1/10 Low FEMA zone X (unshaded) · 0% chance over 30 yrs
- Wildfire 3/10 Moderate
- Heat 1/10 Low 7 d/yr ≥95°F today · 14 d/yr by 30 yrs out
- Wind 1/10 Low
- Air quality 2/10 Low 1 unhealthy d/yr today · 1 by 30 yrs out
Nearby sold comps map
Loading sold comps map…
Walkable amenities ~0.75 mi
Loading nearby amenities…
Taxation est. · year 1
- Rental income
- $13,683
- − Mortgage interest
- −$6,884
- − Property taxes
- −$807
- − Insurance
- −$614
- − Repairs & maintenance
- −$1,095
- − Management
- −$1,095
- − Depreciation
- −$3,575
- Taxable loss
- −$387
- Est. tax savings @ 24.0%
- +$93
- After-tax cash flow
- $1,747/yr
For passive investors: Depreciation is non-cash, so a rental often shows a tax loss while cash-flowing — sheltering income. Rental losses are passive: they offset passive income freely, and up to $25,000/yr can offset ordinary (W-2) income if you actively participate and your MAGI is under $100k (phasing out to $0 by $150k); unused losses carry forward. On sale, claimed depreciation is recaptured at up to 25%, and gains may owe capital-gains tax (a 1031 exchange can defer both). Figures are a year-1 estimate at your 24.0% rate — not tax advice; consult a CPA.
Schools (NCES district)
- District
- Cornell School District
- NCES district ID
- 5502880
- Math proficiency
- 50% ▼ -5.00%
- Reading proficiency
- 40% ▼ -10.00%
- Median HH income
- $43,516
- Composite
- 40.27/100
- National rank
- #7796
- State rank
- #190 of 426 in WI
Livability — Cornell
- Score
- 71/100
- State rank
- #271
- US rank
- #6999
Category grades
Schools grade is shown separately in the Schools card above.
Census & demographics
- Census place
- Cornell, WI
- Population (ZIP)
- 2,820
Population outlook (Chippewa County) Hauer SSP2
- Today (2025)
- 64,601 people
- By 2030
- 64,743 · +0.2%
- By 2040
- 63,950 · -1.0%
- By 2050
- 61,359 · -5.0%
- By 2075
- 53,265 · -17.5%
- By 2100
- 40,534 · -37.3%
Race, ethnicity, and origin ACS 2023
- Neighborhood character
- Predominantly White (97%)
- Race & ethnicity
- White 97% Hispanic / Latino 2% Two or more races 2%
- Common ancestry
- Portuguese 10% Romanian 6% Lithuanian 2%
- Foreign-born
- 0%
- Languages at home
- 97% English-only · German/W. Germanic 3%
Political lean MEDSL · Chippewa
- 2024 margin
- Strong R (+23.0) · D 38.0% · R 60.9% · Other 1.1%
- 2008→2024 swing
- -32.1pp toward R · 2008: 9.1pp · 2024: -23.0pp
- All cycles
- 2024: R+23.0 2020: R+20.4 2016: R+19.2 2012: R+0.5 2008: D+9.1
Not yet ingested
- Civics
- —
Market trends
- HPI YoY
- ▼ -40.22%
- Current HPI
- 234.2423
- Rent YoY
- —
- Metro
- —
- State GDP YoY
- ▲ 2.10%
- F500 in state
- 20
Industry mix (Fortune 500 HQ in WI)
| Industry | F500 HQs | Revenue |
|---|---|---|
| Industrial Machinery | 4 | $23B |
|
||
| Industrial Technology | 2 | $36B |
|
||
| Insurance | 1 | $36B |
|
||
| Professional Services | 1 | $19B |
|
||
| Utilities | 1 | $9B |
|
||
| Consumer Goods | 1 | $3B |
|
||
Price history
-7.1% since first listed2 events — show timeline
- 2026-05-01 Price Changed $129,900 RANWW
- 2026-03-31 Listed $139,900 RANWW
Property tax history
+0.2%/yrLatest (2025): $807 · +0.8% YoY. Source: county tax records.
Cash-flow waterfall
monthlySold comps — $/sqft
last 12 mo · ≤1 miLoading sold comps…