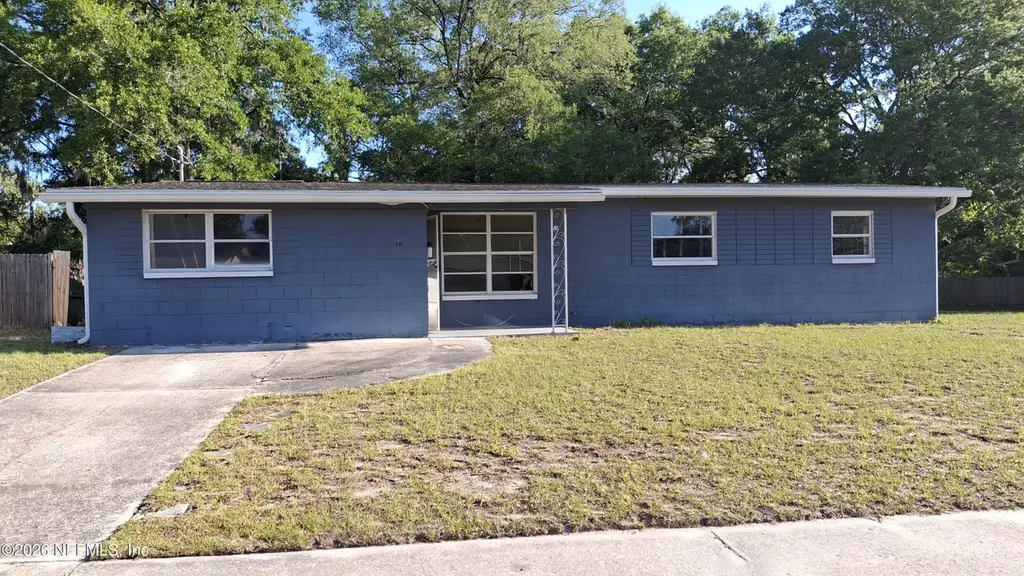
7619 Wycombe Dr N · Jacksonville, FL
Flood risk 1/10 · Minimal
- FEMA flood zone
- X (unshaded)
- Chance of flooding over 30 yrs
- 0.0%
- Est. flood insurance / yr
- $507 – $1,088
Fire risk 2/10 · Minimal
- Est. fire insurance / yr
- $947 – $1,759
Heat risk 9/10 · Severe
- Hot days now (above 107°F)
- 7 days/yr
- Hot days in 30 yrs
- 20 days/yr
Wind risk 10/10 · Severe
- Chance of severe wind over 30 yrs
- 99.0%
Air-quality risk 4/10 · Minor
- Unhealthy air days now
- 6 days/yr
- Unhealthy air days in 30 yrs
- 6 days/yr
Risk factors via First Street. Map © Google.
Why this score? — see what drove the B- grade
The composite is a weighted blend of 9 inputs, each scored 0–100. Each bar is that input's sub-score; the figure is the points it added to the 100-point composite (weight × sub-score).
- Cash flow +22.4/30.0
- ARV discount +15.0/15.0
- DSCR +7.2/10.0
- 1% rule +7.0/10.0
- Livability +4.2/5.0
- Schools +3.9/10.0
- Rent growth +3.0/5.0
- Condition / age +2.5/5.0
- Appreciation +0.0/10.0
$139,900
🖨 Deal sheet (PDF) 📄 Offer letter ✓ Due diligence
Listing remarks
Welcome! This solid concrete block home is filled with opportunity and flexible living space. As you enter the property, you're welcomed into a versatile layout designed for both everyday living and future customization. Whether you envision a home office, playroom, hobby area, fitness room, or media space, this additional room adds functionality to the home. Flowing from the family room, the dining room is situated to the left, creating a central gathering area. Just off the dining area is the walk-through kitchen As you continue through the hallway, the bathroom is located on the left-hand side for convenience. Slightly farther down the hall, you'll find the home's three bedrooms with
Key facts
- Versatile layout
- Walk-through kitchen
- Additional room
Tags
Property features AI
Finance
- HOA & community: Not a senior community
Exterior
- Parking: Off-street parking
- Utilities: Cable available; Electricity available; Water available
- Home design: Single family residence; One level
- Exterior features: 0.23-acre lot
Interior
- Bedrooms: 3 bedrooms
- Bathrooms: 1 full bathroom
- Heating & cooling: No heating listed; No cooling listed
- Interior features: No listed interior appliances
Neighborhood map
What this means for you Summary
Snapshot
- This is a 3-bed/1.0-bath single-family listed at $140k.
Deal economics
- At list price, monthly cash flow is $233 ($3k/yr) — positive.
- The deal already cash-flows at list — no discount required.
- Meets the 1% rule at list price ($2k rent vs $140k).
- Recommended offer: $138k (1.5% below list) — sets the bar for market timing.
- Cap rate 8.3% vs local median 4.0% in Jacksonville — top-decile yield for the area; either an underpriced asset or a hidden risk that comps aren't pricing in. Stress-test before assuming the spread holds.
Location & tenants
- Location reads 83/100 on livability (#50 in FL, #911 nationally) — a professional / high-income tenant draw. Strengths: amenities A+, commute A+, housing A+.
- Duval (urban): math 46% / reading 45% proficiency, ranked #48 of 73 in FL (top 66%) — families likely to look elsewhere, expect single-tenant / working-renter base with shorter leases.
- Market conditions: Rents rising (+1.9%/yr); 118 active listings in the ZIP; 40 comparable units currently listed for rent nearby; rentals at typical pace (median 15d on market — plan ~3-4 weeks tenant-placement turnaround); 6,503 units permitted in Duval County in 2024 (1,131 in 5+ unit buildings).
- This rent runs 33% of the median local income ($62k/yr) — at the standard rent-burdened threshold; future hikes will face affordability resistance.
Forward outlook
- Local home prices are declining (-3.0%/yr); year-one equity from $967 of loan paydown is wiped out by about $4k of value loss. Plan a longer hold.
- Duval County population projected at +19% by 2050 — long-run rental-demand tailwind backs the buy-and-hold thesis.
Negotiation context
- It's been on market 18 days — a 2% lower offer ($138k) is reasonable based on typical stale-listing flexibility.
- Current owner paid $28k; list at $140k implies a 400% gain — meaningful room to come down on a strong offer.
Risks & watch-outs
- Watch-outs: property tax is 2.6% of price.
- Climate carrying-cost: severe wind risk, 99% chance of damaging wind over 30y; extreme-heat days projected 7→20/yr by 2055 (HVAC capex compounding) — expect insurance premiums to compound above CPI over the hold.
Questions for the listing agent
- Built in 1960 — when were the roof, HVAC, electrical panel, plumbing, and water heater last replaced?
- Property tax is high relative to price — has the assessment been appealed recently, and will the sale trigger a re-assessment?
- Is there a deadline driving the sale (1031 exchange, divorce, estate, relocation)? That informs how much negotiation room exists.
- Schools are B-rated — typically a magnet for longer-tenancy family renters. What's the average tenant stay here, and is there a school-zone premium baked into asking?
- What's the average days-on-market for RENTAL listings here right now (not sales)? A rising rental-DOM trend means longer vacancies and softer asking-rent achievability than the comps imply.
- What's the recent tenant-quality profile in this submarket — average credit score on applications, eviction rate, late-payment / NSF rate, and stable-employment percentage? A property-management company in the area should have these aggregated.
- How much new for-sale + rental construction is in the pipeline within 1–3 miles? Heavy new supply typically softens prices + rents 12–24 months out; constrained supply supports both.
Investment metrics
- 1% rule
- 1.20% ✓
- Cap rate
- 8.29%
- Cash-on-cash
- 7.14%
- DSCR
- 1.32
- GRM
- 7.0
CMA / ARV
- ARV (on-the-fly)
- $258,687
- Comps found
- 12
Show comp detail 12 sales within ~0.75 mi
| Address | Dist | Beds/Ba | Sqft | Sold | Price | $/sf | Match |
|---|---|---|---|---|---|---|---|
| 7619 Wycombe Dr N | 0.00mi | 3/1.0 | 1,287 (0%) | 0mo | $150,001 | $117 | 100 |
| 7824 Rocky Fort Trl | 0.34mi | 3/2.0 | 1,284 (-0%) | 3mo | $269,000 | $210 | 77 |
| 7328 Bamberg Rd | 0.34mi | 3/2.0 | 1,246 (-3%) | 3mo | $259,900 | $209 | 72 |
| 3380 Net Ct | 0.51mi | 3/2.0 | 1,292 (+0%) | 2mo | $298,000 | $231 | 70 |
| 7251 Lawn Tennis Ln | 0.58mi | 3/2.0 | 1,303 (+1%) | 2mo | $250,000 | $192 | 65 |
| 7427 Rentz Ct | 0.40mi | 3/1.5 | 1,172 (-9%) | 2mo | $254,000 | $217 | 63 |
| 7295 Us Open Blvd | 0.40mi | 3/2.0 | 1,399 (+9%) | 0mo | $265,000 | $189 | 63 |
| 2819 Lauderdale Dr E | 0.25mi | 3/2.0 | 1,450 (+13%) | 2mo | $280,000 | $193 | 62 |
| 2615 Kershaw Dr W | 0.49mi | 4/2.0 (+1) | 1,225 (-5%) | 3mo | $255,000 | $208 | 58 |
| 2721 Lansdowne Dr | 0.36mi | 4/2.0 (+1) | 1,424 (+11%) | 0mo | $286,000 | $201 | 56 |
| 7029 Hielo Dr | 0.75mi | 3/2.0 | 1,350 (+5%) | 1mo | $265,000 | $196 | 52 |
| 2531 E Burlingame Dr | 0.57mi | 4/2.0 (+1) | 1,460 (+13%) | 0mo | $278,000 | $190 | 42 |
Match score weights: distance 35% · size 25% · config 20% · recency 20%. Top-matched comps best support the ARV.
Projected returns pro-forma
-3.0% appreciation · 1.94% rent growth · sell at horizon
- IRR
- -6.6%
- Equity multiple
- 0.76×
- Total profit
- $-9,491
- Equity at exit
- $20,860
- IRR
- 1.6%
- Equity multiple
- 1.11×
- Total profit
- $4,158
- Equity at exit
- $12,096
Cash invested: $39,172 (down + closing). Projections, not guarantees.
Landlord ↔ Tenant lean methodology
- Overall (STATE)
- 87 Strongly Landlord-Friendly
- State Florida
- 87 Strongly Landlord-Friendly · R+3
- County
- — inherits STATE
- City
- — inherits STATE
ZIP-level market 32277
- Rents YoY
- 1.9%
- Active inventory
- 118
- Price-to-rent
- 7.0×
Monthly cashflow live
- Estimated rent
- $1,676 high interval (Pro) →
- Mortgage (P&I)
- −$734
- Tax from tax record
- −$299 /mo · $3,593/yr
- Insurance
- −$58
- HOA
- −$0
- Vacancy / Maint / Mgmt
- −$352
- Net cashflow
- $233
Break-even live
Sensitivity live
| Price | -10% $312 | -5% $273 | +0% $233 | +5% $194 | +10% $154 |
|---|---|---|---|---|---|
| Rent | -10% $101 | -5% $167 | +0% $233 | +5% $299 | +10% $366 |
| Rate | -1.0pp $304 | -0.5pp $269 | base $233 | +0.5pp $197 | +1.0pp $160 |
UW: 25.0% down · 7.5% · 30yr · 1.5% tax · 5.0% vac · 8.0% maint · 8.0% mgmt
Financing live
Cash to close
- Down payment
- $34,975
- Closing costs
- $4,197
- Reserves months
- —
- Total cash needed
- —
Loan-product check · same deal, 3 products live
Conventional
25% down · 7.5% · 30yr
- Down + closing
- —
- Monthly P&I
- —
- Monthly cashflow
- —
- DSCR
- —
- Eligible?
- —
Personal DTI + credit; lowest rate.
DSCR
20% down · 8.5% · 30yr
- Down + closing
- —
- Monthly P&I
- —
- Monthly cashflow
- —
- DSCR
- —
- Eligible?
- —
No personal income docs; deal must DSCR.
Hard money
10% down · 12.0% · 12mo
- Down + closing
- —
- Monthly P&I
- —
- Monthly cashflow
- —
- DSCR
- —
- Eligible?
- —
Short-term bridge; refi at stabilization.
Rent comps 40 comps
| Address | Beds | Baths | Sqft | Rent | $/sqft | DOM | Units | Dist |
|---|---|---|---|---|---|---|---|---|
| 7720 Lauderdale Dr N Jacksonville, FL | 4.0 | 2.0 | 1708 | $1,906 | $1.12 | 14d | 1 | 0.11mi |
| 7537 Dalehurst Dr S Jacksonville, FL | 3.0 | 2.0 | 1170 | $1,524 | $1.30 | 4d | 1 | 0.12mi |
| 7716 Monetta Dr Jacksonville, FL | 3.0 | 2.0 | 1401 | $1,716 | $1.22 | 24d | 1 | 0.14mi |
| 7609 Tacony Dr Jacksonville, FL | 3.0 | 1.0 | 1176 | $1,450 | $1.23 | 4d | 1 | 0.18mi |
| 7609 Tacony Dr Jacksonville, FL | 3.0 | 1.0 | 1176 | $1,450 | $1.23 | 24d | 1 | 0.18mi |
| 2921 Mansion Rd Jacksonville, FL | 3.0 | 2.0 | 1450 | $1,845 | $1.27 | 24d | 1 | 0.30mi |
| 7336 Merrill Rd Jacksonville, FL | 4.0 | 2.0 | 1468 | $1,800 | $1.23 | 4d | 1 | 0.34mi |
| 7925 Merrill Rd Jacksonville, FL | 1.0–3.0 | 1.0–2.0 | 1065 | $1,750 | $1.64 | 2d | 46 | 0.43mi |
| 3460 Net Ct Jacksonville, FL | 3.0 | 2.0 | 1292 | $1,869 | $1.45 | 3d | 1 | 0.57mi |
| 8230 Dames Point Crossing Blvd N #1103 Jacksonville, FL | 2.0 | 2.5 | 1100 | $1,100 | $1.00 | 11d | 1 | 0.67mi |
| 7027 Berrywood Ln Jacksonville, FL | 3.0 | 2.0 | 1247 | $1,875 | $1.50 | 24d | 1 | 0.67mi |
| 7920 Merrill Rd Jacksonville, FL | 2.0–3.0 | 2.0 | 1048 | $1,400 | $1.34 | 17d | 5 | 0.68mi |
| 7920 Merrill Rd Jacksonville, FL | 2.0–3.0 | 2.0 | 1048 | $1,350 | $1.29 | 2d | 3 | 0.68mi |
| 7920 Merrill Rd Jacksonville, FL | 2.0–3.0 | 2.0 | 1048 | $1,350 | $1.29 | 8d | 4 | 0.68mi |
| 7656 Arble Dr Jacksonville, FL | 2.0 | 1.5 | 1192 | $1,490 | $1.25 | 4d | 1 | 0.68mi |
| 3501 Townsend Blvd Jacksonville, FL | 3.0 | 1.0–2.5 | 816 | $1,475 | $1.81 | 2d | 25 | 0.69mi |
| 7608 Rain Forest Dr N Jacksonville, FL | 3.0 | 2.0 | 1312 | $1,745 | $1.33 | 21d | 1 | 0.72mi |
| 3450 Townsend Blvd Jacksonville, FL | 3.0 | 1.0–2.0 | 816 | $1,346 | $1.65 | 15d | 13 | 0.72mi |
| 3683 Hartsfield Forest Cir Jacksonville, FL | 3.0 | 2.5 | 1716 | $1,700 | $0.99 | 24d | 1 | 0.79mi |
| 3523 Colony Cove Trl W Jacksonville, FL | 2.0 | 2.0 | 1062 | $1,450 | $1.37 | 24d | 1 | 0.79mi |
| 3545 Villa Pl Jacksonville, FL | 3.0 | 2.0 | 1386 | $1,695 | $1.22 | 24d | 1 | 0.80mi |
| 3544 Villa Pl Jacksonville, FL | 2.0 | 2.0 | 1086 | $1,400 | $1.29 | 24d | 1 | 0.82mi |
| 3654 Hartsfield Forest Cir Jacksonville, FL | 3.0 | 2.5 | 1716 | $1,800 | $1.05 | 15d | 1 | 0.84mi |
| 3617 Hartsfield Forest Cir Jacksonville, FL | 3.0 | 2.5 | 1701 | $1,698 | $1.00 | 8d | 1 | 0.90mi |
| 8543 Fort Caroline Rd Jacksonville, FL | 3.0 | 1.0 | 957 | $1,800 | $1.88 | 24d | 1 | 1.07mi |
| 1600 Lansdowne Dr Jacksonville, FL | 1.0–2.0 | 1.0 | 850 | $1,049 | $1.23 | 4d | 12 | 1.11mi |
| 1715 Garden Grove Ct Jacksonville, FL | 3.0 | 3.0 | 1717 | $1,950 | $1.14 | 14d | 1 | 1.14mi |
| 1715 Garden Grove Ct Jacksonville, FL | 3.0 | 2.5 | 1704 | $1,950 | $1.14 | 24d | 1 | 1.14mi |
| 1566 Quante Rd Jacksonville, FL | 3.0 | 2.0 | 1416 | $1,674 | $1.18 | 17d | 1 | 1.15mi |
| 1566 Quante Rd Jacksonville, FL | 3.0 | 2.0 | 1416 | $1,674 | $1.18 | 24d | 1 | 1.15mi |
| 7118 Pellias Rd Jacksonville, FL | 4.0 | 2.0 | 1294 | $1,700 | $1.31 | 19d | 1 | 1.18mi |
| 3459 Rogero Rd Jacksonville, FL | 3.0 | 2.0 | 1322 | $1,695 | $1.28 | 24d | 1 | 1.24mi |
| 2328 Caladium Rd Jacksonville, FL | 3.0 | 2.0 | 1425 | $1,595 | $1.12 | 24d | 1 | 1.26mi |
| 2335 Rogero Rd Jacksonville, FL | 4.0 | 2.0 | 1606 | $1,499 | $0.93 | 15d | 1 | 1.28mi |
| 2845 Holly Point Dr Jacksonville, FL | 3.0 | 2.0 | 1612 | $1,995 | $1.24 | 24d | 1 | 1.28mi |
| 6308 Merrill Rd Jacksonville, FL | 3.0 | 2.0 | 1292 | $1,585 | $1.23 | 8d | 1 | 1.30mi |
| 6260 Merrill Rd Jacksonville, FL | 3.0 | 2.0 | 1600 | $1,645 | $1.03 | 4d | 1 | 1.32mi |
| 1573 Landau Rd Jacksonville, FL | 3.0 | 2.5 | 1480 | $1,700 | $1.15 | 8d | 1 | 1.33mi |
| 1496 Fieldview Dr Jacksonville, FL | 2.0 | 2.5 | 1008 | $1,400 | $1.39 | 8d | 1 | 1.33mi |
| 1468 Pitney Cir Jacksonville, FL | 2.0 | 2.5 | 1076 | $1,650 | $1.53 | 8d | 1 | 1.33mi |
Listing history 5 events
-
2026-06-02status $139,900 Pending 18 DOM
-
2026-06-01days on market $139,900 Active Under Contract 18 DOM
-
2026-05-31days on market $139,900 Active Under Contract 17 DOM
-
2026-05-14$139,900 Active
-
1978-10-20soldstatus $28,000
ⓘ Source: listings_history table (triggers on properties + properties_extension) + one-shot
backfill from property_details.listing_events for pre-trigger history.
Tax reassessment forecast FL · Resets to sale price
- Current annual tax
- $3,593 · $299/mo
- Projected year-2 tax
- $3,593 · $299/mo
- Expected delta
- $0/yr ($0/mo · 0.0%)
ⓘ Screening estimate from a state-policy table — verify with the county assessor before closing.
Climate risk First Street
- Flood 1/10 Low FEMA zone X (unshaded) · 0% chance over 30 yrs
- Wildfire 2/10 Low
- Heat 9/10 Extreme 7 d/yr ≥107°F today · 20 d/yr by 30 yrs out
- Wind 10/10 Extreme 99% chance of damaging wind over 30 yrs
- Air quality 4/10 Moderate 6 unhealthy d/yr today · 6 by 30 yrs out
Nearby sold comps map
Loading sold comps map…
Walkable amenities ~0.75 mi
Loading nearby amenities…
Taxation est. · year 1
- Rental income
- $20,118
- − Mortgage interest
- −$7,837
- − Property taxes
- −$3,593
- − Insurance
- −$700
- − Repairs & maintenance
- −$1,609
- − Management
- −$1,609
- − Depreciation
- −$4,070
- Taxable income
- $700
- Est. tax owed @ 24.0%
- −$168
- After-tax cash flow
- $2,629/yr
For passive investors: Depreciation is non-cash, so a rental often shows a tax loss while cash-flowing — sheltering income. Rental losses are passive: they offset passive income freely, and up to $25,000/yr can offset ordinary (W-2) income if you actively participate and your MAGI is under $100k (phasing out to $0 by $150k); unused losses carry forward. On sale, claimed depreciation is recaptured at up to 25%, and gains may owe capital-gains tax (a 1031 exchange can defer both). Figures are a year-1 estimate at your 24.0% rate — not tax advice; consult a CPA.
Schools (NCES district)
- District
- Duval
- NCES district ID
- 1200480
- Math proficiency
- 46% ▼ -11.00%
- Reading proficiency
- 45% ▼ -4.00%
- Median HH income
- $48,987
- Composite
- 38.97/100
- National rank
- #4076
- State rank
- #48 of 73 in FL
Livability — Jacksonville
- Score
- 83/100
- State rank
- #50
- US rank
- #911
Category grades
Schools grade is shown separately in the Schools card above.
Census & demographics
- Census place
- Jacksonville, FL
- County
- Duval County · 1,015,274 people
- City population
- 979,034
- Metro
- Jacksonville, FL
- Population (ZIP)
- 36,338
- Household income
- $61,554
- Rent vs Own
- Severe rent burden
- 2550.0
Population outlook (Duval County) Hauer SSP2
- Today (2025)
- 1,013,010 people
- By 2030
- 1,059,228 · +4.6%
- By 2040
- 1,141,439 · +12.7%
- By 2050
- 1,205,258 · +19.0%
- By 2075
- 1,324,282 · +30.7%
- By 2100
- 1,319,620 · +30.3%
Race, ethnicity, and origin ACS 2023
- Neighborhood character
- Diverse neighborhood (Simpson 0.68)
- Race & ethnicity
- White 41% Black 36% Hispanic / Latino 16% Two or more races 10% Asian 3%
- Hispanic origin (detail)
- Mexican 1% Puerto Rican 7% Cuban 4%
- Common ancestry
- Hispanic 5% Slovak 2% Lithuanian 1%
- Foreign-born
- 15% · Canada, Jamaica, Vietnam
- Languages at home
- 80% English-only · Spanish 10% French/Haitian/Cajun 4% Russian/Polish/Slavic 2%
Political lean MEDSL · Duval
- 2024 margin
- Toss-up / Even · D 48.7% · R 50.1% · Other 1.2%
- 2008→2024 swing
- +0.4pp no change · 2008: -1.9pp · 2024: -1.5pp
- All cycles
- 2024: R+1.5 2020: D+3.8 2016: R+1.5 2012: R+3.6 2008: R+1.9
Not yet ingested
- Civics
- —
Market trends
- HPI YoY
- ▼ -180.79%
- Current HPI
- 289.4062
- Rent YoY
- ▲ 1.94%
- Metro
- Jacksonville, FL
- State GDP YoY
- ▲ 3.28%
- F500 in state
- 36
Industry mix (Fortune 500 HQ in FL)
| Industry | F500 HQs | Revenue |
|---|---|---|
| Industrial Technology | 2 | $29B |
|
||
| Insurance | 2 | $17B |
|
||
| Retail | 1 | $60B |
|
||
| Technology Distribution | 1 | $58B |
|
||
| Homebuilding | 1 | $35B |
|
||
| Technology Manufacturing | 1 | $35B |
|
||
Price history
+399.6% since first listed2 events — show timeline
- 2026-05-14 Listed $139,900 realMLS
- 1978-10-20 Sold (Public Records) $28,000 Public Records
Property tax history
+16.7%/yrLatest (2025): $3,593 · +11.7% YoY. Source: county tax records.
Cash-flow waterfall
monthlySold comps — $/sqft
last 12 mo · ≤1 miLoading sold comps…