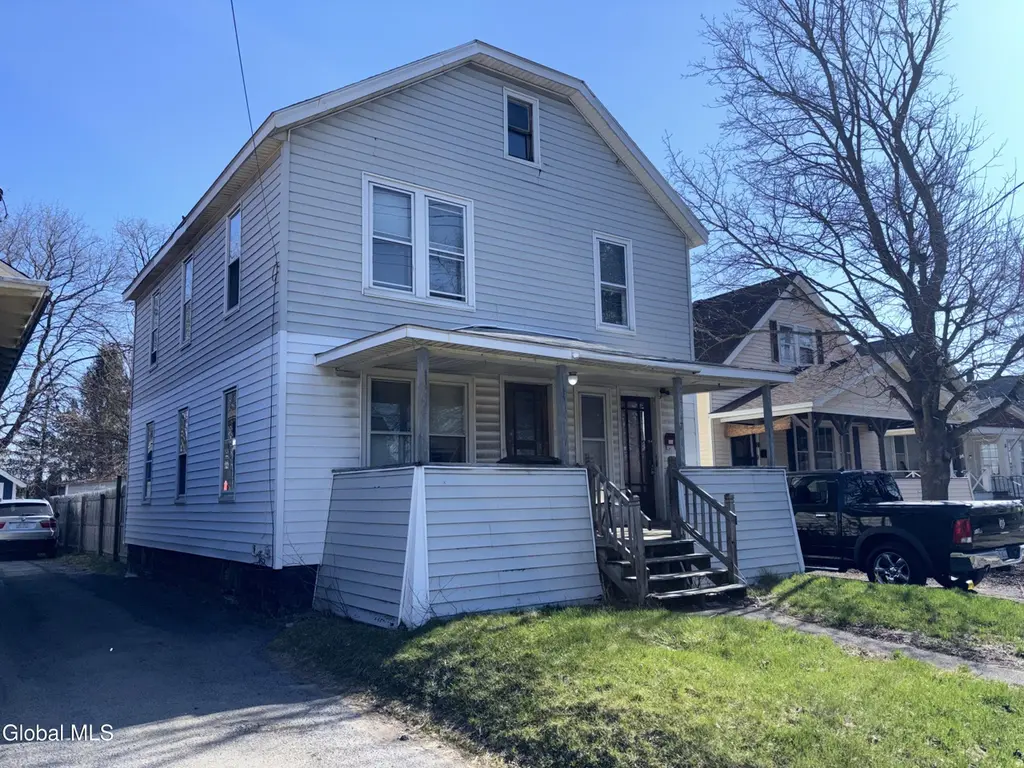
 Duplex
None · Scotia, NY
Flood risk 1/10 · Minimal
- FEMA flood zone
- X (unshaded)
- Chance of flooding over 30 yrs
- 0.0%
- Est. flood insurance / yr
- $473 – $860
Fire risk 1/10 · Minimal
- Est. fire insurance / yr
- $691 – $1,283
Heat risk 4/10 · Minor
- Hot days now (above 96°F)
- 7 days/yr
- Hot days in 30 yrs
- 17 days/yr
Wind risk 2/10 · Minimal
- Chance of severe wind over 30 yrs
- 4.0%
Air-quality risk 1/10 · Minimal
- Unhealthy air days now
- 0 days/yr
- Unhealthy air days in 30 yrs
- 0 days/yr
Risk factors via First Street. Map © Google.
Why this score? — see what drove the B+ grade
The composite is a weighted blend of 9 inputs, each scored 0–100. Each bar is that input's sub-score; the figure is the points it added to the 100-point composite (weight × sub-score).
- Cash flow +28.5/30.0
- ARV discount +15.0/15.0
- DSCR +10.0/10.0
- 1% rule +8.8/10.0
- Schools +5.4/10.0
- Livability +3.9/5.0
- Rent growth +2.5/5.0
- Condition / age +2.5/5.0
- Appreciation +0.0/10.0
$239,000
🖨 Deal sheet 📄 Offer letter ✓ Due diligence
Multi-family units
County records classify this as Multi-Family (2-4 Unit). Listing-text estimate: 2 units. confirmed
Listing remarks MLS
Charming 1910 two-family home in the Village of Scotia offering solid investment or owner occupied potential. The property features a paved driveway, storage shed, fenced-in yard, separate utilities, and a forced hot air natural gas furnace. Both units are in livable condition with opportunity for cosmetic updates to add value. One unit is currently rented, providing immediate income. Ideal for investors or buyers looking to offset expenses with rental revenue. Convenient location close to local amenities, shopping and major routes.
Key facts
- 6,534 sq ft lot
- 6 parking spots
- Built 1910
Neighborhood map
What this means for you Summary
Snapshot
- This is a 2 × 2-bed/1.0-bath units multifamily listed at $239k.
Deal economics
- At list price, monthly cash flow is $784 ($9k/yr) — positive. Per door: $392/mo.
- The deal already cash-flows at list — no discount required.
- Meets the 1% rule at list price ($3k rent vs $239k).
- Recommended offer: $225k (6.0% below list) — sets the bar for market timing.
- Cap rate 10.2% vs local median 4.3% in Scotia — top-decile yield for the area; either an underpriced asset or a hidden risk that comps aren't pricing in. Stress-test before assuming the spread holds.
Location & tenants
- Location reads 78/100 on livability (#173 in NY, #2,688 nationally) — a middle-class / working-renter tenant base. Strengths: housing A+, health & safety A+, schools A; Watch: crime D, amenities D, commute F.
- Scotia-Glenville Central School District (suburban): math 57% / reading 68% proficiency, ranked #193 of 590 in NY (top 33%) — acceptable for families but not a draw, mixed tenant base, ~2y average lease; only 19% free/reduced lunch — higher-income household profile.
- Market conditions: 127 active listings in the ZIP; 3 comparable units currently listed for rent nearby; rentals at typical pace (median 14d on market — plan ~3-4 weeks tenant-placement turnaround); solid renter incomes; 154 units permitted in Schenectady County in 2024 (54 in 5+ unit buildings).
- This rent runs 40% of the median local income ($98k/yr) — at the standard rent-burdened threshold; future hikes will face affordability resistance.
Forward outlook
- Local home prices are declining (-3.0%/yr); year-one equity from $2k of loan paydown is wiped out by about $7k of value loss. Plan a longer hold.
- Schenectady County population projected to shrink 4% by 2050 — rents likely to lag national; underwrite the cash flow, not the appreciation.
- At projected returns (-3.0% appreciation + 3.0% rent growth), your $67k cash investment doubles in ~9 years — after that, you're playing with house money.
Negotiation context
- It's been on market 68 days — a 6% lower offer ($225k) is reasonable based on typical stale-listing flexibility.
- Current owner paid $160k; 49% above their basis — modest negotiation headroom, anchor on the comps not their cost.
Risks & watch-outs
- Watch-outs: built in 1910 — expect roof / HVAC / electrical / plumbing capex.
Questions for the listing agent
- It's been on market 68 days. Have you received any prior offers? Is the seller open to a 6% concession, seller financing, or rate buy-down credit?
- Can we see the unit-by-unit rent roll, current vacancy, and any below-market leases? What's the average tenancy length?
- What capital expenditures (roof, boiler, parking lot, exteriors) have been made in the last 5 years, and what's planned in the next 2?
- Built in 1910 — when were the roof, HVAC, electrical panel, plumbing, and water heater last replaced?
- Why hasn't it sold? Are there any deal-killer items the seller is aware of (foundation, flood, title, zoning, code violations)?
- Is there a deadline driving the sale (1031 exchange, divorce, estate, relocation)? That informs how much negotiation room exists.
- Schools are A-rated — typically a magnet for longer-tenancy family renters. What's the average tenant stay here, and is there a school-zone premium baked into asking?
- Crime grade is D in this area — have there been break-ins, vandalism, or insurance claims at this property in the last 3 years? What carrier currently insures it and at what premium?
- What's the average days-on-market for RENTAL listings here right now (not sales)? A rising rental-DOM trend means longer vacancies and softer asking-rent achievability than the comps imply.
- What's the recent tenant-quality profile in this submarket — average credit score on applications, eviction rate, late-payment / NSF rate, and stable-employment percentage? A property-management company in the area should have these aggregated.
- How much new apartment / multifamily construction is in the pipeline within 1–3 miles? Heavy new supply (>2% of stock underway) typically softens rents 12–24 months out; light construction supports rent growth.
Investment metrics
- 1% rule
- 1.38% ✓
- Cap rate
- 10.23%
- Cash-on-cash
- 14.06%
- DSCR
- 1.63
- GRM
- 6.0
CMA / ARV
- ARV (median comp)
- $433,325
- List price
- $239,000
- Delta
- -44.85%
- Verdict
- UNDERPRICED
- Comps
- 20 within 1.0 mi
Show comp detail 4 sales within ~0.75 mi
| Address | Dist | Beds/Ba | Sqft | Sold | Price | $/sf | Match |
|---|---|---|---|---|---|---|---|
| 235 Washington Ave | 0.65mi | 4/2.0 | 1,950 (0%) | 2mo | $358,000 | $184 | 68 |
| 330 Mohawk Ave | 0.66mi | 4/2.0 | 1,932 (-1%) | 13mo | $180,000 | $93 | 56 |
| 310 Huston St | 0.29mi | 4/2.0 | 2,208 (+13%) | 11mo | $284,500 | $129 | 56 |
| 210 N Ballston Ave | 0.67mi | 4/2.0 | 1,824 (-6%) | 10mo | $275,000 | $151 | 49 |
Match score weights: distance 35% · size 25% · config 20% · recency 20%. Top-matched comps best support the ARV.
Projected returns pro-forma
-3.0% appreciation · 3.0% rent growth · sell at horizon
- IRR
- 4.4%
- Equity multiple
- 1.17×
- Total profit
- $11,347
- Equity at exit
- $35,636
- IRR
- 13.9%
- Equity multiple
- 2.12×
- Total profit
- $74,788
- Equity at exit
- $20,664
Cash invested: $66,920 (down + closing). Projections, not guarantees.
Landlord ↔ Tenant lean methodology
- Overall (STATE)
- 15 Strongly Tenant-Friendly
- State New York
- 15 Strongly Tenant-Friendly · D+10
- County
- — inherits STATE
- City
- — inherits STATE
ZIP-level market 12302
- Active inventory
- 127
- Price-to-rent
- 12.1×
Monthly cashflow live
- Estimated rent
- $3,298 high interval (Pro) →
- Mortgage (P&I)
- −$1,253
- Tax from tax record
- −$469 /mo · $5,624/yr
- Insurance
- −$100
- HOA
- −$0
- Vacancy / Maint / Mgmt
- −$693
- Net cashflow
- $784
Break-even live
2-unit breakdown (identical units grouped — click to expand)
| Units | Beds | Baths | Est. rent |
|---|---|---|---|
| 2× units | 2 | 1 | $3,298 |
| #1 | 2 | 1 | $1,649 |
| #2 | 2 | 1 | $1,649 |
| Total (2 units) | $3,298 | ||
UW: 25.0% down · 7.5% · 30yr · 1.5% tax · 5.0% vac · 8.0% maint · 8.0% mgmt
Financing live
Cash to close
- Down payment
- $59,750
- Closing costs
- $7,170
- Reserves months
- —
- Total cash needed
- —
Loan-product check · same deal, 3 products live
Conventional
25% down · 7.5% · 30yr
- Down + closing
- —
- Monthly P&I
- —
- Monthly cashflow
- —
- DSCR
- —
- Eligible?
- —
Personal DTI + credit; lowest rate.
DSCR
20% down · 8.5% · 30yr
- Down + closing
- —
- Monthly P&I
- —
- Monthly cashflow
- —
- DSCR
- —
- Eligible?
- —
No personal income docs; deal must DSCR.
Hard money
10% down · 12.0% · 12mo
- Down + closing
- —
- Monthly P&I
- —
- Monthly cashflow
- —
- DSCR
- —
- Eligible?
- —
Short-term bridge; refi at stabilization.
Rent comps 3 comps
| Address | Beds | Baths | Sqft | Rent | $/sqft | DOM | Units | Dist |
|---|---|---|---|---|---|---|---|---|
| 211 Sacandaga Rd Schenectady, NY | 3.0 | 2.0 | 1291 | $2,190 | $1.70 | 44d | 1 | 0.58mi |
| 211 Sacandaga Rd Schenectady, NY | 3.0 | 2.0 | 1291 | $2,140 | $1.66 | 14d | 1 | 0.58mi |
| 100 Reserve Ct Schenectady, NY | 1.0–3.0 | 1.0–2.0 | 1106 | $2,445 | $2.21 | 14d | 1 | 1.34mi |
Listing history 21 events
-
2026-06-18days on market $239,000 Active 68 DOM
-
2026-06-17days on market $239,000 Active 67 DOM
-
2026-06-16days on market $239,000 Active 66 DOM
-
2026-06-15days on market $239,000 Active 65 DOM
-
2026-06-14days on market $239,000 Active 63 DOM
-
2026-06-13days on market $239,000 Active 62 DOM
-
2026-06-10days on market $239,000 Active 60 DOM
-
2026-06-09days on market $239,000 Active 59 DOM
-
2026-06-08days on market $239,000 Active 58 DOM
-
2026-06-07days on market $239,000 Active 57 DOM
-
2026-06-05days on market $239,000 Active 54 DOM
-
2026-06-03days on market $239,000 Active 53 DOM
-
2026-06-02days on market $239,000 Active 52 DOM
-
2026-06-01days on market $239,000 Active 51 DOM
-
2026-05-31days on market $239,000 Active 50 DOM
-
2026-05-31days on market $239,000 Active 49 DOM
-
2026-04-24price $260,000 538-char remark
Show marketing remark (538 chars)
Charming 1910 two-family home in the Village of Scotia offering solid investment or owner occupied potential. The property features a paved driveway, storage shed, fenced-in yard, separate utilities, and a forced hot air natural gas furnace. Both units are in livable condition with opportunity for cosmetic updates to add value. One unit is currently rented, providing immediate income. Ideal for investors or buyers looking to offset expenses with rental revenue. Convenient location close to local amenities, shopping and major routes.
-
2026-04-11$299,000 Active 538-char remark
Show marketing remark (538 chars)
Charming 1910 two-family home in the Village of Scotia offering solid investment or owner occupied potential. The property features a paved driveway, storage shed, fenced-in yard, separate utilities, and a forced hot air natural gas furnace. Both units are in livable condition with opportunity for cosmetic updates to add value. One unit is currently rented, providing immediate income. Ideal for investors or buyers looking to offset expenses with rental revenue. Convenient location close to local amenities, shopping and major routes.
-
2006-11-17soldstatus $160,000
-
2006-08-09soldstatus $79,200
-
2002-01-25soldstatus $78,900
ⓘ Source: listings_history table (triggers on properties + properties_extension) + one-shot
backfill from property_details.listing_events for pre-trigger history.
Tax reassessment forecast NY · Partial reset (capped growth)
- Current annual tax
- $5,624 · $469/mo
- Projected year-2 tax
- $5,624 · $469/mo
- Expected delta
- $0/yr ($0/mo · 0.0%)
ⓘ Screening estimate from a state-policy table — verify with the county assessor before closing.
Climate risk First Street
- Flood 1/10 Low FEMA zone X (unshaded) · 0% chance over 30 yrs
- Wildfire 1/10 Low
- Heat 4/10 Moderate 7 d/yr ≥96°F today · 17 d/yr by 30 yrs out
- Wind 2/10 Low 4% chance of damaging wind over 30 yrs
- Air quality 1/10 Low 0 unhealthy d/yr today · 0 by 30 yrs out
Nearby sold comps map
Loading sold comps map…
Walkable amenities ~0.75 mi
Loading nearby amenities…
Taxation est. · year 1
- Rental income
- $39,576
- − Mortgage interest
- −$13,388
- − Property taxes
- −$5,624
- − Insurance
- −$1,195
- − Repairs & maintenance
- −$3,166
- − Management
- −$3,166
- − Depreciation
- −$6,953
- Taxable income
- $6,084
- Est. tax owed @ 24.0%
- −$1,460
- After-tax cash flow
- $7,945/yr
For passive investors: Depreciation is non-cash, so a rental often shows a tax loss while cash-flowing — sheltering income. Rental losses are passive: they offset passive income freely, and up to $25,000/yr can offset ordinary (W-2) income if you actively participate and your MAGI is under $100k (phasing out to $0 by $150k); unused losses carry forward. On sale, claimed depreciation is recaptured at up to 25%, and gains may owe capital-gains tax (a 1031 exchange can defer both). Figures are a year-1 estimate at your 24.0% rate — not tax advice; consult a CPA.
Schools (NCES district)
- District
- Scotia-Glenville Central School District
- NCES district ID
- 3626310
- Math proficiency
- 57% ▼ -7.00%
- Reading proficiency
- 68% ▲ 11.00%
- Median HH income
- $62,663
- Composite
- 54.32/100
- National rank
- #1367
- State rank
- #193 of 590 in NY
Livability — Scotia
- Score
- 78/100
- State rank
- #173
- US rank
- #2688
Category grades
Schools grade is shown separately in the Schools card above.
Census & demographics
- Census place
- Scotia, NY
- County
- Schenectady County · 141,369 people
- Metro
- Albany-Schenectady-Troy, NY
- Population (ZIP)
- 28,031
- Household income
- $98,163
- Rent vs Own
- Severe rent burden
- 632.0
Population outlook (Schenectady County) Hauer SSP2
- Today (2025)
- 155,046 people
- By 2030
- 154,322 · -0.5%
- By 2040
- 151,796 · -2.1%
- By 2050
- 148,621 · -4.1%
- By 2075
- 141,229 · -8.9%
- By 2100
- 126,014 · -18.7%
Race, ethnicity, and origin ACS 2023
- Neighborhood character
- Predominantly White (90%)
- Race & ethnicity
- White 90% Two or more races 5% Hispanic / Latino 3% Asian 2% Black 2%
- Common ancestry
- Romanian 9% Lithuanian 4% Italian 3%
- Foreign-born
- 4% · Canada, China
- Languages at home
- 94% English-only · Spanish 2% Chinese 1% Other Indo-European 1%
Political lean MEDSL · Schenectady
- 2024 margin
- D (+10.8) · D 55.4% · R 44.6%
- 2008→2024 swing
- -1.8pp toward R · 2008: 12.7pp · 2024: 10.8pp
- All cycles
- 2024: D+10.8 2020: D+15.7 2016: D+5.8 2012: D+15.4 2008: D+12.7
Not yet ingested
- Civics
- —
Market trends
- HPI YoY
- ▼ -274.86%
- Current HPI
- 304.1765
- Rent YoY
- —
- Metro
- Albany-Schenectady-Troy, NY
- State GDP YoY
- ▲ 2.60%
- F500 in state
- 92
Industry mix (Fortune 500 HQ in NY)
| Industry | F500 HQs | Revenue |
|---|---|---|
| Financial Services | 10 | $950B |
|
||
| Consumer Goods | 9 | $162B |
|
||
| Insurance | 4 | $225B |
|
||
| Telecommunications | 2 | $144B |
|
||
| Pharmaceuticals | 2 | $112B |
|
||
| Media / Entertainment | 2 | $69B |
|
||
Price history
+229.5% since first listed5 events — show timeline
- 2026-04-24 Price Changed $260,000 Global MLS
- 2026-04-11 Listed $299,000 Global MLS
- 2006-11-17 Sold (Public Records) $160,000 Public Records
- 2006-08-09 Sold (Public Records) $79,200 Public Records
- 2002-01-25 Sold (Public Records) $78,900 Public Records
Property tax history
+1.5%/yrLatest (2025): $5,624 · +3.0% YoY. Source: county tax records.
Cash-flow waterfall
monthlySold comps — $/sqft
last 12 mo · ≤1 miLoading sold comps…