22571 Nebula Way · Connerton, FL
Flood risk No data
- FEMA flood zone
- —
- Chance of flooding over 30 yrs
- —
- Est. flood insurance / yr
- —
Fire risk No data
- Est. fire insurance / yr
- —
Heat risk No data
- Hot days now (above threshold)
- —
- Hot days in 30 yrs
- —
Wind risk No data
- Chance of severe wind over 30 yrs
- —
Air-quality risk No data
- Unhealthy air days now
- —
- Unhealthy air days in 30 yrs
- —
Risk factors via First Street. Map © Google.
Why this score? — see what drove the C+ grade
The composite is a weighted blend of 9 inputs, each scored 0–100. Each bar is that input's sub-score; the figure is the points it added to the 100-point composite (weight × sub-score).
- Cash flow +18.9/30.0
- ARV discount +12.0/15.0
- DSCR +6.0/10.0
- 1% rule +5.0/10.0
- Schools +4.3/10.0
- Appreciation +4.2/10.0
- Condition / age +4.0/5.0
- Livability +3.3/5.0
- Rent growth +2.5/5.0
$395,900
🖨 Deal sheet 📄 Offer letter ✓ Due diligence
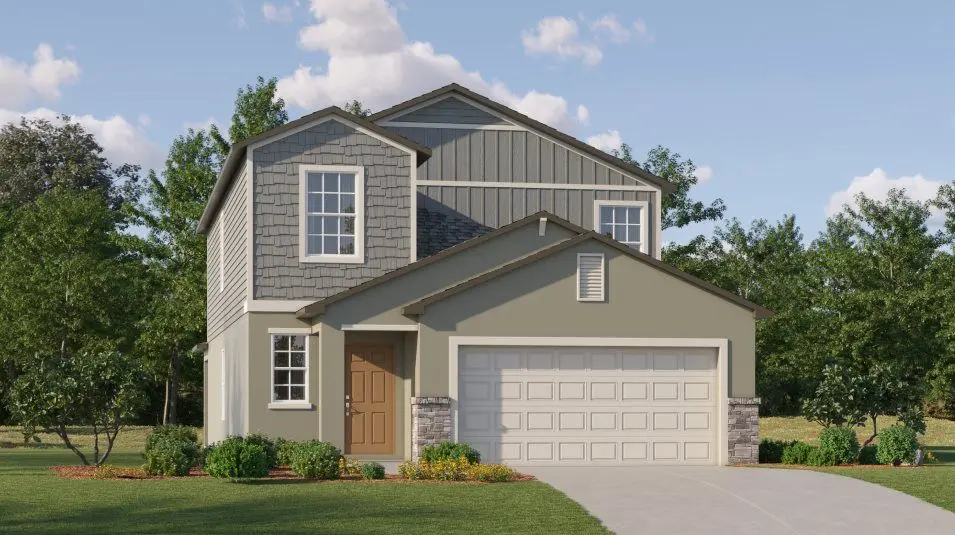
Listing remarks
This two-story home divides space for optimal tranquility. The first floor showcases an open design that encompasses the dining room, kitchen and living room for simplified family living and entertaining. Nearby, the owner's suite is separate from the upstairs bedrooms and features a private bathroom. The second level hosts four additional bedrooms and a versatile loft.
Key facts
- Private bathroom
- Owner's suite
- Versatile loft
Tags
Property features AI
Finance
- Other: Address: 22571 Nebula Way, Land O Lakes, FL 34637; Listing status: Active; Last modified: 2026-05-24
- Financial info: Listed price $397,400
Exterior
- Parking: 2 garage spaces (2 parking spaces total)
- Home design: Single-family residence; Spec home
- Exterior features: Living area of 2,389
Interior
- Bedrooms: 5 bedrooms
- Bathrooms: 2 full bathrooms, 1 half bathroom
- Interior features: Spec-built Columbia plan
Neighborhood map
What this means for you Summary
Snapshot
- This is a 5-bed/2.5-bath single-family listed at $396k. Condition is rated good.
Deal economics
- At list price, monthly cash flow is $407 ($5k/yr) — positive.
- The deal already cash-flows at list — no discount required.
- Meets the 1% rule at list price ($4k rent vs $396k).
- Cap rate 7.5% vs local median 4.3% in Connerton — top-decile yield for the area; either an underpriced asset or a hidden risk that comps aren't pricing in. Stress-test before assuming the spread holds.
Location & tenants
- Location reads 66/100 on livability (#596 in FL) — a middle-class / working-renter tenant base. Strengths: crime A+, employment A+, housing A+; Watch: schools D+, amenities F, commute F.
- Pasco (suburban): math 50% / reading 52% proficiency, ranked #32 of 73 in FL (top 44%) — acceptable for families but not a draw, mixed tenant base, ~2y average lease.
- Market conditions: 285 active listings in the ZIP; 2 comparable units currently listed for rent nearby; high-income renter base; 6,765 units permitted in Pasco County in 2024 (1,250 in 5+ unit buildings).
- This rent runs 41% of the median local income ($115k/yr) — at the standard rent-burdened threshold; future hikes will face affordability resistance.
Forward outlook
- Local home prices are declining (-1.5%/yr); year-one equity from $3k of loan paydown is wiped out by about $6k of value loss. Plan a longer hold.
- Pasco County population projected at +29% by 2050 — long-run rental-demand tailwind backs the buy-and-hold thesis.
Negotiation context
- Only 11 days on market — expect competitive offers; lowballing is unlikely to land.
Questions for the listing agent
- Is there a deadline driving the sale (1031 exchange, divorce, estate, relocation)? That informs how much negotiation room exists.
- Schools are D-rated, which usually means shorter tenancies and higher turnover. Who's the typical renter profile here, and what's been the actual vacancy rate?
- What's the average days-on-market for RENTAL listings here right now (not sales)? A rising rental-DOM trend means longer vacancies and softer asking-rent achievability than the comps imply.
- What's the recent tenant-quality profile in this submarket — average credit score on applications, eviction rate, late-payment / NSF rate, and stable-employment percentage? A property-management company in the area should have these aggregated.
- How much new for-sale + rental construction is in the pipeline within 1–3 miles? Heavy new supply typically softens prices + rents 12–24 months out; constrained supply supports both.
Investment metrics
- 1% rule
- 1.00% ✓
- Cap rate
- 7.53%
- Cash-on-cash
- 4.40%
- DSCR
- 1.20
- GRM
- 8.3
CMA / ARV
- ARV (on-the-fly)
- $439,576
- Comps found
- 12
Show comp detail 12 sales within ~0.75 mi
| Address | Dist | Beds/Ba | Sqft | Sold | Price | $/sf | Match |
|---|---|---|---|---|---|---|---|
| 22312 Pleasant Morning Dr | 0.24mi | 5/2.5 | 2,389 (0%) | 1mo | $439,000 | $184 | 88 |
| 7852 Painted Sky Pl | 0.39mi | 5/2.5 | 2,389 (0%) | 1mo | $390,900 | $164 | 81 |
| 22321 Nebula Way | 0.22mi | 5/2.5 | 2,389 (0%) | 20mo | $439,900 | $184 | 73 |
| 8521 Ehren Cutoff | 0.44mi | 4/2.0 (-1) | 2,290 (-4%) | 2mo | $657,000 | $287 | 64 |
| 22318 Blazing Star Run | 0.21mi | 5/2.5 | 2,215 (-7%) | 20mo | $394,900 | $178 | 61 |
| 8303 Painted Sky Pl | 0.33mi | 4/3.0 (-1) | 2,453 (+3%) | 20mo | $534,900 | $218 | 56 |
| 22342 Blazing Star Run | 0.19mi | 6/3.0 (+1) | 2,580 (+8%) | 19mo | $444,900 | $172 | 55 |
| 22337 Nebula Way | 0.20mi | 6/3.0 (+1) | 2,580 (+8%) | 19mo | $464,600 | $180 | 54 |
| 22326 Blazing Star Run | 0.20mi | 6/3.0 (+1) | 2,580 (+8%) | 20mo | $432,900 | $168 | 53 |
| 22297 Nebula Way | 0.24mi | 6/3.0 (+1) | 2,580 (+8%) | 20mo | $449,900 | $174 | 52 |
| 8747 Flourish Dr | 0.65mi | 4/3.0 (-1) | 2,529 (+6%) | 10mo | $465,000 | $184 | 45 |
| 8144 Mallow Mirror Ln | 0.71mi | 4/3.0 (-1) | 2,313 (-3%) | 18mo | $590,000 | $255 | 39 |
Match score weights: distance 35% · size 25% · config 20% · recency 20%. Top-matched comps best support the ARV.
Projected returns pro-forma
-1.54% appreciation · 3.0% rent growth · sell at horizon
- IRR
- -2.9%
- Equity multiple
- 0.88×
- Total profit
- $-13,358
- Equity at exit
- $85,435
- IRR
- 4.5%
- Equity multiple
- 1.40×
- Total profit
- $44,650
- Equity at exit
- $81,340
Cash invested: $110,852 (down + closing). Projections, not guarantees.
Landlord ↔ Tenant lean methodology
- Overall (STATE)
- 87 Strongly Landlord-Friendly
- State Florida
- 87 Strongly Landlord-Friendly · R+3
- County
- — inherits STATE
- City
- — inherits STATE
ZIP-level market 34637
- Home prices YoY
- -1.2%
- Active inventory
- 285
- Price-to-rent
- 8.3×
Monthly cashflow live
- Estimated rent
- $3,978 medium interval (Pro) →
- Mortgage (P&I)
- −$2,076
- Tax est. 1.5%
- −$495 /mo · $5,938/yr
- Insurance
- −$165
- HOA
- −$0
- Vacancy / Maint / Mgmt
- −$835
- Net cashflow
- $407
Break-even live
UW: 25.0% down · 7.5% · 30yr · 1.5% tax · 5.0% vac · 8.0% maint · 8.0% mgmt
Financing live
Cash to close
- Down payment
- $98,975
- Closing costs
- $11,877
- Reserves months
- —
- Total cash needed
- —
Loan-product check · same deal, 3 products live
Conventional
25% down · 7.5% · 30yr
- Down + closing
- —
- Monthly P&I
- —
- Monthly cashflow
- —
- DSCR
- —
- Eligible?
- —
Personal DTI + credit; lowest rate.
DSCR
20% down · 8.5% · 30yr
- Down + closing
- —
- Monthly P&I
- —
- Monthly cashflow
- —
- DSCR
- —
- Eligible?
- —
No personal income docs; deal must DSCR.
Hard money
10% down · 12.0% · 12mo
- Down + closing
- —
- Monthly P&I
- —
- Monthly cashflow
- —
- DSCR
- —
- Eligible?
- —
Short-term bridge; refi at stabilization.
Rent comps 2 comps
| Address | Beds | Baths | Sqft | Rent | $/sqft | DOM | Units | Dist |
|---|---|---|---|---|---|---|---|---|
| 22310 Blazing Star Run Land O Lakes, FL | 4.0 | 2.5 | 1870 | $2,650 | $1.42 | 18d | 1 | 0.20mi |
| 9645 Carabiner Way Land O' Lakes, FL | 4.0 | 2.5 | 1870 | $2,700 | $1.44 | 24d | 1 | 1.22mi |
Listing history 6 events
-
2026-06-04days on market $395,900 Active 11 DOM
-
2026-06-03days on market $395,900 Active 10 DOM
-
2026-06-02pricedays on market $395,900 Active 9 DOM
-
2026-06-01days on market $397,900 Active 8 DOM
-
2026-06-01price $397,900 Active 7 DOM
-
2026-05-31days on market $397,400 Active 7 DOM
ⓘ Source: listings_history table (triggers on properties + properties_extension) + one-shot
backfill from property_details.listing_events for pre-trigger history.
Nearby sold comps map
Loading sold comps map…
Walkable amenities ~0.75 mi
Loading nearby amenities…
Taxation est. · year 1
- Rental income
- $47,739
- − Mortgage interest
- −$22,177
- − Property taxes
- −$5,938
- − Insurance
- −$1,980
- − Repairs & maintenance
- −$3,819
- − Management
- −$3,819
- − Depreciation
- −$11,517
- Taxable loss
- −$1,510
- Est. tax savings @ 24.0%
- +$363
- After-tax cash flow
- $5,245/yr
For passive investors: Depreciation is non-cash, so a rental often shows a tax loss while cash-flowing — sheltering income. Rental losses are passive: they offset passive income freely, and up to $25,000/yr can offset ordinary (W-2) income if you actively participate and your MAGI is under $100k (phasing out to $0 by $150k); unused losses carry forward. On sale, claimed depreciation is recaptured at up to 25%, and gains may owe capital-gains tax (a 1031 exchange can defer both). Figures are a year-1 estimate at your 24.0% rate — not tax advice; consult a CPA.
Condition & rehab AI · 27 photos
This two-story home is in good condition with a modern and well-maintained interior and exterior. It offers a good balance of comfort and style, making it an attractive option for both resale and rental.
Value-add opportunities
- Both Paint the exterior — Enhances curb appeal and value
- Both Replace the carpet in the bedrooms — Improves comfort and appearance
- Both Install smart home devices — Enhances convenience and marketability
Renovation cost estimate screening
Value-add ROI direction
- Both Paint the exterior — Enhances curb appeal and value ↑
- Both Replace the carpet in the bedrooms — Improves comfort and appearance ↑
- Both Install smart home devices — Enhances convenience and marketability ↑
ⓘ Cost ranges are severity-bucket heuristics (US national rule-of-thumb). Get contractor quotes + a written scope before underwriting a rehab budget.
Schools (NCES district)
- District
- Pasco
- NCES district ID
- 1201530
- Math proficiency
- 50% ▼ -10.00%
- Reading proficiency
- 52% ▼ -5.00%
- Median HH income
- $45,039
- Composite
- 43.14/100
- National rank
- #3074
- State rank
- #32 of 73 in FL
Livability — Connerton
- Score
- 66/100
- State rank
- #596
- US rank
- #11437
Category grades
Schools grade is shown separately in the Schools card above.
Census & demographics
- Census place
- Connerton, FL
- County
- Pasco County · 524,098 people
- City population
- 11,398
- Metro
- Tampa-St. Petersburg-Clearwater, FL
- Population (ZIP)
- 13,049
- Household income
- $115,214
- Rent vs Own
- Severe rent burden
- 96.0
Population outlook (Pasco County) Hauer SSP2
- Today (2025)
- 570,045 people
- By 2030
- 605,844 · +6.3%
- By 2040
- 674,806 · +18.4%
- By 2050
- 736,022 · +29.1%
- By 2075
- 862,900 · +51.4%
- By 2100
- 906,364 · +59.0%
Race, ethnicity, and origin ACS 2023
- Neighborhood character
- Predominantly White (70%)
- Race & ethnicity
- White 70% Hispanic / Latino 16% Two or more races 10% Black 7% Asian 5%
- Hispanic origin (detail)
- Mexican 1% Puerto Rican 10% Cuban 1%
- Common ancestry
- Romanian 5% Italian 3% Iranian 2%
- Foreign-born
- 8% · Canada
- Languages at home
- 85% English-only · Spanish 8% Other Indo-European 4% Tagalog/Filipino 1%
Political lean MEDSL · Pasco
- 2024 margin
- Strong R (+25.2) · D 36.9% · R 62.1% · Other 1.0%
- 2008→2024 swing
- -21.6pp toward R · 2008: -3.6pp · 2024: -25.2pp
- All cycles
- 2024: R+25.2 2020: R+20.1 2016: R+21.6 2012: R+6.7 2008: R+3.6
Not yet ingested
- Civics
- —
Market trends
- HPI YoY
- ▼ -1.54%
- Current HPI
- 126.1415
- Rent YoY
- —
- Metro
- Tampa-St. Petersburg-Clearwater, FL
- State GDP YoY
- ▲ 3.28%
- F500 in state
- 36
Industry mix (Fortune 500 HQ in FL)
| Industry | F500 HQs | Revenue |
|---|---|---|
| Industrial Technology | 2 | $29B |
|
||
| Insurance | 2 | $17B |
|
||
| Retail | 1 | $60B |
|
||
| Technology Distribution | 1 | $58B |
|
||
| Homebuilding | 1 | $35B |
|
||
| Technology Manufacturing | 1 | $35B |
|
||
Cash-flow waterfall
monthlySold comps — $/sqft
last 12 mo · ≤1 miLoading sold comps…