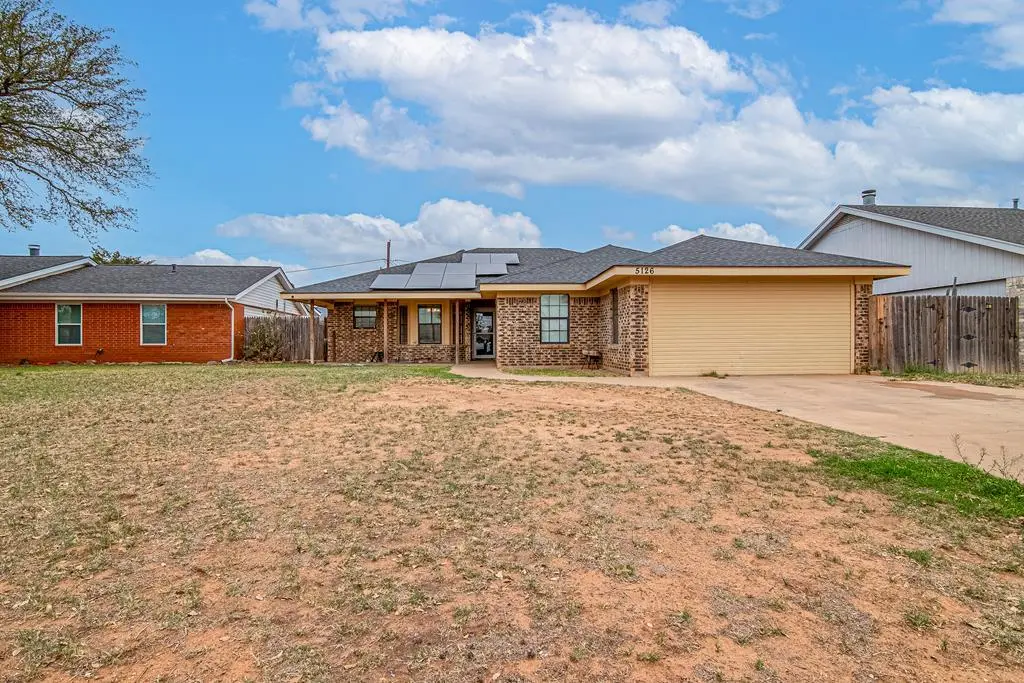
5126 Reeves Cir · Midland, TX
Flood risk 1/10 · Minimal
- FEMA flood zone
- X
- Chance of flooding over 30 yrs
- 0.0%
- Est. flood insurance / yr
- $507 – $1,088
Fire risk 8/10 · Major
- Est. fire insurance / yr
- $1,222 – $2,270
Heat risk 6/10 · Moderate
- Hot days now (above 102°F)
- 7 days/yr
- Hot days in 30 yrs
- 21 days/yr
Wind risk 2/10 · Minimal
- Chance of severe wind over 30 yrs
- 4.0%
Air-quality risk 1/10 · Minimal
- Unhealthy air days now
- 0 days/yr
- Unhealthy air days in 30 yrs
- 0 days/yr
Risk factors via First Street. Map © Google.
Why this score? — see what drove the D grade
The composite is a weighted blend of 9 inputs, each scored 0–100. Each bar is that input's sub-score; the figure is the points it added to the 100-point composite (weight × sub-score).
- Cash flow +15.7/30.0
- ARV discount +5.9/15.0
- DSCR +4.8/10.0
- Livability +4.0/5.0
- 1% rule +3.9/10.0
- Schools +3.2/10.0
- Condition / age +2.5/5.0
- Rent growth +2.4/5.0
- Appreciation +0.0/10.0
$300,000
🖨 Deal sheet (PDF) 📄 Offer letter ✓ Due diligence
Listing remarks MLS
Home equipped with solar panels and a Vivint Security system installed. Spacious Layout with open kitchen and dinning area. Located in Western Hills and ready for its next owner. Interior photos coming soon. Showings begin March 9th.
Key facts
- Dining area
- Solar panels
- Open kitchen
Tags
Neighborhood map
What this means for you Summary
Snapshot
- This is a 5-bed/3.0-bath single-family listed at $300k.
Deal economics
- At list price, monthly cash flow is $130 ($2k/yr) — positive.
- The deal already cash-flows at list — no discount required.
- To meet the 1% rule (rent ≥ 1% of price), the offer needs to be $268k (10.7% below list).
- Recommended offer: $268k (10.7% below list) — sets the bar for 1% rule.
- Cap rate 6.8% vs local median 4.7% in Midland — top-decile yield for the area; either an underpriced asset or a hidden risk that comps aren't pricing in. Stress-test before assuming the spread holds.
Location & tenants
- Location reads 79/100 on livability (#57 in TX, #2,192 nationally) — a middle-class / working-renter tenant base. Strengths: employment A+, housing A+, health & safety A+; Watch: crime C-, commute D+, amenities D.
- Midland ISD (urban): math 34% / reading 36% proficiency, ranked #477 of 826 in TX (top 58%) — families likely to look elsewhere, expect single-tenant / working-renter base with shorter leases.
- Zoned schools: Henderson El (math 42% / reading 27%, grade F, #1,995 of 4,322 statewide, top 50%, 491 students, 79% FRL); Goddard J H (math 23% / reading 32%, grade F, #1,156 of 1,662 statewide, top 71%, 1,024 students, 58% FRL, charter); Midland H S (math 37% / reading 7%, grade F, #1,366 of 1,632 statewide, top 84%, 2,492 students, 44% FRL).
- Market conditions: Rents soft (-0.3%/yr); 65 active listings in the ZIP; 7 comparable units currently listed for rent nearby; rentals lingering (median 46d on market — plan ~5-8 weeks vacancy on turnover, expect pricing pressure); 71% of comp listings sitting > 30 days — soft ceiling on asking rent; solid renter incomes; 1,504 units permitted in Midland County in 2024 (0 in 5+ unit buildings).
- This rent runs 42% of the median local income ($77k/yr) — at the standard rent-burdened threshold; future hikes will face affordability resistance.
Forward outlook
- Local home prices are declining (-3.0%/yr); year-one equity from $2k of loan paydown is wiped out by about $9k of value loss. Plan a longer hold.
- Midland County population projected at +83% by 2050 — long-run rental-demand tailwind backs the buy-and-hold thesis.
Negotiation context
- It's been on market 90 days — a 6% lower offer ($282k) is reasonable based on typical stale-listing flexibility.
- 3 sale attempts since 25y ago with the ask held roughly flat each time — persistent listings suggest the price (not the market) is what's stuck; bring a comps-based counter.
Risks & watch-outs
- Climate carrying-cost: severe wildfire risk; extreme-heat days projected 7→21/yr by 2055 (HVAC capex compounding) — expect insurance premiums to compound above CPI over the hold.
Questions for the listing agent
- It's been on market 90 days. Have you received any prior offers? Is the seller open to a 11% concession, seller financing, or rate buy-down credit?
- Why hasn't it sold? Are there any deal-killer items the seller is aware of (foundation, flood, title, zoning, code violations)?
- Is there a deadline driving the sale (1031 exchange, divorce, estate, relocation)? That informs how much negotiation room exists.
- The area grade is low — what's the realistic commute time and amenity access for the typical tenant pool here? Any planned neighborhood developments (good or bad) we should know about?
- What's the average days-on-market for RENTAL listings here right now (not sales)? A rising rental-DOM trend means longer vacancies and softer asking-rent achievability than the comps imply.
- What's the recent tenant-quality profile in this submarket — average credit score on applications, eviction rate, late-payment / NSF rate, and stable-employment percentage? A property-management company in the area should have these aggregated.
- How much new for-sale + rental construction is in the pipeline within 1–3 miles? Heavy new supply typically softens prices + rents 12–24 months out; constrained supply supports both.
Investment metrics
- 1% rule
- 0.89% ✗
- Cap rate
- 6.81%
- Cash-on-cash
- 1.86%
- DSCR
- 1.08
- GRM
- 9.3
CMA / ARV
- ARV (median comp)
- $289,651
- List price
- $300,000
- Delta
- 3.57%
- Verdict
- FAIR
- Comps
- 5 within 2.0 mi
Projected returns pro-forma
-3.0% appreciation · 0.0% rent growth · sell at horizon
- IRR
- -16.6%
- Equity multiple
- 0.43×
- Total profit
- $-48,199
- Equity at exit
- $44,731
- IRR
- -14.8%
- Equity multiple
- 0.27×
- Total profit
- $-61,701
- Equity at exit
- $25,939
Cash invested: $84,000 (down + closing). Projections, not guarantees.
Landlord ↔ Tenant lean methodology
- Overall (STATE)
- 87 Strongly Landlord-Friendly
- State Texas
- 87 Strongly Landlord-Friendly · R+5
- County
- — inherits STATE
- City
- — inherits STATE
ZIP-level market 79703
- Rents YoY
- -0.3%
- Active inventory
- 65
- Price-to-rent
- 9.3×
Monthly cashflow live
- Estimated rent
- $2,678 high interval (Pro) →
- Mortgage (P&I)
- −$1,573
- Tax from tax record
- −$288 /mo · $3,451/yr
- Insurance
- −$125
- HOA
- −$0
- Vacancy / Maint / Mgmt
- −$562
- Net cashflow
- $130
Break-even live
Sensitivity live
| Price | -10% $300 | -5% $215 | +0% $130 | +5% $45 | +10% $-40 |
|---|---|---|---|---|---|
| Rent | -10% $-82 | -5% $24 | +0% $130 | +5% $236 | +10% $342 |
| Rate | -1.0pp $281 | -0.5pp $206 | base $130 | +0.5pp $52 | +1.0pp $-27 |
UW: 25.0% down · 7.5% · 30yr · 1.5% tax · 5.0% vac · 8.0% maint · 8.0% mgmt
Financing live
Cash to close
- Down payment
- $75,000
- Closing costs
- $9,000
- Reserves months
- —
- Total cash needed
- —
Loan-product check · same deal, 3 products live
Conventional
25% down · 7.5% · 30yr
- Down + closing
- —
- Monthly P&I
- —
- Monthly cashflow
- —
- DSCR
- —
- Eligible?
- —
Personal DTI + credit; lowest rate.
DSCR
20% down · 8.5% · 30yr
- Down + closing
- —
- Monthly P&I
- —
- Monthly cashflow
- —
- DSCR
- —
- Eligible?
- —
No personal income docs; deal must DSCR.
Hard money
10% down · 12.0% · 12mo
- Down + closing
- —
- Monthly P&I
- —
- Monthly cashflow
- —
- DSCR
- —
- Eligible?
- —
Short-term bridge; refi at stabilization.
Rent comps 7 comps
| Address | Beds | Baths | Sqft | Rent | $/sqft | DOM | Units | Dist |
|---|---|---|---|---|---|---|---|---|
| 5205 Blue Haven Dr Midland, TX | 4.0 | 2.0 | 1539 | $6,000 | $3.90 | 45d | 1 | 0.17mi |
| 4515 Monty Dr Midland, TX | 4.0 | 2.0 | 1853 | $2,400 | $1.30 | 45d | 1 | 0.87mi |
| 4317 Tanner Dr Unit A Midland, TX | 4.0 | 2.0 | 2220 | $2,650 | $1.19 | 23d | 1 | 1.02mi |
| 303 Koufax Ct Midland, TX | 4.0 | 2.0 | 2096 | $2,950 | $1.41 | 23d | 1 | 1.17mi |
| 3811 Cedar Spring Dr Midland, TX | 4.0 | 2.0 | 1500 | $2,600 | $1.73 | 45d | 1 | 1.35mi |
| 509 Wagner Dr Midland, TX | 4.0 | 2.0 | 2085 | $3,000 | $1.44 | 45d | 1 | 1.37mi |
| 6020 Spahn St Midland, TX | 4.0 | 2.0 | 1849 | $2,800 | $1.51 | 45d | 1 | 1.39mi |
Listing history 24 events
-
2026-06-22days on market $300,000 Active 90 DOM
-
2026-06-19days on market $300,000 Active 88 DOM
-
2026-06-18days on market $300,000 Active 87 DOM
-
2026-06-17days on market $300,000 Active 86 DOM
-
2026-06-16days on market $300,000 Active 85 DOM
-
2026-06-15days on market $300,000 Active 84 DOM
-
2026-06-14days on market $300,000 Active 82 DOM
-
2026-06-13days on market $300,000 Active 81 DOM
-
2026-06-10days on market $300,000 Active 79 DOM
-
2026-06-09days on market $300,000 Active 78 DOM
-
2026-06-08days on market $300,000 Active 77 DOM
-
2026-06-07days on market $300,000 Active 76 DOM
-
2026-06-03days on market $300,000 Active 72 DOM
-
2026-06-02days on market $300,000 Active 71 DOM
-
2026-06-01days on market $300,000 Active 70 DOM
-
2026-05-31days on market $300,000 Active 69 DOM
-
2026-05-30days on market $300,000 Active 68 DOM
-
2026-02-25$300,000 Active 233-char remark
Show marketing remark (233 chars)
Home equipped with solar panels and a Vivint Security system installed. Spacious Layout with open kitchen and dinning area. Located in Western Hills and ready for its next owner. Interior photos coming soon. Showings begin March 9th.
-
2019-03-19soldstatus
-
2019-03-18soldstatus 394-char remark
Show marketing remark (394 chars)
Big Family? Need Space? THIS IS IT!!!This expansive home has much to offer starting with a formal dining and living room featuring a wood burning fireplace, 5 bedrooms and 3 full baths. Sits in a quiet cul-de-sac. Home has been fully renovated. Granite countertops throughout. Immaculate home like new. AC and roof are less than 2 years old. Too many upgrades to list. Schedule a showing today!
-
2019-01-30$275,000 394-char remark
Show marketing remark (394 chars)
Big Family? Need Space? THIS IS IT!!!This expansive home has much to offer starting with a formal dining and living room featuring a wood burning fireplace, 5 bedrooms and 3 full baths. Sits in a quiet cul-de-sac. Home has been fully renovated. Granite countertops throughout. Immaculate home like new. AC and roof are less than 2 years old. Too many upgrades to list. Schedule a showing today!
-
2002-04-02soldstatus
-
2002-03-28soldstatus
-
2001-07-11$75,900
ⓘ Source: listings_history table (triggers on properties + properties_extension) + one-shot
backfill from property_details.listing_events for pre-trigger history.
Tax reassessment forecast TX · Resets to sale price
- Current annual tax
- $3,451 · $288/mo
- Projected year-2 tax
- $5,490 · $458/mo
- Expected delta
- +$2,039/yr (+$170/mo · 59.1%)
ⓘ Screening estimate from a state-policy table — verify with the county assessor before closing.
Climate risk First Street
- Flood 1/10 Low FEMA zone X · 0% chance over 30 yrs
- Wildfire 8/10 Severe
- Heat 6/10 Major 7 d/yr ≥102°F today · 21 d/yr by 30 yrs out
- Wind 2/10 Low 4% chance of damaging wind over 30 yrs
- Air quality 1/10 Low 0 unhealthy d/yr today · 0 by 30 yrs out
Nearby sold comps map
Loading sold comps map…
Walkable amenities ~0.75 mi
Loading nearby amenities…
Taxation est. · year 1
- Rental income
- $32,138
- − Mortgage interest
- −$16,805
- − Property taxes
- −$3,451
- − Insurance
- −$1,500
- − Repairs & maintenance
- −$2,571
- − Management
- −$2,571
- − Depreciation
- −$8,727
- Taxable loss
- −$3,487
- Est. tax savings @ 24.0%
- +$837
- After-tax cash flow
- $2,396/yr
For passive investors: Depreciation is non-cash, so a rental often shows a tax loss while cash-flowing — sheltering income. Rental losses are passive: they offset passive income freely, and up to $25,000/yr can offset ordinary (W-2) income if you actively participate and your MAGI is under $100k (phasing out to $0 by $150k); unused losses carry forward. On sale, claimed depreciation is recaptured at up to 25%, and gains may owe capital-gains tax (a 1031 exchange can defer both). Figures are a year-1 estimate at your 24.0% rate — not tax advice; consult a CPA.
Schools (NCES district)
- District
- Midland ISD
- NCES district ID
- 4830570
- Math proficiency
- 34% ▼ -7.00%
- Reading proficiency
- 36% ▬ 0.00%
- Median HH income
- $63,457
- Composite
- 31.63/100
- National rank
- #5938
- State rank
- #477 of 826 in TX
Livability — Midland
- Score
- 79/100
- State rank
- #57
- US rank
- #2192
Category grades
Schools grade is shown separately in the Schools card above.
Census & demographics
- Census place
- Midland, TX
- County
- Midland County · 168,494 people
- City population
- 168,494
- Metro
- Midland, TX
- Population (ZIP)
- 20,419
- Household income
- $77,285
- Rent vs Own
- Severe rent burden
- 417.0
Population outlook (Midland County) Hauer SSP2
- Today (2025)
- 220,895 people
- By 2030
- 253,667 · +14.8%
- By 2040
- 325,498 · +47.4%
- By 2050
- 404,168 · +83.0%
- By 2075
- 609,802 · +176.1%
- By 2100
- 760,172 · +244.1%
Race, ethnicity, and origin ACS 2023
- Neighborhood character
- Diverse neighborhood (Simpson 0.59)
- Race & ethnicity
- Hispanic / Latino 54% White 34% Two or more races 16% Black 8% Asian 2%
- Hispanic origin (detail)
- Mexican 45% Cuban 4%
- Common ancestry
- Slovak 1% Italian 1% Serbian 1%
- Foreign-born
- 20% · Canada, Jamaica, Vietnam
- Languages at home
- 58% English-only · Spanish 38% Arabic 1% Chinese 1%
Political lean MEDSL · Midland
- 2024 margin
- Solid R (+60.5) · D 19.3% · R 79.8%
- 2008→2024 swing
- -3.3pp toward R · 2008: -57.3pp · 2024: -60.5pp
- All cycles
- 2024: R+60.5 2020: R+56.6 2016: R+55.2 2012: R+61.5 2008: R+57.3
Not yet ingested
- Civics
- —
Market trends
- HPI YoY
- ▼ -250.72%
- Current HPI
- 224.6222
- Rent YoY
- ▼ -0.33%
- Metro
- Midland, TX
- State GDP YoY
- ▲ 3.95%
- F500 in state
- 110
Industry mix (Fortune 500 HQ in TX)
| Industry | F500 HQs | Revenue |
|---|---|---|
| Energy | 16 | $1,198B |
|
||
| Technology | 5 | $198B |
|
||
| Engineering / Construction | 4 | $72B |
|
||
| Energy Services | 3 | $60B |
|
||
| Utilities | 3 | $41B |
|
||
| Healthcare | 2 | $330B |
|
||
Price history
+295.3% since first listed7 events — show timeline
- 2026-02-25 Listed $300,000 PBBOR
- 2019-03-19 Sold (Public Records) — Public Records
- 2019-03-18 Sold (MLS) — ODMLS
- 2019-01-30 Listed $275,000 ODMLS
- 2002-04-02 Sold (Public Records) — Public Records
- 2002-03-28 Sold (MLS) — ODMLS
- 2001-07-11 Listed $75,900 ODMLS
Property tax history
+0.5%/yrLatest (2025): $3,451 · -6.2% YoY. Source: county tax records.
Cash-flow waterfall
monthlySold comps — $/sqft
last 12 mo · ≤1 miLoading sold comps…