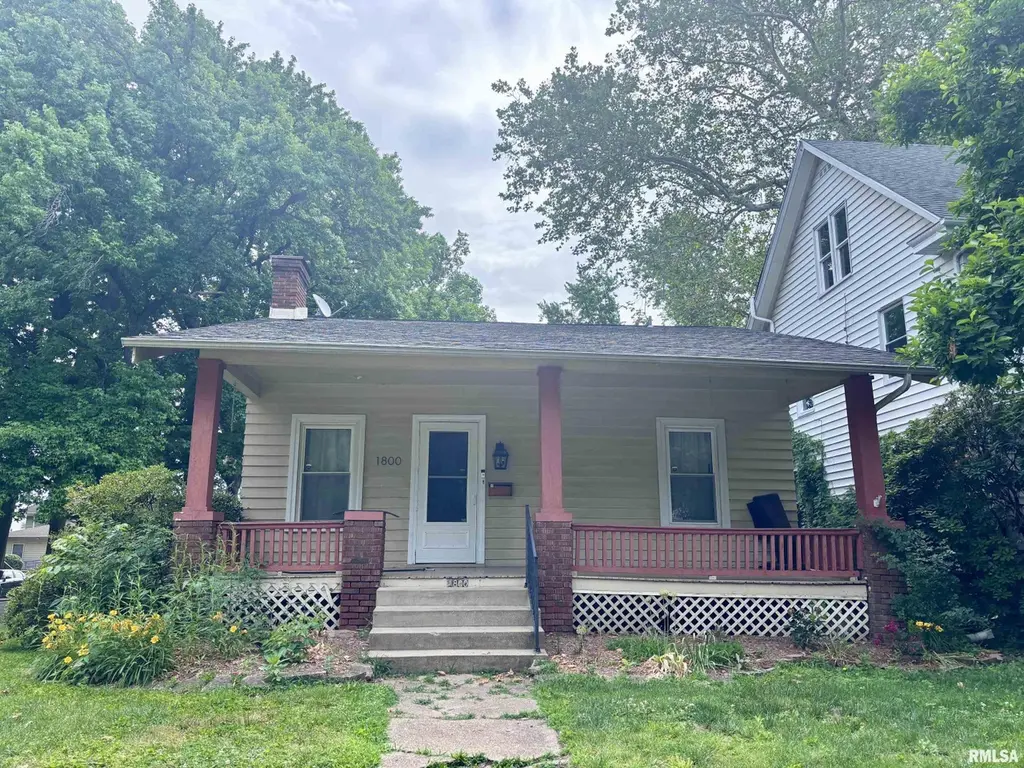
1800 S 4th St · Springfield, IL
Flood risk 1/10 · Minimal
- FEMA flood zone
- X (unshaded)
- Chance of flooding over 30 yrs
- 0.0%
- Est. flood insurance / yr
- $473 – $860
Fire risk 1/10 · Minimal
- Est. fire insurance / yr
- $804 – $1,492
Heat risk 4/10 · Minor
- Hot days now (above 105°F)
- 7 days/yr
- Hot days in 30 yrs
- 20 days/yr
Wind risk 2/10 · Minimal
- Chance of severe wind over 30 yrs
- 2.0%
Air-quality risk 2/10 · Minimal
- Unhealthy air days now
- 1 days/yr
- Unhealthy air days in 30 yrs
- 2 days/yr
Risk factors via First Street. Map © Google.
Why this score? — see what drove the B- grade
The composite is a weighted blend of 9 inputs, each scored 0–100. Each bar is that input's sub-score; the figure is the points it added to the 100-point composite (weight × sub-score).
- Cash flow +26.9/30.0
- DSCR +9.3/10.0
- 1% rule +8.3/10.0
- ARV discount +7.5/15.0
- Rent growth +5.0/5.0
- Livability +4.0/5.0
- Condition / age +2.5/5.0
- Schools +1.7/10.0
- Appreciation +0.0/10.0
$100,000
🖨 Deal sheet 📄 Offer letter ✓ Due diligence
Listing remarks MLS
Easy bungalow for a new owner! Well cared for corner lot home w small fenced backyard, 3 bedrooms, 1 bath. Kitchen and bath updated w tile floor- SS Appliances stay - even Washer & Dryer. Large kitchen pantry a huge plus! HW floors in bedrms & under carpet. New Roof & garage in 2012/13. Radon mitigation system in full bsement. Selling AS-IS BUT home has been pre-inpsected AND seller offering 13 mo Home Warranty! Cute home ready for new owner.
Key facts
- Full basement
- New roof
- Dining room ceiling
Tags
Property features AI
Exterior
- Parking: Detached 1-car garage
- Utilities: Public water; Public sewer
- Home design: Single-family residence; Built in 1947
- Construction: Shingle roof; Unfinished basement
- Exterior features: Fenced yard; Corner lot
Interior
- Kitchen: Dishwasher; Refrigerator
- Bedrooms: 3 bedrooms total; Main-level bedroom: 13 x 11.3 ft, hardwood flooring, egress window; Main-level bedroom: 9.8 x 9.1 ft, carpet, egress window; Main-level bedroom: 11.1 x 10.1 ft, hardwood flooring, egress window
- Flooring: Hardwood in some bedrooms; Carpet in living areas and some rooms; Tile in kitchen
- Bathrooms: 1 full bathroom
- Heating & cooling: Forced air heat; Central air conditioning
- Interior features: Radon mitigation system; Wood-burning fireplace (1)
- Laundry & utility: Washer; Dryer; Laundry room in basement
Neighborhood map
What this means for you Summary
Snapshot
- This is a 3-bed/1.0-bath single-family listed at $100k.
Deal economics
- At list price, monthly cash flow is $277 ($3k/yr) — positive.
- The deal already cash-flows at list — no discount required.
- Meets the 1% rule at list price ($1k rent vs $100k).
- Cap rate 9.6% vs local median 4.9% in Springfield — top-decile yield for the area; either an underpriced asset or a hidden risk that comps aren't pricing in. Stress-test before assuming the spread holds.
Location & tenants
- Location reads 79/100 on livability (#122 in IL, #2,138 nationally) — a middle-class / working-renter tenant base. Strengths: amenities A+, commute A+, cost of living A+; Watch: schools D+, crime F.
- Springfield SD 186 (urban): math 17% / reading 22% proficiency, ranked #438 of 620 in IL (top 71%) — low school quality limits family demand, transient renter base, plan for 1-2y turnover; 64% free/reduced lunch — lower-income household profile, screen leases tightly.
- Market conditions: Rents rising fast (+12.2%/yr); 107 active listings in the ZIP; 20 comparable units currently listed for rent nearby; rentals lingering (median 44d on market — plan ~5-8 weeks vacancy on turnover, expect pricing pressure); 70% of comp listings sitting > 30 days — soft ceiling on asking rent; 225 units permitted in Sangamon County in 2024 (48 in 5+ unit buildings).
- This rent runs 35% of the median local income ($45k/yr) — at the standard rent-burdened threshold; future hikes will face affordability resistance.
Forward outlook
- Local home prices are declining (-3.0%/yr); year-one equity from $691 of loan paydown is wiped out by about $3k of value loss. Plan a longer hold.
- Sangamon County population projected to shrink 9% by 2050 — rents likely to lag national; underwrite the cash flow, not the appreciation.
- At projected returns (-3.0% appreciation + 8.0% rent growth), your $28k cash investment doubles in ~7 years — after that, you're playing with house money.
Negotiation context
- Only 11 days on market — expect competitive offers; lowballing is unlikely to land.
- 4 sale attempts since 30y ago with the ask held roughly flat each time — persistent listings suggest the price (not the market) is what's stuck; bring a comps-based counter.
Risks & watch-outs
- Watch-outs: built in 1947 — expect roof / HVAC / electrical / plumbing capex.
Questions for the listing agent
- Built in 1947 — when were the roof, HVAC, electrical panel, plumbing, and water heater last replaced?
- Is there a deadline driving the sale (1031 exchange, divorce, estate, relocation)? That informs how much negotiation room exists.
- Schools are D-rated, which usually means shorter tenancies and higher turnover. Who's the typical renter profile here, and what's been the actual vacancy rate?
- Crime grade is F in this area — have there been break-ins, vandalism, or insurance claims at this property in the last 3 years? What carrier currently insures it and at what premium?
- What's the average days-on-market for RENTAL listings here right now (not sales)? A rising rental-DOM trend means longer vacancies and softer asking-rent achievability than the comps imply.
- What's the recent tenant-quality profile in this submarket — average credit score on applications, eviction rate, late-payment / NSF rate, and stable-employment percentage? A property-management company in the area should have these aggregated.
- How much new for-sale + rental construction is in the pipeline within 1–3 miles? Heavy new supply typically softens prices + rents 12–24 months out; constrained supply supports both.
Investment metrics
- 1% rule
- 1.33% ✓
- Cap rate
- 9.62%
- Cash-on-cash
- 11.89%
- DSCR
- 1.53
- GRM
- 6.3
CMA / ARV
- ARV (on-the-fly)
- $99,996
- Comps found
- 12
Show comp detail 12 sales within ~0.75 mi
| Address | Dist | Beds/Ba | Sqft | Sold | Price | $/sf | Match |
|---|---|---|---|---|---|---|---|
| 2001 S Spring St | 0.32mi | 4/2.0 (+1) | 1,282 (0%) | 1mo | $100,000 | $78 | 76 |
| 9 Ruth Ct | 0.35mi | 3/1.0 | 1,223 (-5%) | 5mo | $93,000 | $76 | 72 |
| 49 Ruth Ct | 0.39mi | 2/1.0 (-1) | 1,260 (-2%) | 5mo | $98,000 | $78 | 70 |
| 1124 Laurel St | 0.59mi | 3/1.0 | 1,331 (+4%) | 2mo | $65,000 | $49 | 64 |
| 1620 S 8th St | 0.36mi | 3/1.0 | 1,128 (-12%) | 4mo | $35,000 | $31 | 60 |
| 1927 S 13th St | 0.66mi | 3/2.0 | 1,305 (+2%) | 4mo | $47,500 | $36 | 58 |
| 1942 S 11th St | 0.55mi | 3/1.0 | 1,170 (-9%) | 2mo | $42,000 | $36 | 58 |
| 2128 S Lowell Ave | 0.61mi | 4/2.0 (+1) | 1,319 (+3%) | 2mo | $160,000 | $121 | 57 |
| 512 Broad Pl | 0.44mi | 2/1.0 (-1) | 1,450 (+13%) | 1mo | $119,900 | $83 | 52 |
| 2241 S 12th St | 0.72mi | 3/1.0 | 1,200 (-6%) | 5mo | $89,900 | $75 | 52 |
| 443 W Vine St | 0.70mi | 2/1.0 (-1) | 1,164 (-9%) | 3mo | $123,000 | $106 | 45 |
| 2501 S College St | 0.67mi | 3/2.0 | 1,473 (+15%) | 1mo | $159,900 | $109 | 39 |
Match score weights: distance 35% · size 25% · config 20% · recency 20%. Top-matched comps best support the ARV.
Projected returns pro-forma
-3.0% appreciation · 8.0% rent growth · sell at horizon
- IRR
- 7.3%
- Equity multiple
- 1.30×
- Total profit
- $8,533
- Equity at exit
- $14,910
- IRR
- 20.9%
- Equity multiple
- 3.23×
- Total profit
- $62,332
- Equity at exit
- $8,646
Cash invested: $28,000 (down + closing). Projections, not guarantees.
Landlord ↔ Tenant lean methodology
- Overall (STATE)
- 43 Moderately Tenant-Leaning
- State Illinois
- 43 Moderately Tenant-Leaning · D+7
- County
- — inherits STATE
- City
- — inherits STATE
ZIP-level market 62703
- Home prices YoY
- -28.9%
- Rents YoY
- 12.2%
- Active inventory
- 107
- Price-to-rent
- 6.3×
Monthly cashflow live
- Estimated rent
- $1,325 high interval (Pro) →
- Mortgage (P&I)
- −$524
- Tax from tax record
- −$204 /mo · $2,443/yr
- Insurance
- −$42
- HOA
- −$0
- Vacancy / Maint / Mgmt
- −$278
- Net cashflow
- $277
Break-even live
UW: 25.0% down · 7.5% · 30yr · 1.5% tax · 5.0% vac · 8.0% maint · 8.0% mgmt
Financing live
Cash to close
- Down payment
- $25,000
- Closing costs
- $3,000
- Reserves months
- —
- Total cash needed
- —
Loan-product check · same deal, 3 products live
Conventional
25% down · 7.5% · 30yr
- Down + closing
- —
- Monthly P&I
- —
- Monthly cashflow
- —
- DSCR
- —
- Eligible?
- —
Personal DTI + credit; lowest rate.
DSCR
20% down · 8.5% · 30yr
- Down + closing
- —
- Monthly P&I
- —
- Monthly cashflow
- —
- DSCR
- —
- Eligible?
- —
No personal income docs; deal must DSCR.
Hard money
10% down · 12.0% · 12mo
- Down + closing
- —
- Monthly P&I
- —
- Monthly cashflow
- —
- DSCR
- —
- Eligible?
- —
Short-term bridge; refi at stabilization.
Rent comps 20 comps
| Address | Beds | Baths | Sqft | Rent | $/sqft | DOM | Units | Dist |
|---|---|---|---|---|---|---|---|---|
| 1726 S 6th St Springfield, IL | 3.0 | 1.5 | 1408 | $1,500 | $1.07 | 43d | 1 | 0.18mi |
| 1933 S 2nd St Springfield, IL | 4.0 | 2.0 | 1433 | $1,400 | $0.98 | 43d | 1 | 0.22mi |
| 1600 S 6th St Unit 1 Springfield, IL | 3.0 | 2.0 | 1100 | $1,250 | $1.14 | 20d | 1 | 0.25mi |
| 525 E Pine St Unit 4 Springfield, IL | 2.0 | 2.0 | 1250 | $1,200 | $0.96 | 20d | 1 | 0.31mi |
| 525 E Pine St Springfield, IL | 2.0 | 2.0 | 1250 | $1,200 | $0.96 | 43d | 1 | 0.31mi |
| 1501 S Spring St Springfield, IL | 2.0 | 1.0 | 1000 | $1,000 | $1.00 | 20d | 1 | 0.34mi |
| 1214 S 7th St Unit C Springfield, IL | 3.0 | 1.0 | 1200 | $1,350 | $1.12 | 43d | 1 | 0.53mi |
| 2257 S 10th St Springfield, IL | 2.0 | 1.0 | 1100 | $1,150 | $1.05 | 43d | 1 | 0.61mi |
| 229 W Allen St Springfield, IL | 3.0 | 1.5 | 1050 | $1,305 | $1.24 | 20d | 1 | 0.63mi |
| 1213 E Ash St Springfield, IL | 3.0 | 2.0 | 1861 | $2,030 | $1.09 | 20d | 1 | 0.65mi |
| 2328 S 10th St Springfield, IL | 3.0 | 1.0 | 1100 | $1,200 | $1.09 | 43d | 1 | 0.70mi |
| 1104 S 11th St Unit A Springfield, IL | 3.0 | 1.0 | 1200 | $1,000 | $0.83 | 43d | 1 | 0.78mi |
| 423 W Lawrence Ave Unit 2 Springfield, IL | 2.0 | 1.0 | 900 | $1,050 | $1.17 | 20d | 1 | 0.98mi |
| 1929 E Spruce St Springfield, IL | 3.0 | 1.0 | 1500 | $1,300 | $0.87 | 43d | 1 | 1.21mi |
| 2005 E Laurel St Springfield, IL | 2.0 | 1.0 | 900 | $1,000 | $1.11 | 43d | 1 | 1.27mi |
| 8 S Old State Capitol Plz Unit 1031831P Springfield, IL | 2.0 | 2.0 | 990 | $2,927 | $2.96 | 43d | 1 | 1.28mi |
| 2715 S MacArthur Blvd Unit 01 Springfield, IL | 2.0 | 1.5 | 935 | $975 | $1.04 | 43d | 1 | 1.35mi |
| 922 Governor St Springfield, IL | 3.0 | 1.0 | 1682 | $1,200 | $0.71 | 43d | 1 | 1.39mi |
| 6 Ridge Ct Springfield, IL | 3.0 | 1.0 | 905 | $1,350 | $1.49 | 43d | 1 | 1.40mi |
| 400 E Jefferson St Springfield, IL | 2.0 | 1.0 | 1420 | $1,220 | $0.86 | 43d | 1 | 1.42mi |
Listing history 10 events
-
2026-06-19days on market $100,000 Active 11 DOM
-
2026-06-18days on market $100,000 Active 10 DOM
-
2026-06-17days on market $100,000 Active 9 DOM
-
2026-06-16days on market $100,000 Active 8 DOM
-
2026-06-15days on market $100,000 Active 7 DOM
-
2026-06-14days on market $100,000 Active 5 DOM
-
2026-06-13days on market $100,000 Active 4 DOM
-
2026-06-10days on market $100,000 Active 2 DOM
-
2026-06-09remarks 543-char remark
-
2026-06-09$100,000 Active 1 DOM
ⓘ Source: listings_history table (triggers on properties + properties_extension) + one-shot
backfill from property_details.listing_events for pre-trigger history.
Tax reassessment forecast IL · Partial reset (capped growth)
- Current annual tax
- $2,443 · $204/mo
- Projected year-2 tax
- $2,443 · $204/mo
- Expected delta
- $0/yr ($0/mo · 0.0%)
ⓘ Screening estimate from a state-policy table — verify with the county assessor before closing.
Climate risk First Street
- Flood 1/10 Low FEMA zone X (unshaded) · 0% chance over 30 yrs
- Wildfire 1/10 Low
- Heat 4/10 Moderate 7 d/yr ≥105°F today · 20 d/yr by 30 yrs out
- Wind 2/10 Low 2% chance of damaging wind over 30 yrs
- Air quality 2/10 Low 1 unhealthy d/yr today · 2 by 30 yrs out
Nearby sold comps map
Loading sold comps map…
Walkable amenities ~0.75 mi
Loading nearby amenities…
Taxation est. · year 1
- Rental income
- $15,904
- − Mortgage interest
- −$5,602
- − Property taxes
- −$2,443
- − Insurance
- −$500
- − Repairs & maintenance
- −$1,272
- − Management
- −$1,272
- − Depreciation
- −$2,909
- Taxable income
- $1,906
- Est. tax owed @ 24.0%
- −$457
- After-tax cash flow
- $2,871/yr
For passive investors: Depreciation is non-cash, so a rental often shows a tax loss while cash-flowing — sheltering income. Rental losses are passive: they offset passive income freely, and up to $25,000/yr can offset ordinary (W-2) income if you actively participate and your MAGI is under $100k (phasing out to $0 by $150k); unused losses carry forward. On sale, claimed depreciation is recaptured at up to 25%, and gains may owe capital-gains tax (a 1031 exchange can defer both). Figures are a year-1 estimate at your 24.0% rate — not tax advice; consult a CPA.
Schools (NCES district)
- District
- Springfield SD 186
- NCES district ID
- 1737080
- Math proficiency
- 17% ▼ -7.00%
- Reading proficiency
- 22% ▼ -5.00%
- Median HH income
- $43,744
- Composite
- 16.89/100
- National rank
- #9142
- State rank
- #438 of 620 in IL
Livability — Springfield
- Score
- 79/100
- State rank
- #122
- US rank
- #2138
Category grades
Schools grade is shown separately in the Schools card above.
Census & demographics
- Census place
- Springfield, IL
- County
- Sangamon County · 115,414 people
- City population
- 59,955
- Metro
- Springfield, IL
- Population (ZIP)
- 28,922
- Household income
- $45,009
- Rent vs Own
- Severe rent burden
- 1626.0
Population outlook (Sangamon County) Hauer SSP2
- Today (2025)
- 198,317 people
- By 2030
- 196,127 · -1.1%
- By 2040
- 188,664 · -4.9%
- By 2050
- 179,624 · -9.4%
- By 2075
- 155,027 · -21.8%
- By 2100
- 122,588 · -38.2%
Race, ethnicity, and origin ACS 2023
- Neighborhood character
- Diverse neighborhood (Simpson 0.59)
- Race & ethnicity
- White 53% Black 35% Two or more races 7% Hispanic / Latino 5%
- Common ancestry
- Lithuanian 2% Romanian 2% Italian 1%
- Foreign-born
- 3% · Canada
- Languages at home
- 95% English-only · Spanish 3% Arabic 1%
Political lean MEDSL · Sangamon
- 2024 margin
- Toss-up / Even · D 46.6% · R 51.6% · Other 1.8%
- 2008→2024 swing
- -9.3pp toward R · 2008: 4.4pp · 2024: -5.0pp
- All cycles
- 2024: R+5.0 2020: R+4.4 2016: R+9.4 2012: R+8.7 2008: D+4.4
Not yet ingested
- Civics
- —
Market trends
- HPI YoY
- ▼ -59.69%
- Current HPI
- 147.0877
- Rent YoY
- ▲ 12.19%
- Metro
- Springfield, IL
- State GDP YoY
- ▲ 1.59%
- F500 in state
- 60
Industry mix (Fortune 500 HQ in IL)
| Industry | F500 HQs | Revenue |
|---|---|---|
| Insurance | 4 | $201B |
|
||
| Consumer Goods | 4 | $87B |
|
||
| Industrial Machinery | 3 | $64B |
|
||
| Healthcare | 2 | $55B |
|
||
| Retail / Pharmacy | 1 | $148B |
|
||
| Agriculture / Food | 1 | $86B |
|
||
Price history
+69.8% since first listed10 events — show timeline
- 2026-06-08 Listed $100,000 RMLSA as Distributed by MLS Grid
- 2015-07-15 Sold (Public Records) $87,000 Public Records
- 2015-07-10 Sold (MLS) $87,000 RMLSA as Distributed by MLS Grid
- 2015-03-27 Listed $87,000 RMLSA as Distributed by MLS Grid
- 2009-12-10 Sold (Public Records) $85,000 Public Records
- 2008-05-12 Sold (Public Records) $76,000 Public Records
- 2008-05-09 Sold (MLS) $76,000 RMLSA as Distributed by MLS Grid
- 2007-09-04 Listed $79,900 RMLSA as Distributed by MLS Grid
- 1997-05-02 Sold (MLS) $58,200 RMLSA as Distributed by MLS Grid
- 1996-10-23 Listed $58,900 RMLSA as Distributed by MLS Grid
Property tax history
+2.1%/yrLatest (2025): $2,443 · +4.9% YoY. Source: county tax records.
Cash-flow waterfall
monthlySold comps — $/sqft
last 12 mo · ≤1 miLoading sold comps…