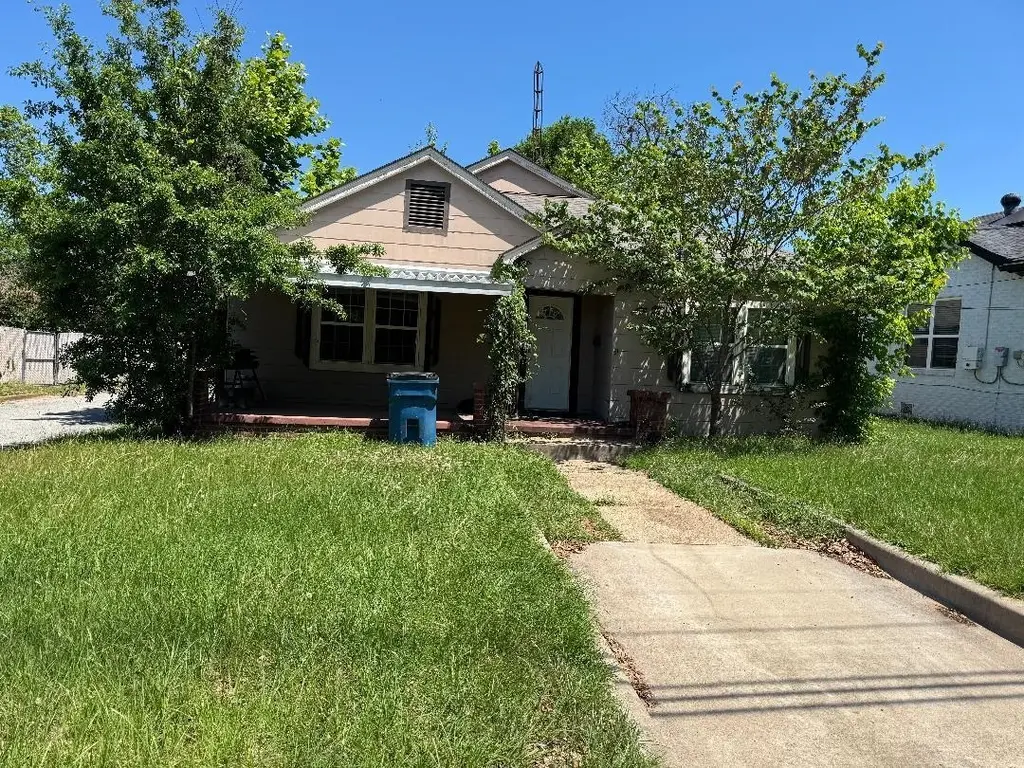
401 E Henderson St · Overton, TX
Flood risk 1/10 · Minimal
- FEMA flood zone
- X (unshaded)
- Chance of flooding over 30 yrs
- 0.0%
- Est. flood insurance / yr
- $507 – $1,088
Fire risk 5/10 · Moderate
- Est. fire insurance / yr
- $1,222 – $2,270
Heat risk 7/10 · Major
- Hot days now (above 109°F)
- 7 days/yr
- Hot days in 30 yrs
- 25 days/yr
Wind risk 6/10 · Moderate
- Chance of severe wind over 30 yrs
- 64.0%
Air-quality risk 2/10 · Minimal
- Unhealthy air days now
- 0 days/yr
- Unhealthy air days in 30 yrs
- 1 days/yr
Risk factors via First Street. Map © Google.
Why this score? — see what drove the B+ grade
The composite is a weighted blend of 9 inputs, each scored 0–100. Each bar is that input's sub-score; the figure is the points it added to the 100-point composite (weight × sub-score).
- Cash flow +28.1/30.0
- ARV discount +15.0/15.0
- DSCR +10.0/10.0
- 1% rule +8.1/10.0
- Appreciation +5.0/10.0
- Livability +3.5/5.0
- Schools +2.7/10.0
- Rent growth +2.5/5.0
- Condition / age +2.5/5.0
$105,000
🖨 Deal sheet 📄 Offer letter ✓ Due diligence
Listing remarks MLS
Vintage 3 bedroom, 1 bath home. CA/CH. Update throughout to include kitchen and bathroom. Spacious bedrooms and privacy fencing in backyard . l Short walking distance to schools and local business'. Call to view today!
Key facts
- 2 garage spots
- Built 1935
- Listed 46 days
Property features AI
Exterior
- Parking: 2-car garage; Concrete driveway; On-street parking available; Garage faces side
- Utilities: Public sewer
- Home design: Single-family residence; One level; Corner lot location
- Construction: Pillar/post/pier foundation
- Exterior features: Wood fencing; No pool; No other outbuildings
Interior
- Kitchen: Electric oven; Refrigerator; Dishwasher
- Bathrooms: 1 full bathroom
- Heating & cooling: Central electric heating
- Interior features: Wood-burning fireplace; 7 total rooms
- Laundry & utility: Washer and dryer; Electric water heater
Neighborhood map
What this means for you Summary
Snapshot
- This is a 3-bed/1.0-bath single-family listed at $105k.
Deal economics
- At list price, monthly cash flow is $330 ($4k/yr) — positive.
- The deal already cash-flows at list — no discount required.
- Meets the 1% rule at list price ($1k rent vs $105k).
- Recommended offer: $102k (3.0% below list) — sets the bar for market timing.
Location & tenants
- Location reads 69/100 on livability (#432 in TX) — a middle-class / working-renter tenant base. Strengths: cost of living A+, health & safety A+, crime A; Watch: schools D+, amenities F, commute F.
- Overton ISD (rural): math 31% / reading 32% proficiency, ranked #582 of 826 in TX (top 70%) — families likely to look elsewhere, expect single-tenant / working-renter base with shorter leases.
- Market conditions: 70 active listings in the ZIP; 1 comparable units currently listed for rent nearby; 4 units permitted in Rusk County in 2024 (0 in 5+ unit buildings).
Forward outlook
- In year one you build about $4k of equity ($726 loan paydown + $3k appreciation (3.0% local appreciation)).
- Rusk County population projected to shrink 5% by 2050 — rents likely to lag national; underwrite the cash flow, not the appreciation.
- At projected returns (3.0% appreciation + 3.0% rent growth), your $29k cash investment doubles in ~4 years — after that, you're playing with house money.
- By year 9, paydown + projected appreciation supports a ~$33k cash-out refi (75% LTV) — recoverable capital for the next deal without selling this one.
Negotiation context
- It's been on market 47 days — a 3% lower offer ($102k) is reasonable based on typical stale-listing flexibility.
- 3 sale attempts since 10y ago with the ask held roughly flat each time — persistent listings suggest the price (not the market) is what's stuck; bring a comps-based counter.
Risks & watch-outs
- Watch-outs: built in 1935 — expect roof / HVAC / electrical / plumbing capex.
- Climate carrying-cost: major wind risk, 64% chance of damaging wind over 30y; moderate wildfire risk; extreme-heat days projected 7→25/yr by 2055 (HVAC capex compounding) — expect insurance premiums to compound above CPI over the hold.
Questions for the listing agent
- It's been on market 47 days. Have you received any prior offers? Is the seller open to a 3% concession, seller financing, or rate buy-down credit?
- Built in 1935 — when were the roof, HVAC, electrical panel, plumbing, and water heater last replaced?
- Is there a deadline driving the sale (1031 exchange, divorce, estate, relocation)? That informs how much negotiation room exists.
- Schools are D-rated, which usually means shorter tenancies and higher turnover. Who's the typical renter profile here, and what's been the actual vacancy rate?
- What's the average days-on-market for RENTAL listings here right now (not sales)? A rising rental-DOM trend means longer vacancies and softer asking-rent achievability than the comps imply.
- What's the recent tenant-quality profile in this submarket — average credit score on applications, eviction rate, late-payment / NSF rate, and stable-employment percentage? A property-management company in the area should have these aggregated.
- How much new for-sale + rental construction is in the pipeline within 1–3 miles? Heavy new supply typically softens prices + rents 12–24 months out; constrained supply supports both.
Investment metrics
- 1% rule
- 1.31% ✓
- Cap rate
- 10.06%
- Cash-on-cash
- 13.46%
- DSCR
- 1.60
- GRM
- 6.4
CMA / ARV
- ARV (median comp)
- $147,427
- List price
- $105,000
- Delta
- -28.78%
- Verdict
- UNDERPRICED
- Comps
- 7 within 1.0 mi
Show comp detail 3 sales within ~0.75 mi
| Address | Dist | Beds/Ba | Sqft | Sold | Price | $/sf | Match |
|---|---|---|---|---|---|---|---|
| 406 E Henderston St | 0.04mi | 2/2.0 (-1) | 1,466 (+3%) | 15mo | $239,900 | $164 | 72 |
| 201 N Meadowbrook Dr | 0.63mi | 3/2.0 | 1,507 (+6%) | 4mo | $114,400 | $76 | 53 |
| 101 N Meadowbrook Dr | 0.62mi | 3/2.0 | 1,558 (+10%) | 1mo | $220,000 | $141 | 50 |
Match score weights: distance 35% · size 25% · config 20% · recency 20%. Top-matched comps best support the ARV.
Projected returns pro-forma
3.0% appreciation · 3.0% rent growth · sell at horizon
- IRR
- 20.1%
- Equity multiple
- 2.15×
- Total profit
- $33,686
- Equity at exit
- $47,213
- IRR
- 21.3%
- Equity multiple
- 4.08×
- Total profit
- $90,564
- Equity at exit
- $72,760
Cash invested: $29,400 (down + closing). Projections, not guarantees.
Landlord ↔ Tenant lean methodology
- Overall (STATE)
- 87 Strongly Landlord-Friendly
- State Texas
- 87 Strongly Landlord-Friendly · R+5
- County
- — inherits STATE
- City
- — inherits STATE
ZIP-level market 75684
- Active inventory
- 70
- Price-to-rent
- 6.4×
Monthly cashflow live
- Estimated rent
- $1,375 medium interval (Pro) →
- Mortgage (P&I)
- −$551
- Tax from tax record
- −$162 /mo · $1,946/yr
- Insurance
- −$44
- HOA
- −$0
- Vacancy / Maint / Mgmt
- −$289
- Net cashflow
- $330
Break-even live
UW: 25.0% down · 7.5% · 30yr · 1.5% tax · 5.0% vac · 8.0% maint · 8.0% mgmt
Financing live
Cash to close
- Down payment
- $26,250
- Closing costs
- $3,150
- Reserves months
- —
- Total cash needed
- —
Loan-product check · same deal, 3 products live
Conventional
25% down · 7.5% · 30yr
- Down + closing
- —
- Monthly P&I
- —
- Monthly cashflow
- —
- DSCR
- —
- Eligible?
- —
Personal DTI + credit; lowest rate.
DSCR
20% down · 8.5% · 30yr
- Down + closing
- —
- Monthly P&I
- —
- Monthly cashflow
- —
- DSCR
- —
- Eligible?
- —
No personal income docs; deal must DSCR.
Hard money
10% down · 12.0% · 12mo
- Down + closing
- —
- Monthly P&I
- —
- Monthly cashflow
- —
- DSCR
- —
- Eligible?
- —
Short-term bridge; refi at stabilization.
Rent comps 1 comps
| Address | Beds | Baths | Sqft | Rent | $/sqft | DOM | Units | Dist |
|---|---|---|---|---|---|---|---|---|
| 304 E Cottonwood St Overton, TX | 2.0 | 2.0 | 1210 | $1,375 | $1.14 | 21d | 1 | 0.26mi |
Listing history 25 events
-
2026-06-19days on market $105,000 Active 47 DOM
-
2026-06-18days on market $105,000 Active 46 DOM
-
2026-06-17days on market $105,000 Active 45 DOM
-
2026-06-16days on market $105,000 Active 44 DOM
-
2026-06-15days on market $105,000 Active 43 DOM
-
2026-06-14days on market $105,000 Active 41 DOM
-
2026-06-13days on market $105,000 Active 40 DOM
-
2026-06-10days on market $105,000 Active 38 DOM
-
2026-06-09days on market $105,000 Active 37 DOM
-
2026-06-08days on market $105,000 Active 36 DOM
-
2026-06-07days on market $105,000 Active 35 DOM
-
2026-06-03days on market $105,000 Active 31 DOM
-
2026-06-02days on market $105,000 Active 30 DOM
-
2026-06-01days on market $105,000 Active 29 DOM
-
2026-05-31days on market $105,000 Active 28 DOM
-
2026-05-30days on market $105,000 Active 27 DOM
-
2026-05-03$105,000 Active 129-char remark
-
2017-06-26soldstatus
-
2017-06-23soldstatus 219-char remark
Show marketing remark (229 chars)
Vintage 3 bedroom, 1 bath home. CA/CH. Updates throughout to include kitchen and bathroom. Spacious bedrooms and privacy fencing in backyard. Short walking distance to schools and local business. Call to view today! PRICE REDUCED
-
2017-06-23soldstatus
Show marketing remark (229 chars)
Vintage 3 bedroom, 1 bath home. CA/CH. Updates throughout to include kitchen and bathroom. Spacious bedrooms and privacy fencing in backyard. Short walking distance to schools and local business. Call to view today! PRICE REDUCED
-
2017-05-01$69,900 219-char remark
Show marketing remark (219 chars)
Vintage 3 bedroom, 1 bath home. CA/CH. Update throughout to include kitchen and bathroom. Spacious bedrooms and privacy fencing in backyard . l Short walking distance to schools and local business'. Call to view today!
-
2016-06-01$69,900
Show marketing remark (229 chars)
Vintage 3 bedroom, 1 bath home. CA/CH. Updates throughout to include kitchen and bathroom. Spacious bedrooms and privacy fencing in backyard. Short walking distance to schools and local business. Call to view today! PRICE REDUCED
-
2009-04-24soldstatus
-
1984-01-25soldstatus
-
1942-11-14soldstatus
ⓘ Source: listings_history table (triggers on properties + properties_extension) + one-shot
backfill from property_details.listing_events for pre-trigger history.
Tax reassessment forecast TX · Resets to sale price
- Current annual tax
- $1,946 · $162/mo
- Projected year-2 tax
- $1,946 · $162/mo
- Expected delta
- $0/yr ($0/mo · 0.0%)
ⓘ Screening estimate from a state-policy table — verify with the county assessor before closing.
Climate risk First Street
- Flood 1/10 Low FEMA zone X (unshaded) · 0% chance over 30 yrs
- Wildfire 5/10 Major
- Heat 7/10 Severe 7 d/yr ≥109°F today · 25 d/yr by 30 yrs out
- Wind 6/10 Major 64% chance of damaging wind over 30 yrs
- Air quality 2/10 Low 0 unhealthy d/yr today · 1 by 30 yrs out
Nearby sold comps map
Loading sold comps map…
Walkable amenities ~0.75 mi
Loading nearby amenities…
Taxation est. · year 1
- Rental income
- $16,500
- − Mortgage interest
- −$5,882
- − Property taxes
- −$1,946
- − Insurance
- −$525
- − Repairs & maintenance
- −$1,320
- − Management
- −$1,320
- − Depreciation
- −$3,055
- Taxable income
- $2,453
- Est. tax owed @ 24.0%
- −$589
- After-tax cash flow
- $3,368/yr
For passive investors: Depreciation is non-cash, so a rental often shows a tax loss while cash-flowing — sheltering income. Rental losses are passive: they offset passive income freely, and up to $25,000/yr can offset ordinary (W-2) income if you actively participate and your MAGI is under $100k (phasing out to $0 by $150k); unused losses carry forward. On sale, claimed depreciation is recaptured at up to 25%, and gains may owe capital-gains tax (a 1031 exchange can defer both). Figures are a year-1 estimate at your 24.0% rate — not tax advice; consult a CPA.
Schools (NCES district)
- District
- Overton ISD
- NCES district ID
- 4833870
- Math proficiency
- 31% ▼ -10.00%
- Reading proficiency
- 32% ▼ -5.00%
- Median HH income
- $48,386
- Composite
- 27.3/100
- National rank
- #7000
- State rank
- #582 of 826 in TX
Livability — Overton
- Score
- 69/100
- State rank
- #432
- US rank
- #8906
Category grades
Schools grade is shown separately in the Schools card above.
Census & demographics
- Census place
- Overton, TX
- Population (ZIP)
- 7,655
Population outlook (Rusk County) Hauer SSP2
- Today (2025)
- 52,498 people
- By 2030
- 52,093 · -0.8%
- By 2040
- 50,866 · -3.1%
- By 2050
- 49,696 · -5.3%
- By 2075
- 48,583 · -7.5%
- By 2100
- 43,265 · -17.6%
Race, ethnicity, and origin ACS 2023
- Neighborhood character
- Majority White (63%)
- Race & ethnicity
- White 63% Hispanic / Latino 20% Two or more races 15% Black 11%
- Hispanic origin (detail)
- Mexican 15% Puerto Rican 2%
- Common ancestry
- Italian 2% Lithuanian 2% Slovak 1%
- Foreign-born
- 6% · Canada
- Languages at home
- 86% English-only · Spanish 13%
Political lean MEDSL · Rusk
- 2024 margin
- Solid R (+59.4) · D 20.0% · R 79.4%
- 2008→2024 swing
- -13.2pp toward R · 2008: -46.3pp · 2024: -59.4pp
- All cycles
- 2024: R+59.4 2020: R+55.7 2016: R+56.5 2012: R+51.1 2008: R+46.3
Not yet ingested
- Civics
- —
Market trends
- HPI YoY
- —
- Current HPI
- —
- Rent YoY
- —
- Metro
- —
- State GDP YoY
- ▲ 3.95%
- F500 in state
- 110
Industry mix (Fortune 500 HQ in TX)
| Industry | F500 HQs | Revenue |
|---|---|---|
| Energy | 16 | $1,198B |
|
||
| Technology | 5 | $198B |
|
||
| Engineering / Construction | 4 | $72B |
|
||
| Energy Services | 3 | $60B |
|
||
| Utilities | 3 | $41B |
|
||
| Healthcare | 2 | $330B |
|
||
Price history
+50.2% since first listed9 events — show timeline
- 2026-05-03 Listed $105,000 LAAR
- 2017-06-26 Sold (Public Records) — Public Records
- 2017-06-23 Sold (MLS) — LAAR
- 2017-06-23 Sold (MLS) — GTAR
- 2017-05-01 Listed $69,900 GTAR
- 2016-06-01 Listed $69,900 LAAR
- 2009-04-24 Sold (Public Records) — Public Records
- 1984-01-25 Sold (Public Records) — Public Records
- 1942-11-14 Sold (Public Records) — Public Records
Property tax history
+4.3%/yrLatest (2025): $1,946 · +3.4% YoY. Source: county tax records.
Cash-flow waterfall
monthlySold comps — $/sqft
last 12 mo · ≤1 miLoading sold comps…