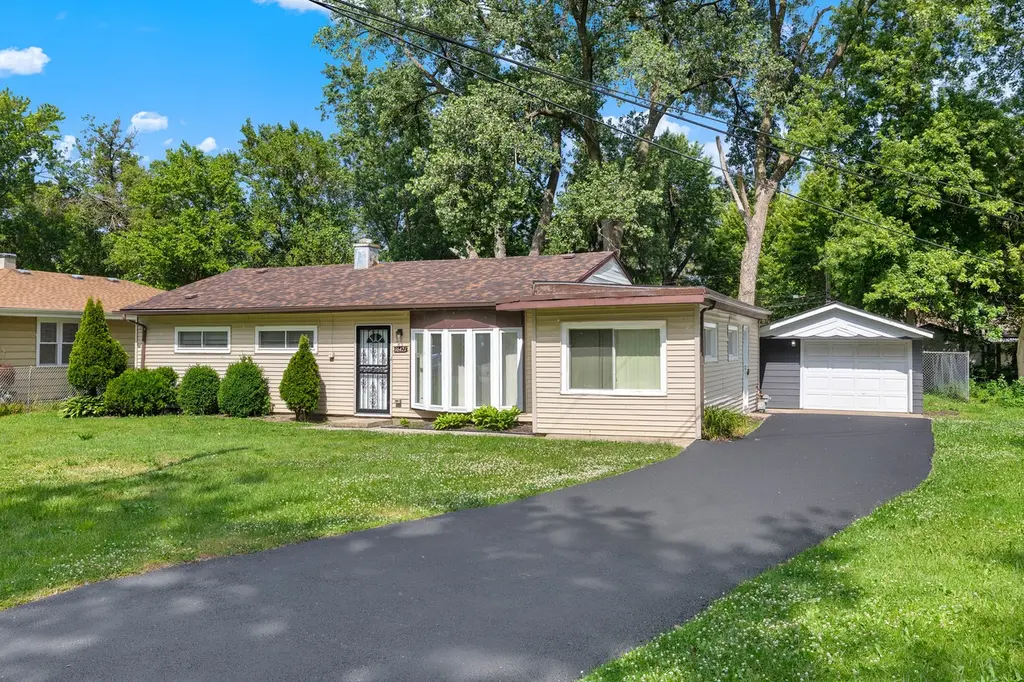
16421 Saint Louis Ave · Markham, IL
Flood risk 1/10 · Minimal
- FEMA flood zone
- X (unshaded)
- Chance of flooding over 30 yrs
- 0.0%
- Est. flood insurance / yr
- $473 – $860
Fire risk 1/10 · Minimal
- Est. fire insurance / yr
- $804 – $1,492
Heat risk 3/10 · Minor
- Hot days now (above 101°F)
- 7 days/yr
- Hot days in 30 yrs
- 15 days/yr
Wind risk 2/10 · Minimal
- Chance of severe wind over 30 yrs
- —
Air-quality risk 3/10 · Minor
- Unhealthy air days now
- 4 days/yr
- Unhealthy air days in 30 yrs
- 4 days/yr
Risk factors via First Street. Map © Google.
Why this score? — see what drove the C- grade
The composite is a weighted blend of 9 inputs, each scored 0–100. Each bar is that input's sub-score; the figure is the points it added to the 100-point composite (weight × sub-score).
- Cash flow +18.3/30.0
- Appreciation +10.0/10.0
- 1% rule +7.0/10.0
- DSCR +5.8/10.0
- Livability +3.8/5.0
- Rent growth +2.5/5.0
- Condition / age +2.5/5.0
- ARV discount +1.8/15.0
- Schools +1.5/10.0
$198,000
🖨 Deal sheet 📄 Offer letter ✓ Due diligence
Listing remarks MLS
Come see this 3 Bedroom 1 Bath Ranch on quiet tree lined street. Sunny Living Room and large eat in kitchen. Brick Paver Patio, Large yard and detached garage. Washer, dryer hook-up. Recently updated bathroom and Brand new roof 2021!
Key facts
- Renovated bathrooms
- New driveway
- Renovated kitchen
Tags
Property features AI
Finance
- Other: Fee simple ownership; School bus service and interstate access nearby
- HOA & community: No master association fee required
Exterior
- Parking: Detached garage (garage owned); Asphalt parking; 1 garage space, 1 total parking space
- Utilities: Lake Michigan water source; Public sewer
- Home design: Detached single-family home; One-story
- Construction: Frame construction; Property built before 1978; Rehabilitation completed in 2026
- Exterior features: Approximately 0.25–0.49 acre lot; Lot dimensions listed as 11994
Interior
- Kitchen: Kitchen on main level
- Bedrooms: 4 bedrooms (all on the main level); Master bedroom with full bath
- Flooring: Luxury vinyl flooring throughout main living areas
- Bathrooms: 2 full bathrooms; Separate shower and soaking tub in bath
- Heating & cooling: Forced air heating; Central air conditioning
- Interior features: First-floor bedroom; First-floor full bathroom; Eight total rooms; Drapes, screens and window treatments
- Laundry & utility: Main-level in-unit laundry
Neighborhood map
What this means for you Summary
Snapshot
- This is a 3-bed/1.0-bath single-family listed at $198k.
Deal economics
- At list price, monthly cash flow is $183 ($2k/yr) — positive.
- The deal already cash-flows at list — no discount required.
- Meets the 1% rule at list price ($2k rent vs $198k).
- Cap rate 7.4% vs local median 10.2% in Markham — below-typical yield; the buyer is paying a premium for something (appreciation thesis, condition, location) that the cap rate doesn't capture.
Location & tenants
- Location reads 76/100 on livability (#186 in IL, #3,539 nationally) — a middle-class / working-renter tenant base. Strengths: commute A+, cost of living A+, housing A+; Watch: crime D, amenities D, employment D.
- Bremen Chsd 228 (suburban): math 15% / reading 17% proficiency, ranked #468 of 620 in IL (top 76%) — low school quality limits family demand, transient renter base, plan for 1-2y turnover.
- Market conditions: 65 active listings in the ZIP; 4 comparable units currently listed for rent nearby; rentals leasing fast (median 8d on market — plan ~1-2 weeks tenant-placement turnaround); 6,272 units permitted in Cook County in 2024 (4,658 in 5+ unit buildings).
Forward outlook
- In year one you build about $21k of equity ($1k loan paydown + $20k appreciation (10.0% local appreciation)).
- At projected returns (10.0% appreciation + 3.0% rent growth), your $55k cash investment doubles in ~3 years — after that, you're playing with house money.
- By year 2, paydown + projected appreciation supports a ~$34k cash-out refi (75% LTV) — recoverable capital for the next deal without selling this one.
Negotiation context
- Only 1 days on market — expect competitive offers; lowballing is unlikely to land.
- 4 sale attempts since 13y ago with the ask held roughly flat each time — persistent listings suggest the price (not the market) is what's stuck; bring a comps-based counter.
Risks & watch-outs
- Watch-outs: property tax is 3.5% of price; built in 1955 — expect roof / HVAC / electrical / plumbing capex.
Questions for the listing agent
- Built in 1955 — when were the roof, HVAC, electrical panel, plumbing, and water heater last replaced?
- Property tax is high relative to price — has the assessment been appealed recently, and will the sale trigger a re-assessment?
- Is there a deadline driving the sale (1031 exchange, divorce, estate, relocation)? That informs how much negotiation room exists.
- Schools are F-rated, which usually means shorter tenancies and higher turnover. Who's the typical renter profile here, and what's been the actual vacancy rate?
- Crime grade is D in this area — have there been break-ins, vandalism, or insurance claims at this property in the last 3 years? What carrier currently insures it and at what premium?
- What's the average days-on-market for RENTAL listings here right now (not sales)? A rising rental-DOM trend means longer vacancies and softer asking-rent achievability than the comps imply.
- What's the recent tenant-quality profile in this submarket — average credit score on applications, eviction rate, late-payment / NSF rate, and stable-employment percentage? A property-management company in the area should have these aggregated.
- How much new for-sale + rental construction is in the pipeline within 1–3 miles? Heavy new supply typically softens prices + rents 12–24 months out; constrained supply supports both.
Investment metrics
- 1% rule
- 1.20% ✓
- Cap rate
- 7.40%
- Cash-on-cash
- 3.96%
- DSCR
- 1.18
- GRM
- 6.9
CMA / ARV
- ARV (on-the-fly)
- $175,576
- Comps found
- 12
Show comp detail 12 sales within ~0.75 mi
| Address | Dist | Beds/Ba | Sqft | Sold | Price | $/sf | Match |
|---|---|---|---|---|---|---|---|
| 16302 Trumbull Ave | 0.16mi | 3/1.0 | 1,260 (-2%) | 2mo | $139,900 | $111 | 87 |
| 16516 Turner Ave | 0.20mi | 3/1.0 | 1,200 (-7%) | 2mo | $70,000 | $58 | 78 |
| 16641 Sawyer Ave | 0.42mi | 4/1.5 (+1) | 1,260 (-2%) | 3mo | $188,000 | $149 | 67 |
| 16426 Homan Ave | 0.10mi | 3/3.0 | 1,419 (+10%) | 6mo | $190,000 | $134 | 66 |
| 16030 Saint Louis Ave | 0.48mi | 3/1.5 | 1,228 (-5%) | 3mo | $200,000 | $163 | 65 |
| 3417 W 161st St | 0.41mi | 3/1.0 | 1,413 (+10%) | 8mo | $77,500 | $55 | 59 |
| 17004 Central Park Ave | 0.74mi | 4/1.5 (+1) | 1,287 (-0%) | 1mo | $137,000 | $106 | 57 |
| 3425 Birchwood Dr | 0.63mi | 4/2.0 (+1) | 1,256 (-3%) | 1mo | $180,000 | $143 | 56 |
| 3737 Rose Manor Ter | 0.61mi | 2/1.0 (-1) | 1,210 (-6%) | 0mo | $165,000 | $136 | 56 |
| 3317 Birchwood Dr | 0.64mi | 3/1.5 | 1,223 (-5%) | 7mo | $189,000 | $155 | 53 |
| 16224 Kedzie Ave | 0.42mi | 3/1.5 | 1,476 (+14%) | 3mo | $127,000 | $86 | 52 |
| 17000 Magnolia Dr | 0.73mi | 4/2.0 (+1) | 1,184 (-8%) | 3mo | $265,000 | $224 | 41 |
Match score weights: distance 35% · size 25% · config 20% · recency 20%. Top-matched comps best support the ARV.
Projected returns pro-forma
10.0% appreciation · 3.0% rent growth · sell at horizon
- IRR
- 27.2%
- Equity multiple
- 3.16×
- Total profit
- $119,729
- Equity at exit
- $178,374
- IRR
- 23.8%
- Equity multiple
- 7.20×
- Total profit
- $343,893
- Equity at exit
- $384,670
Cash invested: $55,440 (down + closing). Projections, not guarantees.
Landlord ↔ Tenant lean methodology
- Overall (STATE)
- 43 Moderately Tenant-Leaning
- State Illinois
- 43 Moderately Tenant-Leaning · D+7
- County
- — inherits STATE
- City
- — inherits STATE
ZIP-level market 60428
- Home prices YoY
- 8.5%
- Active inventory
- 65
- Price-to-rent
- 6.9×
Monthly cashflow live
- Estimated rent
- $2,382 medium interval (Pro) →
- Mortgage (P&I)
- −$1,038
- Tax from tax record
- −$578 /mo · $6,933/yr
- Insurance
- −$82
- HOA
- −$0
- Vacancy / Maint / Mgmt
- −$500
- Net cashflow
- $183
Break-even live
UW: 25.0% down · 7.5% · 30yr · 1.5% tax · 5.0% vac · 8.0% maint · 8.0% mgmt
Financing live
Cash to close
- Down payment
- $49,500
- Closing costs
- $5,940
- Reserves months
- —
- Total cash needed
- —
Loan-product check · same deal, 3 products live
Conventional
25% down · 7.5% · 30yr
- Down + closing
- —
- Monthly P&I
- —
- Monthly cashflow
- —
- DSCR
- —
- Eligible?
- —
Personal DTI + credit; lowest rate.
DSCR
20% down · 8.5% · 30yr
- Down + closing
- —
- Monthly P&I
- —
- Monthly cashflow
- —
- DSCR
- —
- Eligible?
- —
No personal income docs; deal must DSCR.
Hard money
10% down · 12.0% · 12mo
- Down + closing
- —
- Monthly P&I
- —
- Monthly cashflow
- —
- DSCR
- —
- Eligible?
- —
Short-term bridge; refi at stabilization.
Rent comps 4 comps
| Address | Beds | Baths | Sqft | Rent | $/sqft | DOM | Units | Dist |
|---|---|---|---|---|---|---|---|---|
| 3900 171st St Country Club Hills, IL | 3.0 | 1.0 | 1750 | $2,250 | $1.29 | 7d | 1 | 1.00mi |
| 17306 Peach Grove Ln Hazel Crest, IL | 4.0 | 1.0 | 1034 | $2,700 | $2.61 | 1d | 1 | 1.25mi |
| 17306 Holmes Ave Hazel Crest, IL | 3.0 | 2.0 | 1535 | $2,195 | $1.43 | 4d | 1 | 1.33mi |
| 16450 Roy St Oak Forest, IL | 3.0 | 1.5 | 1500 | $2,400 | $1.60 | 17d | 1 | 1.41mi |
Listing history 2 events
-
2026-06-18remarks 683-char remark
-
2026-06-18$198,000 Active 1 DOM
ⓘ Source: listings_history table (triggers on properties + properties_extension) + one-shot
backfill from property_details.listing_events for pre-trigger history.
Tax reassessment forecast IL · Partial reset (capped growth)
- Current annual tax
- $6,933 · $578/mo
- Projected year-2 tax
- $6,933 · $578/mo
- Expected delta
- $0/yr ($0/mo · -0.0%)
ⓘ Screening estimate from a state-policy table — verify with the county assessor before closing.
Climate risk First Street
- Flood 1/10 Low FEMA zone X (unshaded) · 0% chance over 30 yrs
- Wildfire 1/10 Low
- Heat 3/10 Moderate 7 d/yr ≥101°F today · 15 d/yr by 30 yrs out
- Wind 2/10 Low
- Air quality 3/10 Moderate 4 unhealthy d/yr today · 4 by 30 yrs out
Nearby sold comps map
Loading sold comps map…
Walkable amenities ~0.75 mi
Loading nearby amenities…
Taxation est. · year 1
- Rental income
- $28,581
- − Mortgage interest
- −$11,091
- − Property taxes
- −$6,933
- − Insurance
- −$990
- − Repairs & maintenance
- −$2,286
- − Management
- −$2,286
- − Depreciation
- −$5,760
- Taxable loss
- −$766
- Est. tax savings @ 24.0%
- +$184
- After-tax cash flow
- $2,380/yr
For passive investors: Depreciation is non-cash, so a rental often shows a tax loss while cash-flowing — sheltering income. Rental losses are passive: they offset passive income freely, and up to $25,000/yr can offset ordinary (W-2) income if you actively participate and your MAGI is under $100k (phasing out to $0 by $150k); unused losses carry forward. On sale, claimed depreciation is recaptured at up to 25%, and gains may owe capital-gains tax (a 1031 exchange can defer both). Figures are a year-1 estimate at your 24.0% rate — not tax advice; consult a CPA.
Schools (NCES district)
- District
- Bremen Chsd 228
- NCES district ID
- 1707050
- Math proficiency
- 15% ▼ -4.00%
- Reading proficiency
- 17% ▼ -5.00%
- Median HH income
- $57,625
- Composite
- 15.32/100
- National rank
- #9327
- State rank
- #468 of 620 in IL
Livability — Markham
- Score
- 76/100
- State rank
- #186
- US rank
- #3539
Category grades
Schools grade is shown separately in the Schools card above.
Census & demographics
- Census place
- Markham, IL
- City population
- 10,980
- Population (ZIP)
- 10,980
Population outlook (Cook County) Hauer SSP2
- Today (2025)
- 5,347,519 people
- By 2030
- 5,357,703 · +0.2%
- By 2040
- 5,324,924 · -0.4%
- By 2050
- 5,230,762 · -2.2%
- By 2075
- 4,785,735 · -10.5%
- By 2100
- 4,188,836 · -21.7%
Race, ethnicity, and origin ACS 2023
- Neighborhood character
- Predominantly Black (69%)
- Race & ethnicity
- Black 69% Hispanic / Latino 17% White 11% Two or more races 4%
- Hispanic origin (detail)
- Mexican 16%
- Common ancestry
- Romanian 1% Lithuanian 1% Iranian 1%
- Foreign-born
- 8% · Canada
- Languages at home
- 86% English-only · Spanish 14%
Political lean MEDSL · Cook
- 2024 margin
- Solid D (+42.0) · D 70.4% · R 28.4% · Other 1.2%
- 2008→2024 swing
- -11.4pp toward R · 2008: 53.4pp · 2024: 42.0pp
- All cycles
- 2024: D+42.0 2020: D+50.3 2016: D+53.0 2012: D+49.4 2008: D+53.4
Not yet ingested
- Civics
- —
Market trends
- HPI YoY
- ▲ 23.63%
- Current HPI
- 302.333
- Rent YoY
- —
- Metro
- —
- State GDP YoY
- ▲ 1.59%
- F500 in state
- 60
Industry mix (Fortune 500 HQ in IL)
| Industry | F500 HQs | Revenue |
|---|---|---|
| Insurance | 4 | $201B |
|
||
| Consumer Goods | 4 | $87B |
|
||
| Industrial Machinery | 3 | $64B |
|
||
| Healthcare | 2 | $55B |
|
||
| Retail / Pharmacy | 1 | $148B |
|
||
| Agriculture / Food | 1 | $86B |
|
||
Price history
+175.0% since first listed10 events — show timeline
- 2026-06-18 Listed $198,000 MRED as Distributed by MLS Grid
- 2022-09-14 Sold (Public Records) $270,000 Public Records
- 2022-08-09 Sold (MLS) $85,000 MRED as Distributed by MLS Grid
- 2022-06-28 Listed — MRED as Distributed by MLS Grid
- 2022-06-27 Listed $85,000 MRED as Distributed by MLS Grid
- 2022-06-01 Listing Removed — MRED as Distributed by MLS Grid
- 2013-08-30 Sold (MLS) $18,500 MRED as Distributed by MLS Grid
- 2013-06-08 Pending — MRED as Distributed by MLS Grid
- 2013-05-23 Listed $16,900 MRED as Distributed by MLS Grid
- 1998-04-01 Sold (Public Records) $72,000 Public Records
Property tax history
+8.5%/yrLatest (2023): $6,933 · +42.9% YoY. Source: county tax records.
Cash-flow waterfall
monthlySold comps — $/sqft
last 12 mo · ≤1 miLoading sold comps…