 🏷️ Likely Rental
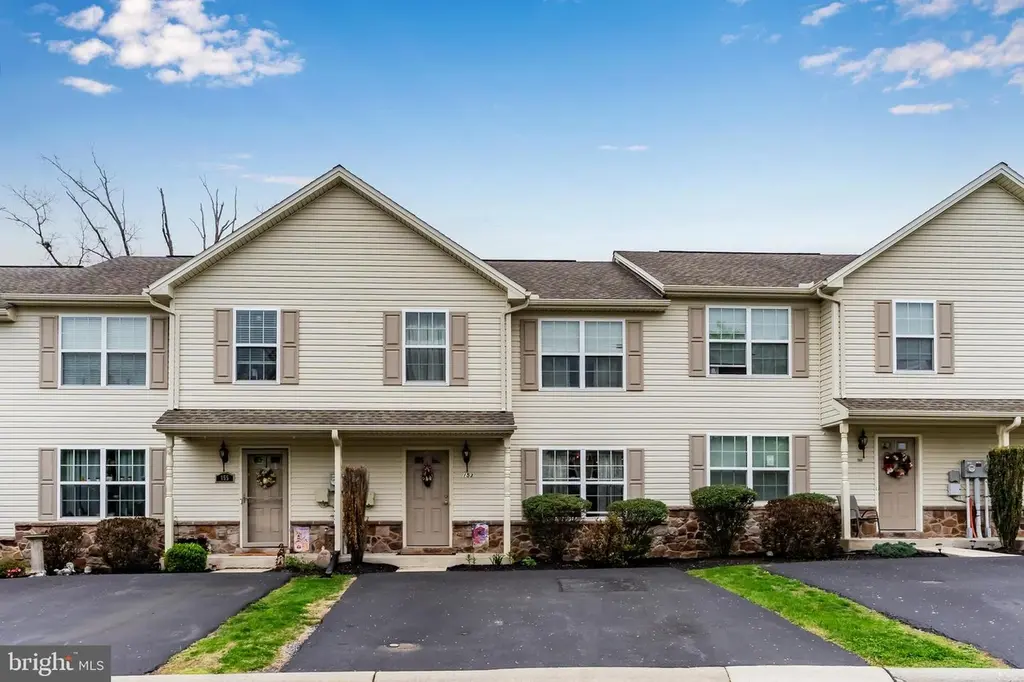
153 Mapleton Blvd · West Hanover, PA
Flood risk 1/10 · Minimal
- FEMA flood zone
- X (unshaded)
- Chance of flooding over 30 yrs
- 0.0%
- Est. flood insurance / yr
- $473 – $860
Fire risk 3/10 · Minor
- Est. fire insurance / yr
- $511 – $949
Heat risk 4/10 · Minor
- Hot days now (above 100°F)
- 7 days/yr
- Hot days in 30 yrs
- 14 days/yr
Wind risk 3/10 · Minor
- Chance of severe wind over 30 yrs
- 6.0%
Air-quality risk 3/10 · Minor
- Unhealthy air days now
- 3 days/yr
- Unhealthy air days in 30 yrs
- 4 days/yr
Risk factors via First Street. Map © Google.
Why this score? — see what drove the D- grade
The composite is a weighted blend of 9 inputs, each scored 0–100. Each bar is that input's sub-score; the figure is the points it added to the 100-point composite (weight × sub-score).
- ARV discount +15.0/15.0
- Cash flow +6.6/30.0
- Schools +3.6/10.0
- Rent growth +2.9/5.0
- 1% rule +2.7/10.0
- Livability +2.5/5.0
- Condition / age +2.5/5.0
- DSCR +0.9/10.0
- Appreciation +0.0/10.0
$249,900
🖨 Deal sheet 📄 Offer letter ✓ Due diligence
Listing remarks
Located in the Maple Glen community in West Hanover Township and within the Central Dauphin School District, this 3-bedroom, 2.5-bath townhome offers comfortable living with a functional layout and convenient location. The spacious kitchen and dining area open to the rear deck overlooking private wooded views, providing a peaceful outdoor setting. A full basement offers excellent storage space and additional potential. The home features durable luxury vinyl plank flooring throughout with no carpet, offering low-maintenance living and a clean, modern feel. The property presents a great opportunity for an owner-occupant or investor alike. The home is currently tenant occupied, so showings ma
Key facts
- $205 HOA
- 2 parking spots
- Built 2011
Property features AI
Finance
- Other: Property manager present
- HOA & community: Condo fee $205 monthly managed by a professional off-site company; Condo fee covers common area maintenance, insurance, lawn maintenance, management, snow removal, and exterior building maintenance
Exterior
- Parking: Asphalt driveway with 2 driveway spaces (2 total garage/parking spaces); Driveway parking
- Utilities: Public water; Public sewer; 200+ amp electric service; Natural gas for heating and hot water; Municipal trash service not provided
- Home design: Interior townhouse/rowhouse; Condominium ownership; Property in good condition
- Construction: Frame construction; Architectural shingle roof; Permanent foundation; Full unfinished basement with interior access (below grade area approx. 700); Above-grade finished area estimated at 1,492
- Exterior features: Deck(s); Not in a federal flood zone; 2+ access exits
Interior
- Kitchen: Kitchen connected to dining area and family room
- Bedrooms: Three bedrooms on the upper level (includes master bedroom, bedroom 2, bedroom 3)
- Flooring: Laminated flooring
- Bathrooms: Two full bathrooms on upper level (including master bathroom); One half bathroom on main level
- Heating & cooling: Forced air heating (natural gas); Central air conditioning
- Interior features: Open floor plan with combination kitchen/dining and dining area; Family room adjacent to the kitchen; Walk-in closet(s); Drywall walls and ceilings; Estimated living area
- Laundry & utility: Laundry in the basement
Neighborhood map
What this means for you Summary
Snapshot
- This is a 3-bed/2.5-bath townhouse listed at $250k.
Deal economics
- At list price, monthly cash flow is $-410 ($-5k/yr) — negative.
- To cash-flow at today's rent, offer at most $177k (29.0% below list).
- To meet the 1% rule (rent ≥ 1% of price), the offer needs to be $192k (23.2% below list).
- Recommended offer: $177k (29.0% below list) — sets the bar for cash-flow.
Location & tenants
- Location reads: area grade D — affects rentability + tenant quality, not the cash-flow math above.
- Central Dauphin SD (suburban): math 30% / reading 52% proficiency, ranked #305 of 539 in PA (top 57%) — families likely to look elsewhere, expect single-tenant / working-renter base with shorter leases.
- Zoned schools: Central Dauphin Shs (math 71% / reading 24%, grade D, #164 of 437 statewide, top 38%, 1,975 students, 33% FRL) — zoned schools at 33% FRL track the district average.
- Market conditions: Rents rising (+1.6%/yr); 311 active listings in the ZIP; 7 comparable units currently listed for rent nearby; rentals at typical pace (median 23d on market — plan ~3-4 weeks tenant-placement turnaround); 43% of comp listings sitting > 30 days — soft ceiling on asking rent; solid renter incomes; 540 units permitted in Dauphin County in 2024 (194 in 5+ unit buildings).
Forward outlook
- Local home prices are declining (-3.0%/yr); year-one equity from $2k of loan paydown is wiped out by about $7k of value loss. Plan a longer hold.
Negotiation context
- It's been on market 41 days — a 3% lower offer ($242k) is reasonable based on typical stale-listing flexibility.
- 2 sale attempts since 13y ago with the ask held roughly flat each time — persistent listings suggest the price (not the market) is what's stuck; bring a comps-based counter.
- Current owner paid $115k; list at $250k implies a 117% gain — meaningful room to come down on a strong offer.
Questions for the listing agent
- What do current leases actually rent for vs. the listed asking? Can we see a recent rent roll and the last 12 months of T-12 income?
- It's been on market 41 days. Have you received any prior offers? Is the seller open to a 29% concession, seller financing, or rate buy-down credit?
- What does the HOA fee cover, when was the last increase, and are there any pending special assessments or reserve-fund shortfalls?
- Is there a deadline driving the sale (1031 exchange, divorce, estate, relocation)? That informs how much negotiation room exists.
- The area grade is low — what's the realistic commute time and amenity access for the typical tenant pool here? Any planned neighborhood developments (good or bad) we should know about?
- What's the average days-on-market for RENTAL listings here right now (not sales)? A rising rental-DOM trend means longer vacancies and softer asking-rent achievability than the comps imply.
- What's the recent tenant-quality profile in this submarket — average credit score on applications, eviction rate, late-payment / NSF rate, and stable-employment percentage? A property-management company in the area should have these aggregated.
- How much new for-sale + rental construction is in the pipeline within 1–3 miles? Heavy new supply typically softens prices + rents 12–24 months out; constrained supply supports both.
Investment metrics
- 1% rule
- 0.77% ✗
- Cap rate
- 4.32%
- Cash-on-cash
- -7.04%
- DSCR
- 0.69
- GRM
- 10.9
CMA / ARV
- ARV (median comp)
- $355,496
- List price
- $249,900
- Delta
- -29.70%
- Verdict
- UNDERPRICED
- Comps
- 20 within 1.0 mi
Show comp detail 12 sales within ~0.75 mi
| Address | Dist | Beds/Ba | Sqft | Sold | Price | $/sf | Match |
|---|---|---|---|---|---|---|---|
| 7506 Clover Lee Blvd | 0.32mi | 2/2.5 (-1) | 1,260 (-10%) | 1mo | $227,500 | $181 | 62 |
| 7562 Clover Lee Blvd | 0.34mi | 4/2.5 (+1) | 1,260 (-10%) | 7mo | $233,500 | $185 | 55 |
| 7264 White Oak Blvd | 0.55mi | 3/2.5 | 1,559 (+11%) | 2mo | $340,690 | $219 | 55 |
| 7245 White Oak Blvd | 0.55mi | 3/2.5 | 1,559 (+11%) | 3mo | $339,490 | $218 | 54 |
| 7244 White Oak Blvd | 0.55mi | 3/2.5 | 1,536 (+9%) | 8mo | $319,900 | $208 | 53 |
| 7224 White Oak Blvd | 0.55mi | 3/2.5 | 1,536 (+9%) | 12mo | $334,726 | $218 | 49 |
| 7258 White Oak Blvd | 0.55mi | 3/2.5 | 1,559 (+11%) | 10mo | $349,990 | $224 | 48 |
| 7353 Red Oak Ct | 0.49mi | 3/2.5 | 1,559 (+11%) | 14mo | $367,143 | $235 | 48 |
| 7216 White Oak Blvd | 0.56mi | 3/2.5 | 1,559 (+11%) | 10mo | $345,865 | $222 | 48 |
| 7228 White Oak Blvd | 0.55mi | 3/2.5 | 1,559 (+11%) | 11mo | $364,431 | $234 | 47 |
| 7226 White Oak Blvd | 0.55mi | 3/2.5 | 1,559 (+11%) | 13mo | $352,655 | $226 | 45 |
| 7246 White Oak Blvd White Oak Blvd | 0.55mi | 3/2.5 | 1,581 (+12%) | 11mo | $346,200 | $219 | 45 |
Match score weights: distance 35% · size 25% · config 20% · recency 20%. Top-matched comps best support the ARV.
Projected returns pro-forma
-3.0% appreciation · 1.64% rent growth · sell at horizon
- IRR
- -30.2%
- Equity multiple
- 0.01×
- Total profit
- $-69,078
- Equity at exit
- $37,261
- IRR
- -39.9%
- Equity multiple
- -0.48×
- Total profit
- $-103,544
- Equity at exit
- $21,607
Cash invested: $69,972 (down + closing). Projections, not guarantees.
Landlord ↔ Tenant lean methodology
- Overall (STATE)
- 62 Landlord-Friendly
- State Pennsylvania
- 62 Landlord-Friendly · EVEN
- County
- — inherits STATE
- City
- — inherits STATE
ZIP-level market 17112
- Rents YoY
- 1.6%
- Active inventory
- 311
- Price-to-rent
- 10.9×
Monthly cashflow live
- Estimated rent
- $1,918 high interval (Pro) →
- Mortgage (P&I)
- −$1,311
- Tax from tax record
- −$306 /mo · $3,675/yr
- Insurance
- −$104
- HOA
- −$205
- Vacancy / Maint / Mgmt
- −$403
- Net cashflow
- $-410
Break-even live
UW: 25.0% down · 7.5% · 30yr · 1.5% tax · 5.0% vac · 8.0% maint · 8.0% mgmt
Financing live
Cash to close
- Down payment
- $62,475
- Closing costs
- $7,497
- Reserves months
- —
- Total cash needed
- —
Loan-product check · same deal, 3 products live
Conventional
25% down · 7.5% · 30yr
- Down + closing
- —
- Monthly P&I
- —
- Monthly cashflow
- —
- DSCR
- —
- Eligible?
- —
Personal DTI + credit; lowest rate.
DSCR
20% down · 8.5% · 30yr
- Down + closing
- —
- Monthly P&I
- —
- Monthly cashflow
- —
- DSCR
- —
- Eligible?
- —
No personal income docs; deal must DSCR.
Hard money
10% down · 12.0% · 12mo
- Down + closing
- —
- Monthly P&I
- —
- Monthly cashflow
- —
- DSCR
- —
- Eligible?
- —
Short-term bridge; refi at stabilization.
Rent comps 7 comps
| Address | Beds | Baths | Sqft | Rent | $/sqft | DOM | Units | Dist |
|---|---|---|---|---|---|---|---|---|
| 162 N Fairville Ave Harrisburg, PA | 3.0 | 1.0 | 1537 | $2,000 | $1.30 | 13d | 1 | 0.57mi |
| 7867 Oak Brook Dr Harrisburg, PA | 3.0 | 2.5 | 1730 | $1,990 | $1.15 | 43d | 1 | 1.13mi |
| 25 Sarhelm Rd Unit D Harrisburg, PA | 2.0 | 1.0 | 950 | $1,200 | $1.26 | 23d | 1 | 1.16mi |
| 25 Sarhelm Rd Unit E Harrisburg, PA | 2.0 | 1.0 | 900 | $1,200 | $1.33 | 43d | 1 | 1.16mi |
| 7874 Manada Ct Unit 28 West Hanover Township, PA | 3.0 | 3.0 | 1612 | $1,750 | $1.09 | 13d | 1 | 1.20mi |
| 158 Radle Rd Harrisburg, PA | 3.0 | 2.5 | 1445 | $1,895 | $1.31 | 43d | 1 | 1.23mi |
| 500 Northstar Dr Harrisburg, PA | 2.0 | 2.5 | 1440 | $2,149 | $1.49 | 13d | 1 | 1.33mi |
HOA detail
- Monthly dues
- $205 · $2,460/yr
Listing history 21 events
-
2026-06-18days on market $249,900 Active 41 DOM
-
2026-06-17days on market $249,900 Active 40 DOM
-
2026-06-16days on market $249,900 Active 39 DOM
-
2026-06-15days on market $249,900 Active 38 DOM
-
2026-06-14days on market $249,900 Active 36 DOM
-
2026-06-13days on market $249,900 Active 35 DOM
-
2026-06-10days on market $249,900 Active 33 DOM
-
2026-06-09days on market $249,900 Active 32 DOM
-
2026-06-08days on market $249,900 Active 31 DOM
-
2026-06-07days on market $249,900 Active 30 DOM
-
2026-06-05days on market $249,900 Active 27 DOM
-
2026-06-03days on market $249,900 Active 26 DOM
-
2026-06-02days on market $249,900 Active 25 DOM
-
2026-06-01days on market $249,900 Active 24 DOM
-
2026-05-31days on market $249,900 Active 23 DOM
-
2026-05-31days on market $249,900 Active 22 DOM
-
2026-05-09$249,900 Active 1133-char remark
-
2026-05-06historical $249,900 1133-char remark
-
2013-10-10soldstatus $115,000
-
2013-06-19historical
-
2013-05-07$149,900
ⓘ Source: listings_history table (triggers on properties + properties_extension) + one-shot
backfill from property_details.listing_events for pre-trigger history.
Tax reassessment forecast PA · Partial reset (capped growth)
- Current annual tax
- $3,675 · $306/mo
- Projected year-2 tax
- $3,812 · $318/mo
- Expected delta
- +$137/yr (+$11/mo · 3.7%)
ⓘ Screening estimate from a state-policy table — verify with the county assessor before closing.
Climate risk First Street
- Flood 1/10 Low FEMA zone X (unshaded) · 0% chance over 30 yrs
- Wildfire 3/10 Moderate
- Heat 4/10 Moderate 7 d/yr ≥100°F today · 14 d/yr by 30 yrs out
- Wind 3/10 Moderate 6% chance of damaging wind over 30 yrs
- Air quality 3/10 Moderate 3 unhealthy d/yr today · 4 by 30 yrs out
Nearby sold comps map
Loading sold comps map…
Walkable amenities ~0.75 mi
Loading nearby amenities…
Taxation est. · year 1
- Rental income
- $23,018
- − Mortgage interest
- −$13,998
- − Property taxes
- −$3,675
- − Insurance
- −$1,250
- − Repairs & maintenance
- −$1,841
- − Management
- −$1,841
- − HOA
- −$2,460
- − Depreciation
- −$7,270
- Taxable loss
- −$9,317
- Est. tax savings @ 24.0%
- +$2,236
- After-tax cash flow
- $-2,690/yr
For passive investors: Depreciation is non-cash, so a rental often shows a tax loss while cash-flowing — sheltering income. Rental losses are passive: they offset passive income freely, and up to $25,000/yr can offset ordinary (W-2) income if you actively participate and your MAGI is under $100k (phasing out to $0 by $150k); unused losses carry forward. On sale, claimed depreciation is recaptured at up to 25%, and gains may owe capital-gains tax (a 1031 exchange can defer both). Figures are a year-1 estimate at your 24.0% rate — not tax advice; consult a CPA.
Schools (NCES district)
- District
- Central Dauphin SD
- NCES district ID
- 4205400
- Math proficiency
- 30% ▼ -12.00%
- Reading proficiency
- 52% ▼ -7.00%
- Median HH income
- $62,792
- Composite
- 36.46/100
- National rank
- #4664
- State rank
- #305 of 539 in PA
Livability — West Hanover
No livability data for this city. (Only ~50 U.S. cities are tracked.)
Census & demographics
- Census place
- Skyline View, PA
- County
- Dauphin County · 247,857 people
- Metro
- Harrisburg-Carlisle, PA
- Population (ZIP)
- 38,502
- Household income
- $103,876
- Rent vs Own
- Severe rent burden
- 412.0
Population outlook (Dauphin County) Hauer SSP2
- Today (2025)
- 281,628 people
- By 2030
- 283,549 · +0.7%
- By 2040
- 285,385 · +1.3%
- By 2050
- 286,188 · +1.6%
- By 2075
- 291,053 · +3.3%
- By 2100
- 282,374 · +0.3%
Race, ethnicity, and origin ACS 2023
- Neighborhood character
- Predominantly White (78%)
- Race & ethnicity
- White 78% Black 8% Asian 7% Hispanic / Latino 4% Two or more races 3%
- Common ancestry
- Romanian 3% Iranian 2% Lithuanian 2%
- Foreign-born
- 9% · India, Canada, China
- Languages at home
- 90% English-only · Other Indo-European 3% Spanish 1% Other Asian/Pacific 1%
Political lean MEDSL · Dauphin
- 2024 margin
- Lean D (+5.9) · D 52.4% · R 46.5% · Other 1.1%
- 2008→2024 swing
- -3.1pp toward R · 2008: 9.1pp · 2024: 5.9pp
- All cycles
- 2024: D+5.9 2020: D+8.5 2016: D+2.8 2012: D+6.0 2008: D+9.1
Not yet ingested
- Civics
- —
Market trends
- HPI YoY
- ▼ -207.10%
- Current HPI
- 244.5366
- Rent YoY
- ▲ 1.64%
- Metro
- Harrisburg-Carlisle, PA
- State GDP YoY
- ▲ 1.68%
- F500 in state
- 34
Industry mix (Fortune 500 HQ in PA)
| Industry | F500 HQs | Revenue |
|---|---|---|
| Healthcare | 2 | $309B |
|
||
| Insurance | 2 | $27B |
|
||
| Telecommunications / Media | 1 | $124B |
|
||
| Industrial Distribution | 1 | $22B |
|
||
| Financial Services | 1 | $20B |
|
||
| Chemicals / Materials | 1 | $18B |
|
||
Price history
+66.7% since first listed5 events — show timeline
- 2026-05-09 Listed $249,900 BRIGHT MLS
- 2026-05-06 Coming Soon $249,900 BRIGHT MLS
- 2013-10-10 Sold (Public Records) $115,000 Public Records
- 2013-06-19 Listing Removed — BRIGHT MLS
- 2013-05-07 Listed $149,900 BRIGHT MLS
Property tax history
+2.2%/yrLatest (2026): $3,675 · +5.9% YoY. Source: county tax records.
Cash-flow waterfall
monthlySold comps — $/sqft
last 12 mo · ≤1 miLoading sold comps…