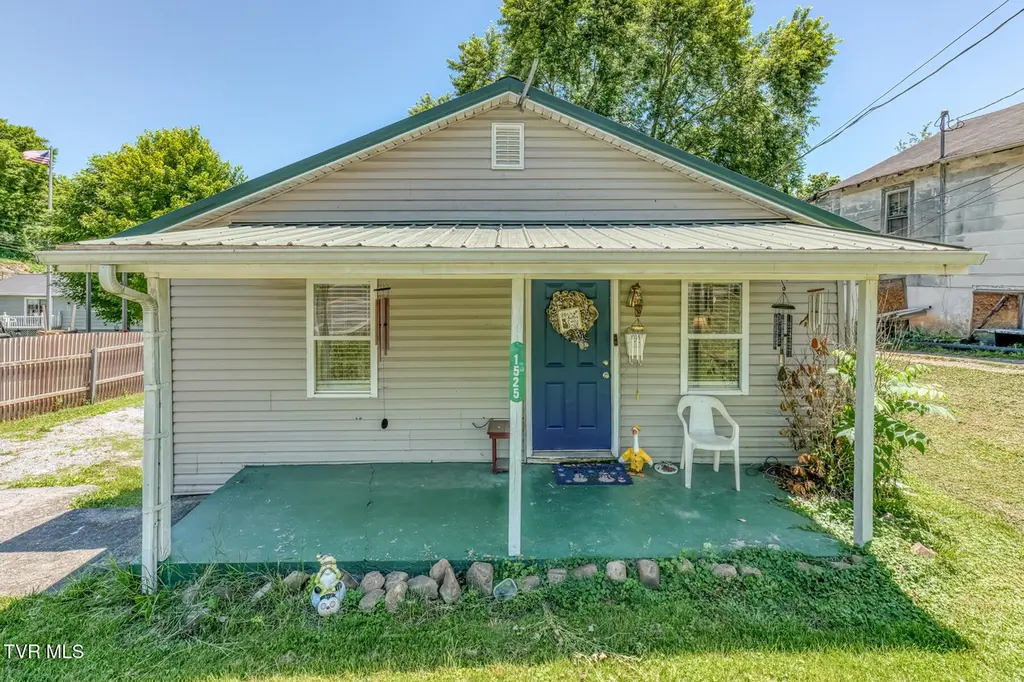
1525 Massachusetts Ave · Bristol, VA
Flood risk 1/10 · Minimal
- FEMA flood zone
- X (unshaded)
- Chance of flooding over 30 yrs
- 0.0%
- Est. flood insurance / yr
- $473 – $860
Fire risk 4/10 · Minor
- Est. fire insurance / yr
- $666 – $1,236
Heat risk 4/10 · Minor
- Hot days now (above 98°F)
- 7 days/yr
- Hot days in 30 yrs
- 21 days/yr
Wind risk 2/10 · Minimal
- Chance of severe wind over 30 yrs
- —
Air-quality risk 2/10 · Minimal
- Unhealthy air days now
- 1 days/yr
- Unhealthy air days in 30 yrs
- 2 days/yr
Risk factors via First Street. Map © Google.
Why this score? — see what drove the B grade
The composite is a weighted blend of 9 inputs, each scored 0–100. Each bar is that input's sub-score; the figure is the points it added to the 100-point composite (weight × sub-score).
- Cash flow +28.1/30.0
- ARV discount +15.0/15.0
- DSCR +10.0/10.0
- 1% rule +6.5/10.0
- Schools +5.2/10.0
- Livability +3.7/5.0
- Rent growth +2.5/5.0
- Condition / age +2.5/5.0
- Appreciation +0.0/10.0
$115,000
🖨 Deal sheet 📄 Offer letter ✓ Due diligence
Listing remarks MLS
This one level home offers three bedrooms at an affordable price. Whether you are an investor or an owner occupant, this home has lots to offer. Newer flooring in kitchen and bath. New deck boards and rails. Some fresh paint. Home has newer windows, vinyl siding and roof. Full basement offers tons of storage or finish for additional space. Front porch is covered for an additional area of outdoor enjoyment. Space to park multiple vehicles in the rear or ease of turning around to exit onto Massachusetts. Large, partially fenced back yard with plenty of room for a shed, swing set or your personal landscaping touches. Schedule your private showing today!!
Key facts
- One level home
- New flooring
- Full basement
Tags
Property features AI
Exterior
- Parking: Driveway with asphalt surface
- Utilities: Public water; Public sewer
- Home design: Single-family house; One level; Residential property (R1 zoning)
- Construction: Vinyl siding; Block foundation; Metal roof; Built as a house (structure type)
- Exterior features: Deck; Cleared, rolling slope lot
Interior
- Kitchen: Built-in electric oven; Refrigerator
- Bedrooms: 5 total rooms
- Flooring: Laminate; Vinyl
- Bathrooms: 1 full bathroom
- Heating & cooling: Heat pump for heating and cooling
- Interior features: Eat-in kitchen; See remarks
- Laundry & utility: Washer hookup; Electric dryer hookup
Neighborhood map
What this means for you Summary
Snapshot
- This is a 3-bed/1.0-bath single-family listed at $115k.
Deal economics
- At list price, monthly cash flow is $361 ($4k/yr) — positive.
- The deal already cash-flows at list — no discount required.
- Meets the 1% rule at list price ($1k rent vs $115k).
- Recommended offer: $113k (1.5% below list) — sets the bar for market timing.
- Cap rate 10.1% vs local median 4.9% in Bristol — top-decile yield for the area; either an underpriced asset or a hidden risk that comps aren't pricing in. Stress-test before assuming the spread holds.
Location & tenants
- Location reads 74/100 on livability (#140 in VA, #4,544 nationally) — a middle-class / working-renter tenant base. Strengths: cost of living A+, housing A+, health & safety A+; Watch: crime F, commute F, employment F.
- Bristol City Public School District (urban): math 57% / reading 70% proficiency, ranked #53 of 131 in VA (top 40%) — acceptable for families but not a draw, mixed tenant base, ~2y average lease.
- Zoned schools: Highland View Elementary (math 42% / reading 62%, grade C-, #696 of 1,108 statewide, top 66%, 175 students, 98% FRL); Virginia Middle (math 56% / reading 71%, grade B+, #128 of 342 statewide, top 39%, 487 students, 101% FRL); Virginia High (math 62% / reading 77%, grade B, #159 of 319 statewide, top 53%, 637 students, 100% FRL) — zoned schools average 100% FRL vs 58% district-wide (42 pts higher); higher-poverty schools than district average — tighter screening recommended.
- Market conditions: 156 active listings in the ZIP; 5 comparable units currently listed for rent nearby; rentals leasing fast (median 13d on market — plan ~1-2 weeks tenant-placement turnaround); 15 units permitted in Bristol city in 2024 (5 in 5+ unit buildings).
Forward outlook
- Local home prices are declining (-3.0%/yr); year-one equity from $795 of loan paydown is wiped out by about $3k of value loss. Plan a longer hold.
- Bristol County population projected at -20% by 2050 — secular population decline; favor cash flow + early exit over multi-decade hold.
- At projected returns (-3.0% appreciation + 3.0% rent growth), your $32k cash investment doubles in ~9 years — after that, you're playing with house money.
Negotiation context
- It's been on market 15 days — a 2% lower offer ($113k) is reasonable based on typical stale-listing flexibility.
- 5 sale attempts since 2y ago with the ask held roughly flat each time — persistent listings suggest the price (not the market) is what's stuck; bring a comps-based counter.
- Current owner paid $89k; 29% above their basis — modest negotiation headroom, anchor on the comps not their cost.
Risks & watch-outs
- Watch-outs: built in 1906 — expect roof / HVAC / electrical / plumbing capex.
Questions for the listing agent
- Built in 1906 — when were the roof, HVAC, electrical panel, plumbing, and water heater last replaced?
- Is there a deadline driving the sale (1031 exchange, divorce, estate, relocation)? That informs how much negotiation room exists.
- Schools are A-rated — typically a magnet for longer-tenancy family renters. What's the average tenant stay here, and is there a school-zone premium baked into asking?
- Crime grade is F in this area — have there been break-ins, vandalism, or insurance claims at this property in the last 3 years? What carrier currently insures it and at what premium?
- What's the average days-on-market for RENTAL listings here right now (not sales)? A rising rental-DOM trend means longer vacancies and softer asking-rent achievability than the comps imply.
- What's the recent tenant-quality profile in this submarket — average credit score on applications, eviction rate, late-payment / NSF rate, and stable-employment percentage? A property-management company in the area should have these aggregated.
- How much new for-sale + rental construction is in the pipeline within 1–3 miles? Heavy new supply typically softens prices + rents 12–24 months out; constrained supply supports both.
Investment metrics
- 1% rule
- 1.15% ✓
- Cap rate
- 10.06%
- Cash-on-cash
- 13.47%
- DSCR
- 1.60
- GRM
- 7.2
CMA / ARV
- ARV (on-the-fly)
- $170,880
- Comps found
- 12
Show comp detail 12 sales within ~0.75 mi
| Address | Dist | Beds/Ba | Sqft | Sold | Price | $/sf | Match |
|---|---|---|---|---|---|---|---|
| 1741 Dunlap St | 0.16mi | 3/1.0 | 1,085 (+2%) | 9mo | $40,000 | $37 | 82 |
| 159 King Mill Pike | 0.15mi | 3/1.5 | 1,095 (+2%) | 6mo | $175,000 | $160 | 82 |
| 382 Texas Ave | 0.21mi | 2/1.0 (-1) | 973 (-9%) | 6mo | $99,000 | $102 | 66 |
| 723 Portsmouth Ave | 0.59mi | 3/1.0 | 1,180 (+10%) | 4mo | $180,000 | $153 | 52 |
| 934 Massachusetts Ave | 0.45mi | 3/2.0 | 957 (-10%) | 8mo | $125,000 | $131 | 51 |
| 209 Sunrise St | 0.32mi | 2/1.5 (-1) | 960 (-10%) | 12mo | $157,000 | $164 | 51 |
| 645 Suffolk Ave | 0.65mi | 2/1.0 (-1) | 1,112 (+4%) | 10mo | $138,600 | $125 | 50 |
| 105 Crossway Rd | 0.72mi | 2/2.0 (-1) | 1,027 (-4%) | 10mo | $206,000 | $201 | 43 |
| 243 Sapling Grove Ct | 0.73mi | 2/2.0 (-1) | 1,172 (+10%) | 0mo | $184,700 | $158 | 40 |
| 259 Sapling Grove Ct | 0.74mi | 2/2.0 (-1) | 1,172 (+10%) | 2mo | $205,000 | $175 | 39 |
| 324 Reservoir St | 0.72mi | 3/1.0 | 950 (-11%) | 11mo | $160,000 | $168 | 38 |
| 105 Willow Oak Ct | 0.71mi | 2/2.0 (-1) | 1,159 (+8%) | 11mo | $225,000 | $194 | 34 |
Match score weights: distance 35% · size 25% · config 20% · recency 20%. Top-matched comps best support the ARV.
Projected returns pro-forma
-3.0% appreciation · 3.0% rent growth · sell at horizon
- IRR
- 3.5%
- Equity multiple
- 1.13×
- Total profit
- $4,338
- Equity at exit
- $17,147
- IRR
- 13.0%
- Equity multiple
- 2.03×
- Total profit
- $33,229
- Equity at exit
- $9,943
Cash invested: $32,200 (down + closing). Projections, not guarantees.
Landlord ↔ Tenant lean methodology
- Overall (STATE)
- 55 Moderately Landlord-Leaning
- State Virginia
- 55 Moderately Landlord-Leaning · D+2
- County
- — inherits STATE
- City
- — inherits STATE
ZIP-level market 24201
- Active inventory
- 156
- Price-to-rent
- 7.2×
Monthly cashflow live
- Estimated rent
- $1,325 high interval (Pro) →
- Mortgage (P&I)
- −$603
- Tax from tax record
- −$34 /mo · $414/yr
- Insurance
- −$48
- HOA
- −$0
- Vacancy / Maint / Mgmt
- −$278
- Net cashflow
- $361
Break-even live
UW: 25.0% down · 7.5% · 30yr · 1.5% tax · 5.0% vac · 8.0% maint · 8.0% mgmt
Financing live
Cash to close
- Down payment
- $28,750
- Closing costs
- $3,450
- Reserves months
- —
- Total cash needed
- —
Loan-product check · same deal, 3 products live
Conventional
25% down · 7.5% · 30yr
- Down + closing
- —
- Monthly P&I
- —
- Monthly cashflow
- —
- DSCR
- —
- Eligible?
- —
Personal DTI + credit; lowest rate.
DSCR
20% down · 8.5% · 30yr
- Down + closing
- —
- Monthly P&I
- —
- Monthly cashflow
- —
- DSCR
- —
- Eligible?
- —
No personal income docs; deal must DSCR.
Hard money
10% down · 12.0% · 12mo
- Down + closing
- —
- Monthly P&I
- —
- Monthly cashflow
- —
- DSCR
- —
- Eligible?
- —
Short-term bridge; refi at stabilization.
Rent comps 5 comps
| Address | Beds | Baths | Sqft | Rent | $/sqft | DOM | Units | Dist |
|---|---|---|---|---|---|---|---|---|
| 1733 Dunlap St Bristol, VA | 3.0 | 1.0 | 900 | $1,250 | $1.39 | 13d | 1 | 0.17mi |
| 135 Kingsolver St Bristol, VA | 2.0 | 1.0 | 1000 | $1,400 | $1.40 | 20d | 1 | 0.33mi |
| 279 Reservoir St Bristol, VA | 3.0 | 1.5 | 1300 | $1,600 | $1.23 | 13d | 1 | 0.77mi |
| 1225 Carriage Cir #203 Bristol, VA | 2.0 | 2.0 | 968 | $1,150 | $1.19 | 13d | 1 | 0.99mi |
| 1001 Virginia Ave Unit 2 Bristol, TN | 2.0 | 1.0 | 800 | $1,375 | $1.72 | 20d | 1 | 1.48mi |
Listing history 13 events
-
2026-06-19days on market $115,000 Active 15 DOM
-
2026-06-18price $115,000 Active 14 DOM
-
2026-06-18days on market $120,000 Active 14 DOM
-
2026-06-17days on market $120,000 Active 13 DOM
-
2026-06-16days on market $120,000 Active 12 DOM
-
2026-06-15days on market $120,000 Active 11 DOM
-
2026-06-14days on market $120,000 Active 9 DOM
-
2026-06-13days on market $120,000 Active 8 DOM
-
2026-06-10days on market $120,000 Active 6 DOM
-
2026-06-09days on market $120,000 Active 5 DOM
-
2026-06-08days on market $120,000 Active 4 DOM
-
2026-06-07remarks 544-char remark
-
2026-06-07$120,000 Active 3 DOM
ⓘ Source: listings_history table (triggers on properties + properties_extension) + one-shot
backfill from property_details.listing_events for pre-trigger history.
Tax reassessment forecast VA · Resets to sale price
- Current annual tax
- $414 · $34/mo
- Projected year-2 tax
- $943 · $79/mo
- Expected delta
- +$529/yr (+$44/mo · 128.0%)
ⓘ Screening estimate from a state-policy table — verify with the county assessor before closing.
Climate risk First Street
- Flood 1/10 Low FEMA zone X (unshaded) · 0% chance over 30 yrs
- Wildfire 4/10 Moderate
- Heat 4/10 Moderate 7 d/yr ≥98°F today · 21 d/yr by 30 yrs out
- Wind 2/10 Low
- Air quality 2/10 Low 1 unhealthy d/yr today · 2 by 30 yrs out
Nearby sold comps map
Loading sold comps map…
Walkable amenities ~0.75 mi
Loading nearby amenities…
Taxation est. · year 1
- Rental income
- $15,902
- − Mortgage interest
- −$6,442
- − Property taxes
- −$414
- − Insurance
- −$575
- − Repairs & maintenance
- −$1,272
- − Management
- −$1,272
- − Depreciation
- −$3,345
- Taxable income
- $2,582
- Est. tax owed @ 24.0%
- −$620
- After-tax cash flow
- $3,718/yr
For passive investors: Depreciation is non-cash, so a rental often shows a tax loss while cash-flowing — sheltering income. Rental losses are passive: they offset passive income freely, and up to $25,000/yr can offset ordinary (W-2) income if you actively participate and your MAGI is under $100k (phasing out to $0 by $150k); unused losses carry forward. On sale, claimed depreciation is recaptured at up to 25%, and gains may owe capital-gains tax (a 1031 exchange can defer both). Figures are a year-1 estimate at your 24.0% rate — not tax advice; consult a CPA.
Schools (NCES district)
- District
- Bristol City Public School District
- NCES district ID
- 5100450
- Math proficiency
- 57% ▼ -24.00%
- Reading proficiency
- 70% ▼ -6.00%
- Median HH income
- $33,978
- Composite
- 52.4/100
- National rank
- #1579
- State rank
- #53 of 131 in VA
Livability — Bristol
- Score
- 74/100
- State rank
- #140
- US rank
- #4544
Category grades
Schools grade is shown separately in the Schools card above.
Census & demographics
- Census place
- Bristol, VA
- City population
- 16,039
- Population (ZIP)
- 16,039
Population outlook (Bristol County) Hauer SSP2
- Today (2025)
- 16,113 people
- By 2030
- 15,510 · -3.7%
- By 2040
- 14,121 · -12.4%
- By 2050
- 12,847 · -20.3%
- By 2075
- 9,870 · -38.7%
- By 2100
- 7,883 · -51.1%
Race, ethnicity, and origin ACS 2023
- Neighborhood character
- Predominantly White (85%)
- Race & ethnicity
- White 85% Black 7% Two or more races 6% Hispanic / Latino 3%
- Common ancestry
- Slovak 4% Serbian 1% Iranian 0%
- Foreign-born
- 1% · Canada
- Languages at home
- 98% English-only · Spanish 2%
Political lean MEDSL · Bristol
- 2024 margin
- Solid R (+39.7) · D 29.8% · R 69.5%
- 2008→2024 swing
- -13.6pp toward R · 2008: -26.0pp · 2024: -39.7pp
- All cycles
- 2024: R+39.7 2020: R+38.9 2016: R+43.8 2012: R+31.1 2008: R+26.0
Not yet ingested
- Civics
- —
Market trends
- HPI YoY
- ▼ -206.40%
- Current HPI
- 196.2099
- Rent YoY
- —
- Metro
- —
- State GDP YoY
- ▲ 2.40%
- F500 in state
- 50
Industry mix (Fortune 500 HQ in VA)
| Industry | F500 HQs | Revenue |
|---|---|---|
| Aerospace / Defense | 4 | $236B |
|
||
| Technology / Defense | 3 | $32B |
|
||
| Financial Services | 2 | $176B |
|
||
| Utilities | 2 | $27B |
|
||
| Insurance | 2 | $25B |
|
||
| Technology | 2 | $15B |
|
||
Price history
+563.0% since first listed16 events — show timeline
- 2026-06-04 Listed $120,000 TVRMLS
- 2024-07-25 Sold (MLS) $89,000 TVRMLS
- 2024-07-25 Sold (MLS) $89,000 SWVAR
- 2024-07-01 Pending — TVRMLS
- 2024-07-01 Contingent — SWVAR
- 2024-06-28 Price Changed $89,900 TVRMLS
- 2024-06-28 Price Changed $89,900 SWVAR
- 2024-06-22 Relisted — TVRMLS
- 2024-06-22 Relisted — SWVAR
- 2024-06-17 Contingent — SWVAR
- 2024-06-17 Contingent — TVRMLS
- 2024-06-14 Price Changed $95,000 TVRMLS
- 2024-06-14 Price Changed $95,000 SWVAR
- 2024-05-28 Listed $97,500 TVRMLS
- 2024-05-28 Listed $97,500 SWVAR
- 2005-02-22 Sold (Public Records) $18,100 Public Records
Cash-flow waterfall
monthlySold comps — $/sqft
last 12 mo · ≤1 miLoading sold comps…