 Triplex
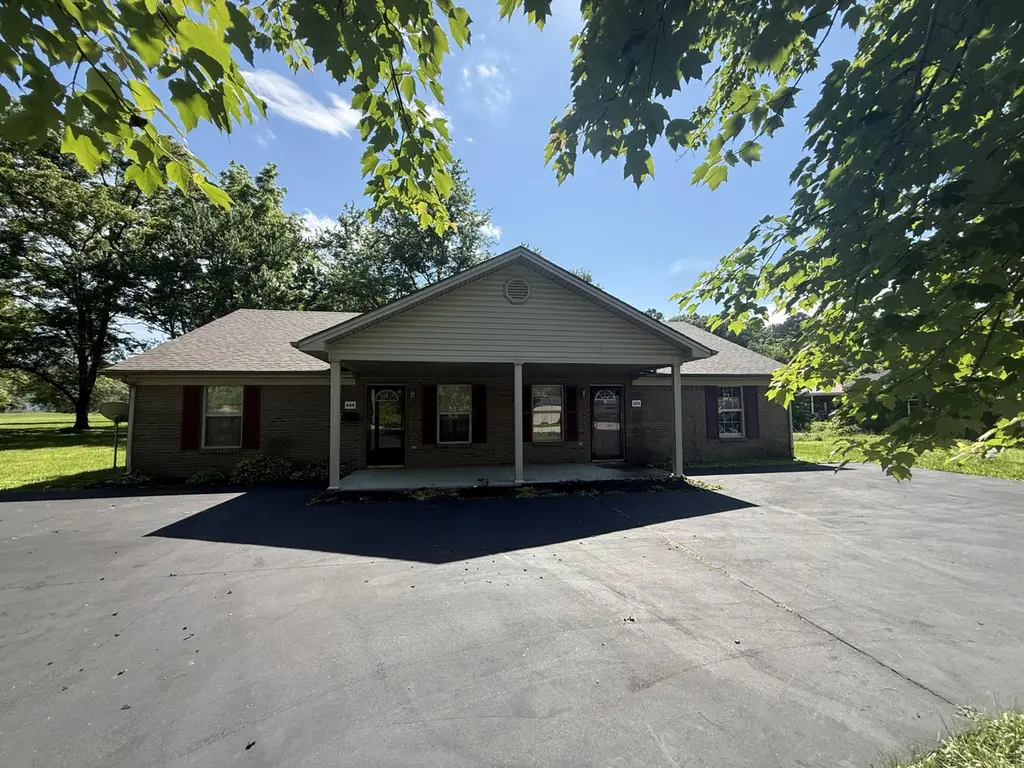
655-659 Scaffold Cane Rd · Berea, KY
Flood risk 9/10 · Severe
- FEMA flood zone
- X (unshaded)
- Chance of flooding over 30 yrs
- 0.99%
- Est. flood insurance / yr
- $507 – $1,088
Fire risk 5/10 · Moderate
- Est. fire insurance / yr
- $839 – $1,559
Heat risk 4/10 · Minor
- Hot days now (above 101°F)
- 7 days/yr
- Hot days in 30 yrs
- 20 days/yr
Wind risk 2/10 · Minimal
- Chance of severe wind over 30 yrs
- 4.0%
Air-quality risk 1/10 · Minimal
- Unhealthy air days now
- 0 days/yr
- Unhealthy air days in 30 yrs
- 0 days/yr
Risk factors via First Street. Map © Google.
Why this score? — see what drove the D+ grade
The composite is a weighted blend of 9 inputs, each scored 0–100. Each bar is that input's sub-score; the figure is the points it added to the 100-point composite (weight × sub-score).
- Cash flow +18.9/30.0
- ARV discount +7.5/15.0
- DSCR +6.0/10.0
- 1% rule +5.1/10.0
- Livability +3.8/5.0
- Schools +3.3/10.0
- Rent growth +2.5/5.0
- Condition / age +2.5/5.0
- Appreciation +0.0/10.0
$279,900
🖨 Deal sheet 📄 Offer letter ✓ Due diligence
Multi-family units
County records classify this as Multi-Family (5+ Unit). Listing-text estimate: 3 units. estimate disagrees with records
5+ unit building — per-unit beds/baths from public records are typically unavailable; the breakdown below (if shown) is an estimate from the listing text.
Listing remarks
Low maintenance all brick exterior two living quarters each with high classy vaulted ceilings in the living rooms, large kitchens, laundry areas, 2 bedrooms and 1 bath with large yards and one unit has a nice storage building plus is located only 1.5 miles from College Square. Live in one side and rent out the other side or use as in one side. Many other possibilities as well as, just add a doorway inside to join units and have a huge home with 4 bedrooms/2 baths. Enjoy a very nice large level yard with mature trees and a roomy blacktop circle double driveway. Great location in beautiful Berea in/Madison County Ky. Berea has several bike trails to use if your into exercising and lots of ar
Key facts
- Large kitchens
- Level yard
- Brick exterior
Tags
Property features AI
Exterior
- Parking: On-site paved parking
- Utilities: Electricity connected; Water connected
- Home design: Duplex; Rural subdivision
- Construction: Total building area 2,072
- Exterior features: Dimensional style roof
Interior
- Bathrooms: 2 full bathrooms
- Heating & cooling: Heat pump heating; Central air conditioning
- Interior features: Central air; Heat pump
Neighborhood map
What this means for you Summary
Snapshot
- This is a 3 × 2-bed/1-bath units multifamily listed at $280k.
Deal economics
- At list price, monthly cash flow is $222 ($3k/yr) — positive. Per door: $74/mo.
- The deal already cash-flows at list — no discount required.
- Meets the 1% rule at list price ($3k rent vs $280k).
- Recommended offer: $276k (1.5% below list) — sets the bar for market timing.
- Cap rate 7.5% vs local median 3.0% in Berea — top-decile yield for the area; either an underpriced asset or a hidden risk that comps aren't pricing in. Stress-test before assuming the spread holds.
Location & tenants
- Location reads 75/100 on livability (#104 in KY, #4,354 nationally) — a middle-class / working-renter tenant base. Strengths: crime A+, cost of living A+, health & safety A+; Watch: employment D, amenities F, commute F.
- Madison County (town): math 31% / reading 47% proficiency, ranked #35 of 165 in KY (top 21%) — families likely to look elsewhere, expect single-tenant / working-renter base with shorter leases.
- Market conditions: 205 active listings in the ZIP; 453 units permitted in Madison County in 2024 (64 in 5+ unit buildings).
- At $2,814/mo this rent would consume 55% of the median local household income ($62k/yr) (locally 685% of renters already pay >50% of income on rent) — very limited rent-growth headroom before tenants either downsize or default.
Forward outlook
- Local home prices are declining (-3.0%/yr); year-one equity from $2k of loan paydown is wiped out by about $8k of value loss. Plan a longer hold.
- Madison County population projected at +28% by 2050 — long-run rental-demand tailwind backs the buy-and-hold thesis.
Negotiation context
- It's been on market 17 days — a 2% lower offer ($276k) is reasonable based on typical stale-listing flexibility.
- 3 sale attempts since 2y ago with the ask held roughly flat each time — persistent listings suggest the price (not the market) is what's stuck; bring a comps-based counter.
Risks & watch-outs
- Watch-outs: flood insurance adds $66/mo.
- Climate carrying-cost: severe flood risk; moderate wildfire risk — expect insurance premiums to compound above CPI over the hold.
Questions for the listing agent
- Can we see the unit-by-unit rent roll, current vacancy, and any below-market leases? What's the average tenancy length?
- What capital expenditures (roof, boiler, parking lot, exteriors) have been made in the last 5 years, and what's planned in the next 2?
- What's the actual annual flood-insurance premium (NFIP or private), and is the property in a SFHA with mandatory coverage?
- Is there a deadline driving the sale (1031 exchange, divorce, estate, relocation)? That informs how much negotiation room exists.
- The area grade is low — what's the realistic commute time and amenity access for the typical tenant pool here? Any planned neighborhood developments (good or bad) we should know about?
- What's the average days-on-market for RENTAL listings here right now (not sales)? A rising rental-DOM trend means longer vacancies and softer asking-rent achievability than the comps imply.
- What's the recent tenant-quality profile in this submarket — average credit score on applications, eviction rate, late-payment / NSF rate, and stable-employment percentage? A property-management company in the area should have these aggregated.
- How much new apartment / multifamily construction is in the pipeline within 1–3 miles? Heavy new supply (>2% of stock underway) typically softens rents 12–24 months out; light construction supports rent growth.
Investment metrics
- 1% rule
- 1.01% ✓
- Cap rate
- 7.53%
- Cash-on-cash
- 4.42%
- DSCR
- 1.20
- GRM
- 8.3
CMA / ARV
No comps found within radius.
Projected returns pro-forma
-3.0% appreciation · 3.0% rent growth · sell at horizon
- IRR
- -10.9%
- Equity multiple
- 0.60×
- Total profit
- $-31,116
- Equity at exit
- $41,734
- IRR
- -1.6%
- Equity multiple
- 0.89×
- Total profit
- $-8,527
- Equity at exit
- $24,201
Cash invested: $78,372 (down + closing). Projections, not guarantees.
Landlord ↔ Tenant lean methodology
- Overall (STATE)
- 83 Strongly Landlord-Friendly
- State Kentucky
- 83 Strongly Landlord-Friendly · R+16
- County
- — inherits STATE
- City
- — inherits STATE
ZIP-level market 40403
- Home prices YoY
- -15.7%
- Active inventory
- 205
- Price-to-rent
- 24.9×
Monthly cashflow live
- Estimated rent
- $2,814 medium interval (Pro) →
- Mortgage (P&I)
- −$1,468
- Tax est. 1.5%
- −$350 /mo · $4,198/yr
- Insurance
- −$117
- Flood insurance flood zone
- −$66 /mo · $798/yr
- HOA
- −$0
- Vacancy / Maint / Mgmt
- −$591
- Net cashflow
- $222
Break-even live
3-unit breakdown (identical units grouped — click to expand)
| Units | Beds | Baths | Est. rent |
|---|---|---|---|
| 3× units | 2 | 1 | $2,814 |
| #1 | 2 | 1 | $938 |
| #2 | 2 | 1 | $938 |
| #3 | 2 | 1 | $938 |
| Total (3 units) | $2,814 | ||
UW: 25.0% down · 7.5% · 30yr · 1.5% tax · 5.0% vac · 8.0% maint · 8.0% mgmt
Financing live
Cash to close
- Down payment
- $69,975
- Closing costs
- $8,397
- Reserves months
- —
- Total cash needed
- —
Loan-product check · same deal, 3 products live
Conventional
25% down · 7.5% · 30yr
- Down + closing
- —
- Monthly P&I
- —
- Monthly cashflow
- —
- DSCR
- —
- Eligible?
- —
Personal DTI + credit; lowest rate.
DSCR
20% down · 8.5% · 30yr
- Down + closing
- —
- Monthly P&I
- —
- Monthly cashflow
- —
- DSCR
- —
- Eligible?
- —
No personal income docs; deal must DSCR.
Hard money
10% down · 12.0% · 12mo
- Down + closing
- —
- Monthly P&I
- —
- Monthly cashflow
- —
- DSCR
- —
- Eligible?
- —
Short-term bridge; refi at stabilization.
Listing history 13 events
-
2026-06-18days on market $279,900 Active 17 DOM
-
2026-06-17days on market $279,900 Active 16 DOM
-
2026-06-16days on market $279,900 Active 15 DOM
-
2026-06-15days on market $279,900 Active 14 DOM
-
2026-06-14days on market $279,900 Active 12 DOM
-
2026-06-10days on market $279,900 Active 9 DOM
-
2026-06-09days on market $279,900 Active 8 DOM
-
2026-06-08days on market $279,900 Active 7 DOM
-
2026-06-07days on market $279,900 Active 6 DOM
-
2026-06-05days on market $279,900 Active 3 DOM
-
2026-06-03days on market $279,900 Active 2 DOM
-
2026-06-02remarks 699-char remark
-
2026-06-02$279,900 Active 1 DOM
ⓘ Source: listings_history table (triggers on properties + properties_extension) + one-shot
backfill from property_details.listing_events for pre-trigger history.
Climate risk First Street
- Flood 9/10 Extreme FEMA zone X (unshaded) · 99% chance over 30 yrs
- Wildfire 5/10 Major
- Heat 4/10 Moderate 7 d/yr ≥101°F today · 20 d/yr by 30 yrs out
- Wind 2/10 Low 4% chance of damaging wind over 30 yrs
- Air quality 1/10 Low 0 unhealthy d/yr today · 0 by 30 yrs out
Nearby sold comps map
Loading sold comps map…
Walkable amenities ~0.75 mi
Loading nearby amenities…
Taxation est. · year 1
- Rental income
- $33,768
- − Mortgage interest
- −$15,679
- − Property taxes
- −$4,198
- − Insurance
- −$2,197
- − Repairs & maintenance
- −$2,701
- − Management
- −$2,701
- − Depreciation
- −$8,143
- Taxable loss
- −$1,852
- Est. tax savings @ 24.0%
- +$444
- After-tax cash flow
- $3,112/yr
For passive investors: Depreciation is non-cash, so a rental often shows a tax loss while cash-flowing — sheltering income. Rental losses are passive: they offset passive income freely, and up to $25,000/yr can offset ordinary (W-2) income if you actively participate and your MAGI is under $100k (phasing out to $0 by $150k); unused losses carry forward. On sale, claimed depreciation is recaptured at up to 25%, and gains may owe capital-gains tax (a 1031 exchange can defer both). Figures are a year-1 estimate at your 24.0% rate — not tax advice; consult a CPA.
Schools (NCES district)
- District
- Madison County
- NCES district ID
- 2103720
- Math proficiency
- 31% ▼ -16.00%
- Reading proficiency
- 47% ▼ -14.00%
- Median HH income
- $43,590
- Composite
- 32.99/100
- National rank
- #5580
- State rank
- #35 of 165 in KY
Livability — Berea
- Score
- 75/100
- State rank
- #104
- US rank
- #4354
Category grades
Schools grade is shown separately in the Schools card above.
Census & demographics
- Census place
- Berea, KY
- County
- Madison County · 93,568 people
- City population
- 27,607
- Metro
- Richmond-Berea, KY
- Population (ZIP)
- 27,607
- Household income
- $61,771
- Rent vs Own
- Severe rent burden
- 685.0
Population outlook (Madison County) Hauer SSP2
- Today (2025)
- 99,241 people
- By 2030
- 104,927 · +5.7%
- By 2040
- 116,079 · +17.0%
- By 2050
- 127,293 · +28.3%
- By 2075
- 155,644 · +56.8%
- By 2100
- 176,488 · +77.8%
Race, ethnicity, and origin ACS 2023
- Neighborhood character
- Predominantly White (91%)
- Race & ethnicity
- White 91% Two or more races 5% Hispanic / Latino 4% Black 2%
- Common ancestry
- Italian 2% Slovak 2% Serbian 1%
- Foreign-born
- 2% · Canada
- Languages at home
- 97% English-only · Spanish 2%
Political lean MEDSL · Madison
- 2024 margin
- Solid R (+30.9) · D 33.6% · R 64.5% · Other 1.9%
- 2008→2024 swing
- -8.4pp toward R · 2008: -22.4pp · 2024: -30.9pp
- All cycles
- 2024: R+30.9 2020: R+26.8 2016: R+31.2 2012: R+28.9 2008: R+22.4
Not yet ingested
- Civics
- —
Market trends
- HPI YoY
- ▼ -53.22%
- Current HPI
- 286.6948
- Rent YoY
- —
- Metro
- Richmond-Berea, KY
- State GDP YoY
- ▲ 1.81%
- F500 in state
- 4
Industry mix (Fortune 500 HQ in KY)
| Industry | F500 HQs | Revenue |
|---|---|---|
| Healthcare | 1 | $118B |
|
||
| Food / Beverage | 1 | $7B |
|
||
Price history
-22.2% since first listed13 events — show timeline
- 2026-05-27 Listed $279,900 ImagineMLS
- 2026-04-16 Listing Removed — ImagineMLS
- 2026-01-06 Price Changed $279,900 ImagineMLS
- 2025-11-11 Price Changed $285,000 ImagineMLS
- 2025-05-31 Price Changed $289,000 ImagineMLS
- 2025-03-07 Price Changed $298,000 ImagineMLS
- 2024-12-26 Relisted — ImagineMLS
- 2024-12-22 Listing Removed — ImagineMLS
- 2024-12-13 Price Changed $310,000 ImagineMLS
- 2024-11-26 Price Changed $325,000 ImagineMLS
- 2024-10-15 Price Changed $344,900 ImagineMLS
- 2024-08-27 Price Changed $349,900 ImagineMLS
- 2024-07-25 Listed $359,900 ImagineMLS
Cash-flow waterfall
monthlySold comps — $/sqft
last 12 mo · ≤1 miLoading sold comps…