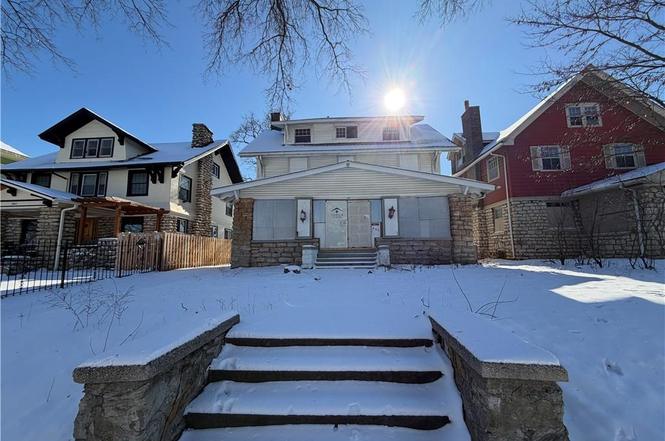
2607 Lockridge St · Kansas City, MO
Flood risk 1/10 · Minimal
- FEMA flood zone
- X (unshaded)
- Chance of flooding over 30 yrs
- 0.0%
- Est. flood insurance / yr
- $473 – $860
Fire risk 1/10 · Minimal
- Est. fire insurance / yr
- $1,054 – $1,958
Heat risk 4/10 · Minor
- Hot days now (above 106°F)
- 7 days/yr
- Hot days in 30 yrs
- 16 days/yr
Wind risk 2/10 · Minimal
- Chance of severe wind over 30 yrs
- —
Air-quality risk 3/10 · Minor
- Unhealthy air days now
- 2 days/yr
- Unhealthy air days in 30 yrs
- 3 days/yr
Risk factors via First Street. Map © Google.
Why this score? — see what drove the C- grade
The composite is a weighted blend of 9 inputs, each scored 0–100. Each bar is that input's sub-score; the figure is the points it added to the 100-point composite (weight × sub-score).
- Cash flow +15.0/30.0
- Appreciation +10.0/10.0
- ARV discount +7.5/15.0
- 1% rule +5.0/10.0
- DSCR +5.0/10.0
- Livability +3.9/5.0
- Rent growth +3.7/5.0
- Condition / age +2.5/5.0
- Schools +1.5/10.0
$40,000
🖨 Deal sheet (PDF) 📄 Offer letter ✓ Due diligence
Listing remarks MLS
3 Story home with 5 Beds, 1.5 baths in KCMO! Minutes from downtown! Gorgeous hardwood floors refinished. Fully updated kitchen is a DREAM featuring new appliances, granite counters, and hardwoods. HUGE master bedroom with enough space to have a sitting area! Updated bathroom with claw foot tub and new flooring! Enjoy coffee out on the enclosed porch or relax in greenroom off the back of the house! Home has private drive with garage! So much character in this home, don't miss out!
Key facts
- 8,234 sq ft lot
- Garage
- Built 1911
Neighborhood map
What this means for you Summary
Snapshot
- This is a 5-bed/1.0-bath single-family listed at $40k.
Deal economics
- At list price, monthly cash flow is $1k ($16k/yr) — positive.
- The deal already cash-flows at list — no discount required.
- Meets the 1% rule at list price ($2k rent vs $40k).
- Recommended offer: $39k (3.0% below list) — sets the bar for market timing.
- Cap rate 47.0% vs local median 3.9% in Kansas City — top-decile yield for the area; either an underpriced asset or a hidden risk that comps aren't pricing in. Stress-test before assuming the spread holds.
Location & tenants
- Location reads 78/100 on livability (#28 in MO, #2,671 nationally) — a middle-class / working-renter tenant base. Strengths: amenities A+, commute A+, cost of living A+; Watch: schools C-, crime F.
- Kansas City 33 (urban): math 12% / reading 24% proficiency, ranked #308 of 324 in MO (top 95%) — low school quality limits family demand, transient renter base, plan for 1-2y turnover; 75% free/reduced lunch — lower-income household profile, screen leases tightly.
- Market conditions: Rents rising fast (+4.7%/yr); 86 active listings in the ZIP; 8 comparable units currently listed for rent nearby; rentals at typical pace (median 24d on market — plan ~3-4 weeks tenant-placement turnaround); lower-income renter base — watch delinquency; 4,002 units permitted in Jackson County in 2024 (2,271 in 5+ unit buildings).
- At $2,131/mo this rent would consume 71% of the median local household income ($36k/yr) (locally 946% of renters already pay >50% of income on rent) — very limited rent-growth headroom before tenants either downsize or default.
Forward outlook
- In year one you build about $4k of equity ($277 loan paydown + $4k appreciation (10.0% local appreciation)).
- Jackson County population projected at +4% by 2050 — modest demand growth; plan on rents tracking national, not racing it.
- At projected returns (10.0% appreciation + 4.7% rent growth), your $11k cash investment doubles in ~1 year — after that, you're playing with house money.
- By year 7, paydown + projected appreciation supports a ~$31k cash-out refi (75% LTV) — recoverable capital for the next deal without selling this one.
Negotiation context
- It's been on market 56 days — a 3% lower offer ($39k) is reasonable based on typical stale-listing flexibility.
- 4 sale attempts since 8y ago with the ask held roughly flat each time — persistent listings suggest the price (not the market) is what's stuck; bring a comps-based counter.
Risks & watch-outs
- Watch-outs: property tax is 3.0% of price; built in 1911 — expect roof / HVAC / electrical / plumbing capex.
Questions for the listing agent
- It's been on market 56 days. Have you received any prior offers? Is the seller open to a 3% concession, seller financing, or rate buy-down credit?
- Built in 1911 — when were the roof, HVAC, electrical panel, plumbing, and water heater last replaced?
- Property tax is high relative to price — has the assessment been appealed recently, and will the sale trigger a re-assessment?
- Is there a deadline driving the sale (1031 exchange, divorce, estate, relocation)? That informs how much negotiation room exists.
- Crime grade is F in this area — have there been break-ins, vandalism, or insurance claims at this property in the last 3 years? What carrier currently insures it and at what premium?
- What's the average days-on-market for RENTAL listings here right now (not sales)? A rising rental-DOM trend means longer vacancies and softer asking-rent achievability than the comps imply.
- What's the recent tenant-quality profile in this submarket — average credit score on applications, eviction rate, late-payment / NSF rate, and stable-employment percentage? A property-management company in the area should have these aggregated.
- How much new for-sale + rental construction is in the pipeline within 1–3 miles? Heavy new supply typically softens prices + rents 12–24 months out; constrained supply supports both.
Investment metrics
- 1% rule
- 5.33% ✓
- Cap rate
- 46.99%
- Cash-on-cash
- 145.35%
- DSCR
- 7.47
- GRM
- 1.6
CMA / ARV
- ARV (on-the-fly)
- $217,656
- Comps found
- 9
Show comp detail 9 sales within ~0.75 mi
| Address | Dist | Beds/Ba | Sqft | Sold | Price | $/sf | Match |
|---|---|---|---|---|---|---|---|
| 2651 Victor St | 0.18mi | 6/4.0 (+1) | 3,096 (+2%) | 11mo | $125,000 | $40 | 61 |
| 3116 E Linwood Blvd | 0.61mi | 5/1.5 | 2,835 (-6%) | 0mo | $215,000 | $76 | 59 |
| 2600 Benton Blvd | 0.25mi | 5/2.5 | 3,156 (+4%) | 23mo | $250,000 | $79 | 56 |
| 2943 Lockridge St | 0.29mi | 5/3.0 | 3,148 (+4%) | 23mo | $79,000 | $25 | 53 |
| 2524 Benton Blvd | 0.31mi | 4/3.5 (-1) | 3,224 (+7%) | 11mo | $325,000 | $101 | 50 |
| 3208 Lockridge Ave | 0.36mi | 4/2.0 (-1) | 2,774 (-8%) | 17mo | $199,900 | $72 | 46 |
| 3251 E 28th St | 0.47mi | 5/2.5 | 3,410 (+13%) | 12mo | $140,000 | $41 | 41 |
| 3235 Garfield Ave | 0.70mi | 5/2.5 | 3,427 (+13%) | 1mo | $99,000 | $29 | 38 |
| 2121 Benton Blvd | 0.71mi | 6/2.5 (+1) | 2,872 (-5%) | 23mo | $249,500 | $87 | 28 |
Match score weights: distance 35% · size 25% · config 20% · recency 20%. Top-matched comps best support the ARV.
Projected returns pro-forma
10.0% appreciation · 4.65% rent growth · sell at horizon
- IRR
- —
- Equity multiple
- 10.99×
- Total profit
- $111,847
- Equity at exit
- $36,035
- IRR
- —
- Equity multiple
- 25.05×
- Total profit
- $269,349
- Equity at exit
- $77,711
Cash invested: $11,200 (down + closing). Projections, not guarantees.
Landlord ↔ Tenant lean methodology
- Overall (STATE)
- 81 Strongly Landlord-Friendly
- State Missouri
- 81 Strongly Landlord-Friendly · R+10
- County
- — inherits STATE
- City
- — inherits STATE
ZIP-level market 64128
- Home prices YoY
- 21.6%
- Rents YoY
- 4.7%
- Active inventory
- 86
- Price-to-rent
- 1.6×
Monthly cashflow live
- Estimated rent
- $2,131 high interval (Pro) →
- Mortgage (P&I)
- −$210
- Tax from tax record
- −$100 /mo · $1,201/yr
- Insurance
- −$17
- HOA
- −$0
- Vacancy / Maint / Mgmt
- −$447
- Net cashflow
- $1,357
Break-even live
Sensitivity live
| Price | -10% $1,379 | -5% $1,368 | +0% $1,357 | +5% $1,345 | +10% $1,334 |
|---|---|---|---|---|---|
| Rent | -10% $1,188 | -5% $1,272 | +0% $1,357 | +5% $1,441 | +10% $1,525 |
| Rate | -1.0pp $1,377 | -0.5pp $1,367 | base $1,357 | +0.5pp $1,346 | +1.0pp $1,336 |
UW: 25.0% down · 7.5% · 30yr · 1.5% tax · 5.0% vac · 8.0% maint · 8.0% mgmt
Financing live
Cash to close
- Down payment
- $10,000
- Closing costs
- $1,200
- Reserves months
- —
- Total cash needed
- —
Loan-product check · same deal, 3 products live
Conventional
25% down · 7.5% · 30yr
- Down + closing
- —
- Monthly P&I
- —
- Monthly cashflow
- —
- DSCR
- —
- Eligible?
- —
Personal DTI + credit; lowest rate.
DSCR
20% down · 8.5% · 30yr
- Down + closing
- —
- Monthly P&I
- —
- Monthly cashflow
- —
- DSCR
- —
- Eligible?
- —
No personal income docs; deal must DSCR.
Hard money
10% down · 12.0% · 12mo
- Down + closing
- —
- Monthly P&I
- —
- Monthly cashflow
- —
- DSCR
- —
- Eligible?
- —
Short-term bridge; refi at stabilization.
Rent comps 8 comps
| Address | Beds | Baths | Sqft | Rent | $/sqft | DOM | Units | Dist |
|---|---|---|---|---|---|---|---|---|
| 2624 Montgall Ave Kansas City, MO | 4.0 | 3.0 | 3800 | $1,875 | $0.49 | 24d | 1 | 0.14mi |
| 3317 Agnes Ave Kansas City, MO | 5.0 | 2.0 | 2872 | $1,795 | $0.62 | 24d | 1 | 0.76mi |
| 3311 E 19th St Kansas City, MO | 5.0 | 3.0 | 2500 | $2,000 | $0.80 | 44d | 1 | 1.03mi |
| 2436 Forest Ave Kansas City, MO | 5.0 | 4.0 | 2632 | $4,000 | $1.52 | 8d | 1 | 1.06mi |
| 3606 S Benton Ave Kansas City, MO | 5.0 | 3.0 | 2800 | $2,000 | $0.71 | 44d | 1 | 1.11mi |
| 2629 Campbell St Kansas City, MO | 5.0 | 3.0 | 2470 | $3,850 | $1.56 | 13d | 1 | 1.16mi |
| 912 E 31st St Kansas City, MO | 5.0 | 1.5 | 2200 | $1,800 | $0.82 | 16d | 1 | 1.20mi |
| 908 E 31st St Kansas City, MO | 5.0 | 1.5 | 2100 | $1,800 | $0.86 | 44d | 1 | 1.21mi |
Listing history 26 events
-
2026-06-18days on market $40,000 Active 56 DOM
-
2026-06-17days on market $40,000 Active 55 DOM
-
2026-06-16days on market $40,000 Active 54 DOM
-
2026-06-15days on market $40,000 Active 53 DOM
-
2026-06-13days on market $40,000 Active 51 DOM
-
2026-06-09days on market $40,000 Active 47 DOM
-
2026-06-08days on market $40,000 Active 46 DOM
-
2026-06-07days on market $40,000 Active 45 DOM
-
2026-06-05days on market $40,000 Active 42 DOM
-
2026-06-03days on market $40,000 Active 41 DOM
-
2026-06-02days on market $40,000 Active 40 DOM
-
2026-06-02status $40,000 Active 39 DOM
-
2026-03-06status Pending
-
2026-01-26$40,000 Active
-
2021-06-09soldstatus
-
2021-06-04soldstatus Closed 484-char remark
Show marketing remark (484 chars)
3 Story home with 5 Beds, 1.5 baths in KCMO! Minutes from downtown! Gorgeous hardwood floors refinished. Fully updated kitchen is a DREAM featuring new appliances, granite counters, and hardwoods. HUGE master bedroom with enough space to have a sitting area! Updated bathroom with claw foot tub and new flooring! Enjoy coffee out on the enclosed porch or relax in greenroom off the back of the house! Home has private drive with garage! So much character in this home, don't miss out!
-
2021-04-14historical Active Under Contract 484-char remark
Show marketing remark (484 chars)
3 Story home with 5 Beds, 1.5 baths in KCMO! Minutes from downtown! Gorgeous hardwood floors refinished. Fully updated kitchen is a DREAM featuring new appliances, granite counters, and hardwoods. HUGE master bedroom with enough space to have a sitting area! Updated bathroom with claw foot tub and new flooring! Enjoy coffee out on the enclosed porch or relax in greenroom off the back of the house! Home has private drive with garage! So much character in this home, don't miss out!
-
2021-04-09$174,900 Active 484-char remark
Show marketing remark (484 chars)
3 Story home with 5 Beds, 1.5 baths in KCMO! Minutes from downtown! Gorgeous hardwood floors refinished. Fully updated kitchen is a DREAM featuring new appliances, granite counters, and hardwoods. HUGE master bedroom with enough space to have a sitting area! Updated bathroom with claw foot tub and new flooring! Enjoy coffee out on the enclosed porch or relax in greenroom off the back of the house! Home has private drive with garage! So much character in this home, don't miss out!
-
2019-11-27soldstatus
-
2019-07-13historical 484-char remark
Show marketing remark (484 chars)
3 Story home with 5 Beds, 1.5 baths in KCMO! Minutes from downtown! Gorgeous hardwood floors refinished. Fully updated kitchen is a DREAM featuring new appliances, granite counters, and hardwoods. HUGE master bedroom with enough space to have a sitting area! Updated bathroom with claw foot tub and new flooring! Enjoy coffee out on the enclosed porch or relax in greenroom off the back of the house! Home has private drive with garage! So much character in this home, don't miss out!
-
2019-06-12$149,900 Active 484-char remark
Show marketing remark (484 chars)
3 Story home with 5 Beds, 1.5 baths in KCMO! Minutes from downtown! Gorgeous hardwood floors refinished. Fully updated kitchen is a DREAM featuring new appliances, granite counters, and hardwoods. HUGE master bedroom with enough space to have a sitting area! Updated bathroom with claw foot tub and new flooring! Enjoy coffee out on the enclosed porch or relax in greenroom off the back of the house! Home has private drive with garage! So much character in this home, don't miss out!
-
2018-10-11historical
-
2018-09-06price $160,000
-
2018-08-20price $185,000
-
2018-07-10$195,000 Active
-
1996-10-02soldstatus
ⓘ Source: listings_history table (triggers on properties + properties_extension) + one-shot
backfill from property_details.listing_events for pre-trigger history.
Tax reassessment forecast MO · Resets to sale price
- Current annual tax
- $1,201 · $100/mo
- Projected year-2 tax
- $1,201 · $100/mo
- Expected delta
- $0/yr ($0/mo · 0.0%)
ⓘ Screening estimate from a state-policy table — verify with the county assessor before closing.
Climate risk First Street
- Flood 1/10 Low FEMA zone X (unshaded) · 0% chance over 30 yrs
- Wildfire 1/10 Low
- Heat 4/10 Moderate 7 d/yr ≥106°F today · 16 d/yr by 30 yrs out
- Wind 2/10 Low
- Air quality 3/10 Moderate 2 unhealthy d/yr today · 3 by 30 yrs out
Nearby sold comps map
Loading sold comps map…
Walkable amenities ~0.75 mi
Loading nearby amenities…
Taxation est. · year 1
- Rental income
- $25,567
- − Mortgage interest
- −$2,241
- − Property taxes
- −$1,201
- − Insurance
- −$200
- − Repairs & maintenance
- −$2,045
- − Management
- −$2,045
- − Depreciation
- −$1,164
- Taxable income
- $16,671
- Est. tax owed @ 24.0%
- −$4,001
- After-tax cash flow
- $12,278/yr
For passive investors: Depreciation is non-cash, so a rental often shows a tax loss while cash-flowing — sheltering income. Rental losses are passive: they offset passive income freely, and up to $25,000/yr can offset ordinary (W-2) income if you actively participate and your MAGI is under $100k (phasing out to $0 by $150k); unused losses carry forward. On sale, claimed depreciation is recaptured at up to 25%, and gains may owe capital-gains tax (a 1031 exchange can defer both). Figures are a year-1 estimate at your 24.0% rate — not tax advice; consult a CPA.
Schools (NCES district)
- District
- Kansas City 33
- NCES district ID
- 2916400
- Math proficiency
- 12% ▼ -8.00%
- Reading proficiency
- 24% ▬ 0.00%
- Median HH income
- $35,227
- Composite
- 14.8/100
- National rank
- #9387
- State rank
- #308 of 324 in MO
Livability — Kansas City
- Score
- 78/100
- State rank
- #28
- US rank
- #2671
Category grades
Schools grade is shown separately in the Schools card above.
Census & demographics
- Census place
- Kansas City, MO
- County
- Jackson County · 687,798 people
- City population
- 439,467
- Metro
- Kansas City, MO-KS
- Population (ZIP)
- 11,912
- Household income
- $36,088
- Rent vs Own
- Severe rent burden
- 946.0
Population outlook (Jackson County) Hauer SSP2
- Today (2025)
- 719,589 people
- By 2030
- 731,456 · +1.6%
- By 2040
- 746,689 · +3.8%
- By 2050
- 749,289 · +4.1%
- By 2075
- 736,227 · +2.3%
- By 2100
- 668,210 · -7.1%
Race, ethnicity, and origin ACS 2023
- Neighborhood character
- Predominantly Black (79%)
- Race & ethnicity
- Black 79% Hispanic / Latino 9% White 8% Two or more races 7%
- Hispanic origin (detail)
- Mexican 6%
- Common ancestry
- Swedish 1% Hispanic 1%
- Foreign-born
- 7% · Canada
- Languages at home
- 88% English-only · Spanish 7% French/Haitian/Cajun 2%
Political lean MEDSL · Jackson
- 2024 margin
- D (+19.3) · D 58.9% · R 39.5% · Other 1.6%
- 2008→2024 swing
- -6.1pp toward R · 2008: 25.4pp · 2024: 19.3pp
- All cycles
- 2024: D+19.3 2020: D+22.0 2016: D+16.6 2012: D+19.0 2008: D+25.4
Not yet ingested
- Civics
- —
Market trends
- HPI YoY
- ▲ 73.41%
- Current HPI
- 412.6862
- Rent YoY
- ▲ 4.65%
- Metro
- Kansas City, MO-KS
- State GDP YoY
- ▲ 1.84%
- F500 in state
- 20
Industry mix (Fortune 500 HQ in MO)
| Industry | F500 HQs | Revenue |
|---|---|---|
| Healthcare | 1 | $163B |
|
||
| Insurance | 1 | $21B |
|
||
| Industrial Technology | 1 | $17B |
|
||
| Retail | 1 | $16B |
|
||
| Industrial Distribution | 1 | $10B |
|
||
| Utilities | 1 | $9B |
|
||
Price history
-79.5% since first listed14 events — show timeline
- 2026-03-06 Pending — Heartland MLS as Distributed by MLS Grid
- 2026-01-26 Listed $40,000 Heartland MLS as Distributed by MLS Grid
- 2021-06-09 Sold (Public Records) — Public Records
- 2021-06-04 Sold (MLS) — Heartland MLS as Distributed by MLS Grid
- 2021-04-14 Contingent — Heartland MLS as Distributed by MLS Grid
- 2021-04-09 Listed $174,900 Heartland MLS as Distributed by MLS Grid
- 2019-11-27 Sold (Public Records) — Public Records
- 2019-07-13 Listing Removed — Heartland MLS as Distributed by MLS Grid
- 2019-06-12 Listed $149,900 Heartland MLS as Distributed by MLS Grid
- 2018-10-11 Listing Removed — Heartland MLS as Distributed by MLS Grid
- 2018-09-06 Price Changed $160,000 Heartland MLS as Distributed by MLS Grid
- 2018-08-20 Price Changed $185,000 Heartland MLS as Distributed by MLS Grid
- 2018-07-10 Listed $195,000 Heartland MLS as Distributed by MLS Grid
- 1996-10-02 Sold (Public Records) — Public Records
Property tax history
+5.4%/yrLatest (2025): $1,201 · -53.1% YoY. Source: county tax records.
Cash-flow waterfall
monthlySold comps — $/sqft
last 12 mo · ≤1 miLoading sold comps…