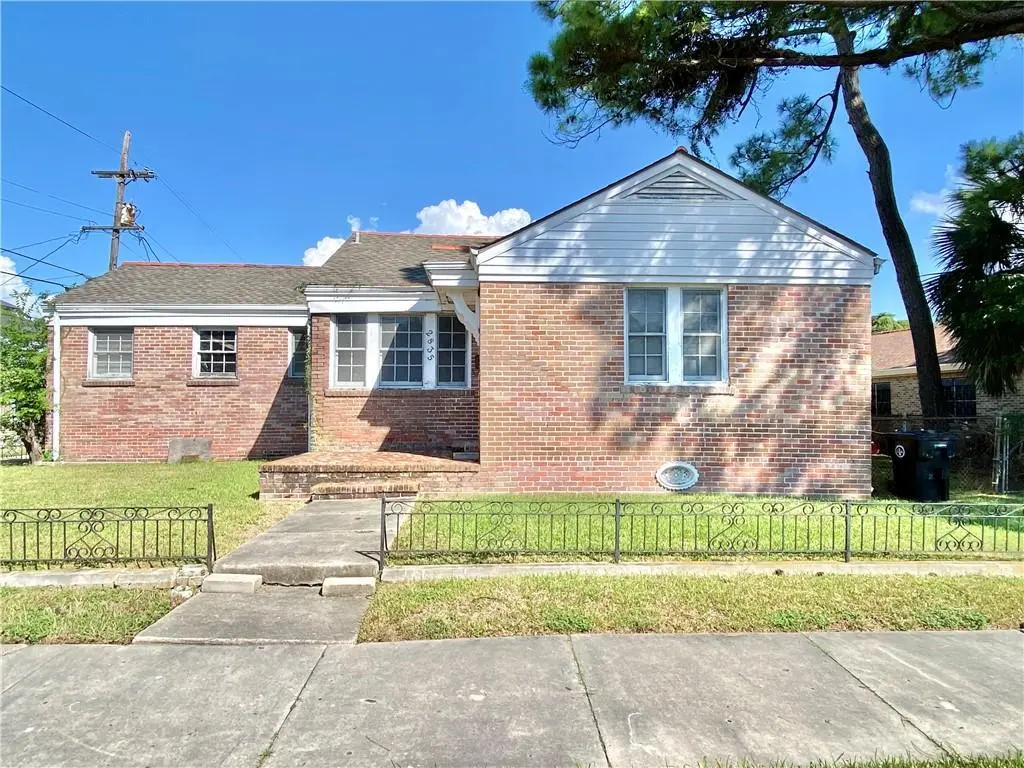
2835 Paris Ave · New Orleans, LA
Flood risk 8/10 · Major
- FEMA flood zone
- X (shaded)
- Chance of flooding over 30 yrs
- 0.6%
- Est. flood insurance / yr
- $507 – $1,088
Fire risk 1/10 · Minimal
- Est. fire insurance / yr
- $1,269 – $2,357
Heat risk 10/10 · Severe
- Hot days now (above 108°F)
- 7 days/yr
- Hot days in 30 yrs
- 21 days/yr
Wind risk 10/10 · Severe
- Chance of severe wind over 30 yrs
- 99.0%
Air-quality risk 4/10 · Minor
- Unhealthy air days now
- 4 days/yr
- Unhealthy air days in 30 yrs
- 4 days/yr
Risk factors via First Street. Map © Google.
Why this score? — see what drove the C grade
The composite is a weighted blend of 9 inputs, each scored 0–100. Each bar is that input's sub-score; the figure is the points it added to the 100-point composite (weight × sub-score).
- Cash flow +19.2/30.0
- ARV discount +15.0/15.0
- DSCR +6.1/10.0
- 1% rule +5.3/10.0
- Livability +4.0/5.0
- Rent growth +2.5/5.0
- Condition / age +2.5/5.0
- Schools +1.6/10.0
- Appreciation +0.0/10.0
$215,000
🖨 Deal sheet 📄 Offer letter ✓ Due diligence
Listing remarks MLS
AMAZING corner lot in the Fairgrounds Neighborhood needing some TLC. 4 bedrooms with 2.5 baths, OFF-STREET PARKING as well as a FENCED yard! EASY access to interstate and the PERFECT proximity to the Fairground for JAZZFEST!
Key facts
- Fenced yard
- Off-street parking
- Corner lot
Tags
Neighborhood map
What this means for you Summary
Snapshot
- This is a 3-bed/1.5-bath single-family listed at $215k.
Deal economics
- At list price, monthly cash flow is $165 ($2k/yr) — positive.
- The deal already cash-flows at list — no discount required.
- Meets the 1% rule at list price ($2k rent vs $215k).
- Recommended offer: $212k (1.5% below list) — sets the bar for market timing.
- Cap rate 7.6% vs local median 4.4% in New Orleans — top-decile yield for the area; either an underpriced asset or a hidden risk that comps aren't pricing in. Stress-test before assuming the spread holds.
Location & tenants
- Location reads 81/100 on livability (#3 in LA, #1,383 nationally) — a professional / high-income tenant draw. Strengths: amenities A+, commute A+, health & safety A+; Watch: crime C-, employment D.
- Orleans Parish (urban): math 11% / reading 27% proficiency, ranked #69 of 98 in LA (top 70%) — low school quality limits family demand, transient renter base, plan for 1-2y turnover; 68% free/reduced lunch — lower-income household profile, screen leases tightly.
- Market conditions: Rents soft (-0.2%/yr); 381 active listings in the ZIP; 40 comparable units currently listed for rent nearby; rentals at typical pace (median 24d on market — plan ~3-4 weeks tenant-placement turnaround); 710 units permitted in Orleans Parish in 2024 (244 in 5+ unit buildings).
- At $2,220/mo this rent would consume 50% of the median local household income ($53k/yr) (locally 3381% of renters already pay >50% of income on rent) — very limited rent-growth headroom before tenants either downsize or default.
Forward outlook
- Local home prices are declining (-3.0%/yr); year-one equity from $1k of loan paydown is wiped out by about $6k of value loss. Plan a longer hold.
- Orleans County population projected at +61% by 2050 — long-run rental-demand tailwind backs the buy-and-hold thesis.
Negotiation context
- It's been on market 20 days — a 2% lower offer ($212k) is reasonable based on typical stale-listing flexibility.
- 6 sale attempts since 2y ago with the ask held roughly flat each time — persistent listings suggest the price (not the market) is what's stuck; bring a comps-based counter.
- Current owner paid $30k; list at $215k implies a 617% gain — meaningful room to come down on a strong offer.
Risks & watch-outs
- Watch-outs: flood insurance adds $66/mo; built in 1940 — expect roof / HVAC / electrical / plumbing capex.
- Climate carrying-cost: severe flood risk; severe wind risk, 99% chance of damaging wind over 30y; extreme-heat days projected 7→21/yr by 2055 (HVAC capex compounding) — expect insurance premiums to compound above CPI over the hold.
Questions for the listing agent
- Built in 1940 — when were the roof, HVAC, electrical panel, plumbing, and water heater last replaced?
- What's the actual annual flood-insurance premium (NFIP or private), and is the property in a SFHA with mandatory coverage?
- Is there a deadline driving the sale (1031 exchange, divorce, estate, relocation)? That informs how much negotiation room exists.
- What's the average days-on-market for RENTAL listings here right now (not sales)? A rising rental-DOM trend means longer vacancies and softer asking-rent achievability than the comps imply.
- What's the recent tenant-quality profile in this submarket — average credit score on applications, eviction rate, late-payment / NSF rate, and stable-employment percentage? A property-management company in the area should have these aggregated.
- How much new for-sale + rental construction is in the pipeline within 1–3 miles? Heavy new supply typically softens prices + rents 12–24 months out; constrained supply supports both.
Investment metrics
- 1% rule
- 1.03% ✓
- Cap rate
- 7.58%
- Cash-on-cash
- 4.61%
- DSCR
- 1.21
- GRM
- 8.1
CMA / ARV
- ARV (median comp)
- $354,164
- List price
- $215,000
- Delta
- -39.29%
- Verdict
- UNDERPRICED
- Comps
- 20 within 1.0 mi
Show comp detail 12 sales within ~0.75 mi
| Address | Dist | Beds/Ba | Sqft | Sold | Price | $/sf | Match |
|---|---|---|---|---|---|---|---|
| 3145 Trafalgar St | 0.28mi | 4/2.5 (+1) | 2,307 (+3%) | 11mo | $568,000 | $246 | 64 |
| 2628 Castiglione St | 0.21mi | 4/2.0 (+1) | 2,168 (-3%) | 17mo | $105,000 | $48 | 64 |
| 1468 N White St | 0.67mi | 3/2.5 | 2,182 (-3%) | 1mo | $786,900 | $361 | 59 |
| 1614 N Dupre St | 0.49mi | 4/3.0 (+1) | 2,230 (-0%) | 8mo | $590,000 | $265 | 59 |
| 2815 A P Tureaud Ave | 0.30mi | 3/3.0 | 2,461 (+10%) | 7mo | $261,500 | $106 | 58 |
| 1723 N Tonti St | 0.55mi | 3/2.0 | 2,020 (-10%) | 2mo | $169,000 | $84 | 54 |
| 2217 Gentilly Blvd | 0.35mi | 3/1.0 | 1,950 (-13%) | 10mo | $326,000 | $167 | 52 |
| 1743 N Dorgenois St | 0.40mi | 3/2.5 | 1,925 (-14%) | 6mo | $420,000 | $218 | 49 |
| 1989 Law St | 0.47mi | 3/2.5 | 2,004 (-10%) | 10mo | $325,000 | $162 | 48 |
| 3390 Desaix Blvd | 0.60mi | 4/3.5 (+1) | 2,254 (+1%) | 16mo | $536,775 | $238 | 44 |
| 3711 Bruxelles St | 0.59mi | 4/2.0 (+1) | 2,060 (-8%) | 10mo | $252,000 | $122 | 44 |
| 1861 Pleasure St | 0.54mi | 4/2.5 (+1) | 1,912 (-15%) | 13mo | $317,500 | $166 | 31 |
Match score weights: distance 35% · size 25% · config 20% · recency 20%. Top-matched comps best support the ARV.
Projected returns pro-forma
-3.0% appreciation · 0.0% rent growth · sell at horizon
- IRR
- -14.7%
- Equity multiple
- 0.49×
- Total profit
- $-30,752
- Equity at exit
- $32,057
- IRR
- -12.5%
- Equity multiple
- 0.37×
- Total profit
- $-38,012
- Equity at exit
- $18,589
Cash invested: $60,200 (down + closing). Projections, not guarantees.
Landlord ↔ Tenant lean methodology
- Overall (STATE)
- 90 Strongly Landlord-Friendly
- State Louisiana
- 90 Strongly Landlord-Friendly · R+12
- County
- — inherits STATE
- City
- — inherits STATE
ZIP-level market 70119
- Home prices YoY
- -34.8%
- Rents YoY
- -0.2%
- Active inventory
- 381
- Price-to-rent
- 8.1×
Monthly cashflow live
- Estimated rent
- $2,220 high interval (Pro) →
- Mortgage (P&I)
- −$1,127
- Tax from tax record
- −$306 /mo · $3,667/yr
- Insurance
- −$90
- Flood insurance flood zone
- −$66 /mo · $798/yr
- HOA
- −$0
- Vacancy / Maint / Mgmt
- −$466
- Net cashflow
- $165
Break-even live
UW: 25.0% down · 7.5% · 30yr · 1.5% tax · 5.0% vac · 8.0% maint · 8.0% mgmt
Financing live
Cash to close
- Down payment
- $53,750
- Closing costs
- $6,450
- Reserves months
- —
- Total cash needed
- —
Loan-product check · same deal, 3 products live
Conventional
25% down · 7.5% · 30yr
- Down + closing
- —
- Monthly P&I
- —
- Monthly cashflow
- —
- DSCR
- —
- Eligible?
- —
Personal DTI + credit; lowest rate.
DSCR
20% down · 8.5% · 30yr
- Down + closing
- —
- Monthly P&I
- —
- Monthly cashflow
- —
- DSCR
- —
- Eligible?
- —
No personal income docs; deal must DSCR.
Hard money
10% down · 12.0% · 12mo
- Down + closing
- —
- Monthly P&I
- —
- Monthly cashflow
- —
- DSCR
- —
- Eligible?
- —
Short-term bridge; refi at stabilization.
Rent comps 40 comps
| Address | Beds | Baths | Sqft | Rent | $/sqft | DOM | Units | Dist |
|---|---|---|---|---|---|---|---|---|
| 2175 N Broad St New Orleans, LA | 2.0 | 1.0 | 1500 | $1,500 | $1.00 | 16d | 1 | 0.18mi |
| 2130 N Broad St New Orleans, LA | 2.0 | 1.0 | 1579 | $1,350 | $0.85 | 24d | 1 | 0.19mi |
| 1901 Gentilly Blvd New Orleans, LA | 3.0 | 2.5 | 2205 | $4,000 | $1.81 | 44d | 1 | 0.23mi |
| 1823 Rosiere St New Orleans, LA | 2.0 | 1.0 | 1400 | $1,450 | $1.04 | 24d | 1 | 0.25mi |
| 1821 Rosiere St New Orleans, LA | 2.0 | 1.0 | 1400 | $1,300 | $0.93 | 24d | 1 | 0.26mi |
| 1933 Industry St New Orleans, LA | 3.0 | 2.0 | 1400 | $1,595 | $1.14 | 16d | 1 | 0.45mi |
| 3607 Havana St New Orleans, LA | 3.0 | 2.0 | 1693 | $1,488 | $0.88 | 17d | 1 | 0.54mi |
| 3702 Trafalgar St New Orleans, LA | 3.0 | 2.0 | 1428 | $2,350 | $1.65 | 16d | 1 | 0.60mi |
| 1831 N Miro St New Orleans, LA | 3.0 | 2.0 | 1882 | $2,500 | $1.33 | 44d | 1 | 0.63mi |
| 1466 N White St New Orleans, LA | 3.0 | 1.5 | 1500 | $2,250 | $1.50 | 3d | 1 | 0.71mi |
| 2664 Lepage St New Orleans, LA | 3.0 | 2.0 | 1750 | $2,725 | $1.56 | 44d | 1 | 0.76mi |
| 2422 Columbus St New Orleans, LA | 2.0 | 2.0 | 1550 | $2,500 | $1.61 | 21d | 1 | 0.78mi |
| 2331 Columbus St New Orleans, LA | 3.0 | 1.0 | 1976 | $1,850 | $0.94 | 24d | 1 | 0.78mi |
| 2920 Pauger St New Orleans, LA | 4.0 | 2.0 | 1882 | $1,995 | $1.06 | 24d | 1 | 0.79mi |
| 3024 Esplanade Ave New Orleans, LA | 3.0 | 2.5 | 2300 | $4,500 | $1.96 | 44d | 1 | 0.87mi |
| 1938 N Johnson St Unit 38 New Orleans, LA | 3.0 | 2.0 | 1844 | $2,400 | $1.30 | 24d | 1 | 0.89mi |
| 1936 N Johnson St Unit 36 New Orleans, LA | 3.0 | 2.0 | 1844 | $2,400 | $1.30 | 24d | 1 | 0.89mi |
| 4111 Jumonville St New Orleans, LA | 3.0 | 2.5 | 1543 | $2,300 | $1.49 | 10d | 1 | 0.91mi |
| 3232 Grand Rte Saint John St New Orleans, LA | 3.0 | 3.0 | 2800 | $5,000 | $1.79 | 24d | 1 | 0.95mi |
| 1486 Mandolin St New Orleans, LA | 3.0 | 2.0 | 1497 | $1,900 | $1.27 | 3d | 1 | 0.98mi |
| 3443 Esplanade Ave New Orleans, LA | 3.0 | 1.0–2.0 | 997 | $2,500 | $2.51 | 3d | 30 | 1.00mi |
| 1837 Touro St New Orleans, LA | 3.0 | 1.0 | 1994 | $2,000 | $1.00 | 24d | 1 | 1.04mi |
| 2107 Elysian Fields Ave New Orleans, LA | 4.0 | 2.0 | 1794 | $1,650 | $0.92 | 3d | 1 | 1.05mi |
| 2731 Saint Philip St Unit 2733 New Orleans, LA | 4.0 | 2.0 | 2000 | $2,600 | $1.30 | 24d | 1 | 1.08mi |
| 3907 Elysian Fields Ave New Orleans, LA | 3.0 | 2.0 | 1652 | $3,000 | $1.82 | 24d | 1 | 1.11mi |
| 914 N Broad St New Orleans, LA | 2.0 | 2.0 | 1450 | $2,200 | $1.52 | 24d | 1 | 1.15mi |
| 2115 Mandeville St New Orleans, LA | 3.0 | 2.0 | 1400 | $1,650 | $1.18 | 24d | 1 | 1.15mi |
| 1434 Annette St New Orleans, LA | 2.0 | 1.0 | 1536 | $1,700 | $1.11 | 3d | 1 | 1.16mi |
| 1434 Annette St New Orleans, LA | 2.0 | 1.0 | 1536 | $1,700 | $1.11 | 3d | 1 | 1.16mi |
| 1433 Esplanade Ave New Orleans, LA | 3.0 | 2.0 | 2411 | $5,000 | $2.07 | 2d | 1 | 1.28mi |
| 1423 N Villere St Unit A New Orleans, LA | 2.0 | 3.0 | 1964 | $2,500 | $1.27 | 44d | 1 | 1.29mi |
| 3100 Orleans Ave New Orleans, LA | 2.0 | 1.0 | 1875 | $1,350 | $0.72 | 24d | 1 | 1.31mi |
| 2228 Arts St New Orleans, LA | 3.0 | 2.0 | 2270 | $1,675 | $0.74 | 3d | 1 | 1.33mi |
| 1245 Kerlerec St New Orleans, LA | 3.0 | 2.0 | 1500 | $2,500 | $1.67 | 44d | 1 | 1.37mi |
| 1247 Kerlerec St New Orleans, LA | 3.0 | 2.0 | 1500 | $2,500 | $1.67 | 44d | 1 | 1.38mi |
| 4815 Warrington Dr New Orleans, LA | 3.0 | 2.0 | 1652 | $2,150 | $1.30 | 16d | 1 | 1.39mi |
| 4727 Saint Bernard Ave New Orleans, LA | 3.0 | 2.0 | 2000 | $2,000 | $1.00 | 16d | 1 | 1.41mi |
| 3700 Orleans Ave New Orleans, LA | 1.0–3.0 | 1.0–2.0 | 1081 | $2,945 | $2.72 | 3d | 48 | 1.47mi |
| 1136 Frenchmen St New Orleans, LA | 2.0 | 1.0 | 1800 | $1,650 | $0.92 | 24d | 1 | 1.47mi |
| 3718 Franklin Ave New Orleans, LA | 2.0 | 1.0 | 1601 | $1,800 | $1.12 | 12d | 1 | 1.50mi |
Listing history 25 events
-
2026-06-18days on market $215,000 Active 20 DOM
-
2026-06-17days on market $215,000 Active 19 DOM
-
2026-06-16days on market $215,000 Active 18 DOM
-
2026-06-15days on market $215,000 Active 17 DOM
-
2026-06-13days on market $215,000 Active 15 DOM
-
2026-06-10days on market $215,000 Active 12 DOM
-
2026-06-09days on market $215,000 Active 11 DOM
-
2026-06-08days on market $215,000 Active 10 DOM
-
2026-06-07days on market $215,000 Active 9 DOM
-
2026-06-05days on market $215,000 Active 6 DOM
-
2026-06-03days on market $215,000 Active 5 DOM
-
2026-06-02days on market $215,000 Active 4 DOM
-
2026-06-01days on market $215,000 Active 3 DOM
-
2026-05-31days on market $215,000 Active 2 DOM
-
2026-05-14status Pending 224-char remark
Show marketing remark (224 chars)
AMAZING corner lot in the Fairgrounds Neighborhood needing some TLC. 4 bedrooms with 2.5 baths, OFF-STREET PARKING as well as a FENCED yard! EASY access to interstate and the PERFECT proximity to the Fairground for JAZZFEST!
-
2026-05-14historical Active Under Contract 224-char remark
Show marketing remark (224 chars)
AMAZING corner lot in the Fairgrounds Neighborhood needing some TLC. 4 bedrooms with 2.5 baths, OFF-STREET PARKING as well as a FENCED yard! EASY access to interstate and the PERFECT proximity to the Fairground for JAZZFEST!
-
2026-02-19$215,000 Active 224-char remark
Show marketing remark (224 chars)
AMAZING corner lot in the Fairgrounds Neighborhood needing some TLC. 4 bedrooms with 2.5 baths, OFF-STREET PARKING as well as a FENCED yard! EASY access to interstate and the PERFECT proximity to the Fairground for JAZZFEST!
-
2026-01-16$215,000 Active
-
2025-10-09$225,000 Active
-
2025-03-06$245,000 Active
-
2024-12-17price $245,000
-
2024-12-16price $245,000
-
2024-09-26$255,000 Active
-
1992-02-07soldstatus $30,000
ⓘ Source: listings_history table (triggers on properties + properties_extension) + one-shot
backfill from property_details.listing_events for pre-trigger history.
Tax reassessment forecast LA · Resets to sale price
- Current annual tax
- $3,667 · $306/mo
- Projected year-2 tax
- $3,667 · $306/mo
- Expected delta
- $0/yr ($0/mo · 0.0%)
ⓘ Screening estimate from a state-policy table — verify with the county assessor before closing.
Climate risk First Street
- Flood 8/10 Severe FEMA zone X (shaded) · 60% chance over 30 yrs
- Wildfire 1/10 Low
- Heat 10/10 Extreme 7 d/yr ≥108°F today · 21 d/yr by 30 yrs out
- Wind 10/10 Extreme 99% chance of damaging wind over 30 yrs
- Air quality 4/10 Moderate 4 unhealthy d/yr today · 4 by 30 yrs out
Nearby sold comps map
Loading sold comps map…
Walkable amenities ~0.75 mi
Loading nearby amenities…
Taxation est. · year 1
- Rental income
- $26,641
- − Mortgage interest
- −$12,043
- − Property taxes
- −$3,667
- − Insurance
- −$1,872
- − Repairs & maintenance
- −$2,131
- − Management
- −$2,131
- − Depreciation
- −$6,255
- Taxable loss
- −$1,458
- Est. tax savings @ 24.0%
- +$350
- After-tax cash flow
- $2,328/yr
For passive investors: Depreciation is non-cash, so a rental often shows a tax loss while cash-flowing — sheltering income. Rental losses are passive: they offset passive income freely, and up to $25,000/yr can offset ordinary (W-2) income if you actively participate and your MAGI is under $100k (phasing out to $0 by $150k); unused losses carry forward. On sale, claimed depreciation is recaptured at up to 25%, and gains may owe capital-gains tax (a 1031 exchange can defer both). Figures are a year-1 estimate at your 24.0% rate — not tax advice; consult a CPA.
Schools (NCES district)
- District
- Orleans Parish
- NCES district ID
- 2201170
- Math proficiency
- 11% ▼ -52.00%
- Reading proficiency
- 27% ▼ -46.00%
- Median HH income
- $37,011
- Composite
- 15.78/100
- National rank
- #9271
- State rank
- #69 of 98 in LA
Livability — New Orleans
- Score
- 81/100
- State rank
- #3
- US rank
- #1383
Category grades
Schools grade is shown separately in the Schools card above.
Census & demographics
- Census place
- New Orleans, LA
- County
- Orleans Parish · 338,817 people
- City population
- 338,817
- Metro
- New Orleans-Metairie, LA
- Population (ZIP)
- 37,253
- Household income
- $53,143
- Rent vs Own
- Severe rent burden
- 3381.0
Population outlook (Orleans County) Hauer SSP2
- Today (2025)
- 513,025 people
- By 2030
- 575,781 · +12.2%
- By 2040
- 700,174 · +36.5%
- By 2050
- 826,541 · +61.1%
- By 2075
- 1,123,374 · +119.0%
- By 2100
- 1,355,609 · +164.2%
Race, ethnicity, and origin ACS 2023
- Neighborhood character
- Diverse neighborhood (Simpson 0.64)
- Race & ethnicity
- Black 44% White 40% Two or more races 10% Hispanic / Latino 9% Asian 1%
- Hispanic origin (detail)
- Mexican 2%
- Common ancestry
- Lithuanian 8% Slovak 2% Romanian 1%
- Foreign-born
- 6% · Canada, Jamaica
- Languages at home
- 91% English-only · Spanish 6% French/Haitian/Cajun 1% Other Indo-European 0%
Political lean MEDSL · Orleans
- 2024 margin
- Solid D (+67.0) · D 82.2% · R 15.2% · Other 2.7%
- 2008→2024 swing
- +6.7pp toward D · 2008: 60.3pp · 2024: 67.0pp
- All cycles
- 2024: D+67.0 2020: D+68.2 2016: D+66.2 2012: D+62.5 2008: D+60.3
Not yet ingested
- Civics
- —
Market trends
- HPI YoY
- ▼ -135.38%
- Current HPI
- 253.1929
- Rent YoY
- ▼ -0.20%
- Metro
- New Orleans-Metairie, LA
- State GDP YoY
- ▲ 3.29%
- F500 in state
- 10
Industry mix (Fortune 500 HQ in LA)
| Industry | F500 HQs | Revenue |
|---|---|---|
| Telecommunications | 2 | $23B |
|
||
| Utilities | 1 | $12B |
|
||
| Wholesale / Distribution | 1 | $5B |
|
||
| Advertising | 1 | $2B |
|
||
Price history
+616.7% since first listed11 events — show timeline
- 2026-05-14 Pending — AcadianaMLS
- 2026-05-14 Contingent — GSREIN
- 2026-02-19 Listed $215,000 GSREIN
- 2026-02-19 Listed $215,000 AcadianaMLS
- 2026-01-16 Listed $215,000 AcadianaMLS
- 2025-10-09 Listed $225,000 AcadianaMLS
- 2025-03-06 Listed $245,000 AcadianaMLS
- 2024-12-17 Price Changed $245,000 AcadianaMLS
- 2024-12-16 Price Changed $245,000 GSREIN
- 2024-09-26 Listed $255,000 AcadianaMLS
- 1992-02-07 Sold (Public Records) $30,000 Public Records
Property tax history
+39.3%/yrLatest (2026): $3,667 · +1.1% YoY. Source: county tax records.
Cash-flow waterfall
monthlySold comps — $/sqft
last 12 mo · ≤1 miLoading sold comps…