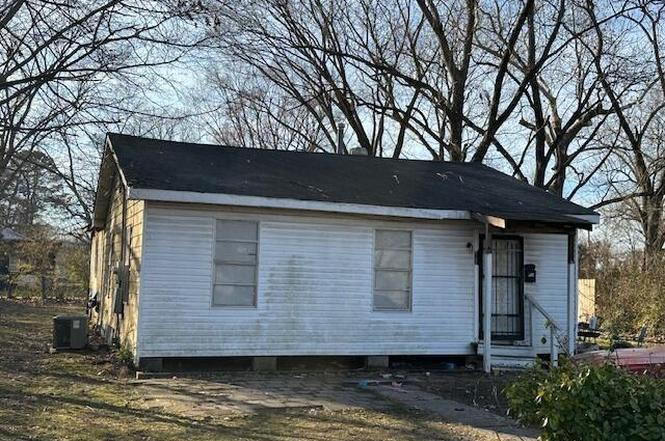
812 Eagle St · Lonoke, AR
Flood risk 1/10 · Minimal
- FEMA flood zone
- X (unshaded)
- Chance of flooding over 30 yrs
- 0.0%
- Est. flood insurance / yr
- $507 – $1,088
Fire risk 1/10 · Minimal
- Est. fire insurance / yr
- $1,499 – $2,785
Heat risk 7/10 · Major
- Hot days now (above 110°F)
- 7 days/yr
- Hot days in 30 yrs
- 20 days/yr
Wind risk 4/10 · Minor
- Chance of severe wind over 30 yrs
- 10.0%
Air-quality risk 2/10 · Minimal
- Unhealthy air days now
- 1 days/yr
- Unhealthy air days in 30 yrs
- 1 days/yr
Risk factors via First Street. Map © Google.
Why this score? — see what drove the C grade
The composite is a weighted blend of 9 inputs, each scored 0–100. Each bar is that input's sub-score; the figure is the points it added to the 100-point composite (weight × sub-score).
- Cash flow +30.0/30.0
- DSCR +10.0/10.0
- 1% rule +9.1/10.0
- Livability +3.2/5.0
- Schools +2.6/10.0
- Rent growth +2.5/5.0
- Condition / age +2.5/5.0
- ARV discount +0.0/15.0
- Appreciation +0.0/10.0
$83,000
🖨 Deal sheet 📄 Offer letter ✓ Due diligence
Listing remarks
Great investment property * * * * AGENTS SEE REMARKS * * * *
Key facts
- 8,712 sq ft lot
- Built 1950
- Listed 52 days
Property features AI
Finance
- Other: Approximate lot dimensions 72 x 120 (0.2 acres); Square footage source: tax records
- Financial info: Financing available: conventional loan or cash
Exterior
- Parking: Parking pads
- Utilities: Public sewer; Public water; Municipal electric (Entergy)
- Home design: Frame construction
- Construction: Frame exterior; Crawl space foundation; Composition roof
- Exterior features: Level lot in a subdivision; Inside city limits; Paved road access
Interior
- Kitchen: Kitchen equipment listed as other (see remarks)
- Flooring: Carpet; Vinyl
- Bathrooms: 2 full bathrooms
- Heating & cooling: Central electric heating; Central electric cooling
- Interior features: Carpet and vinyl flooring; Kitchen equipment noted as 'Other (See Remarks)'
Neighborhood map
What this means for you Summary
Snapshot
- This is a 3-bed/2.0-bath single-family listed at $83k.
Deal economics
- At list price, monthly cash flow is $414 ($5k/yr) — positive.
- The deal already cash-flows at list — no discount required.
- Meets the 1% rule at list price ($1k rent vs $83k).
- Recommended offer: $81k (3.0% below list) — sets the bar for market timing.
- Cap rate 12.3% vs local median 5.7% in Lonoke — top-decile yield for the area; either an underpriced asset or a hidden risk that comps aren't pricing in. Stress-test before assuming the spread holds.
Location & tenants
- Location reads 63/100 on livability (#195 in AR) — a middle-class / working-renter tenant base. Strengths: cost of living A+, health & safety A, housing A-; Watch: schools F, crime F, amenities F.
- Lonoke School District (town): math 30% / reading 31% proficiency, ranked #146 of 238 in AR (top 61%) — families likely to look elsewhere, expect single-tenant / working-renter base with shorter leases.
- Market conditions: 61 active listings in the ZIP; 5 comparable units currently listed for rent nearby; rentals lingering (median 44d on market — plan ~5-8 weeks vacancy on turnover, expect pricing pressure); 80% of comp listings sitting > 30 days — soft ceiling on asking rent; 185 units permitted in Lonoke County in 2024 (0 in 5+ unit buildings).
Forward outlook
- Local home prices are declining (-3.0%/yr); year-one equity from $574 of loan paydown is wiped out by about $2k of value loss. Plan a longer hold.
- Lonoke County population projected at +12% by 2050 — modest demand growth; plan on rents tracking national, not racing it.
- At projected returns (-3.0% appreciation + 3.0% rent growth), your $23k cash investment doubles in ~6 years — after that, you're playing with house money.
Negotiation context
- It's been on market 52 days — a 3% lower offer ($81k) is reasonable based on typical stale-listing flexibility.
- Current owner paid $15k; list at $83k implies a 453% gain — meaningful room to come down on a strong offer.
Risks & watch-outs
- Watch-outs: built in 1950 — expect roof / HVAC / electrical / plumbing capex.
- Climate carrying-cost: extreme-heat days projected 7→20/yr by 2055 (HVAC capex compounding) — expect insurance premiums to compound above CPI over the hold.
Questions for the listing agent
- It's been on market 52 days. Have you received any prior offers? Is the seller open to a 3% concession, seller financing, or rate buy-down credit?
- Built in 1950 — when were the roof, HVAC, electrical panel, plumbing, and water heater last replaced?
- Is there a deadline driving the sale (1031 exchange, divorce, estate, relocation)? That informs how much negotiation room exists.
- Schools are F-rated, which usually means shorter tenancies and higher turnover. Who's the typical renter profile here, and what's been the actual vacancy rate?
- Crime grade is F in this area — have there been break-ins, vandalism, or insurance claims at this property in the last 3 years? What carrier currently insures it and at what premium?
- What's the average days-on-market for RENTAL listings here right now (not sales)? A rising rental-DOM trend means longer vacancies and softer asking-rent achievability than the comps imply.
- What's the recent tenant-quality profile in this submarket — average credit score on applications, eviction rate, late-payment / NSF rate, and stable-employment percentage? A property-management company in the area should have these aggregated.
- How much new for-sale + rental construction is in the pipeline within 1–3 miles? Heavy new supply typically softens prices + rents 12–24 months out; constrained supply supports both.
Investment metrics
- 1% rule
- 1.41% ✓
- Cap rate
- 12.28%
- Cash-on-cash
- 21.40%
- DSCR
- 1.95
- GRM
- 5.9
CMA / ARV
- ARV (on-the-fly)
- $59,328
- Comps found
- 12
Show comp detail 12 sales within ~0.75 mi
| Address | Dist | Beds/Ba | Sqft | Sold | Price | $/sf | Match |
|---|---|---|---|---|---|---|---|
| 812 Eagle St | 0.00mi | 3/2.0 | 1,236 (0%) | 0mo | $20,000 | $16 | 100 |
| 110 Lynn Ln | 0.30mi | 3/2.0 | 1,237 (+0%) | 1mo | $150,000 | $121 | 85 |
| 521 E 8th St | 0.18mi | 3/2.0 | 1,220 (-1%) | 10mo | $158,000 | $130 | 81 |
| 405 E 7th St | 0.10mi | 3/1.0 | 1,118 (-10%) | 0mo | $9,000 | $8 | 75 |
| 620 Eagle St | 0.10mi | 3/1.0 | 1,392 (+13%) | 7mo | $35,000 | $25 | 64 |
| 2015 Dismukes St | 0.51mi | 3/1.0 | 1,208 (-2%) | 6mo | $21,000 | $17 | 63 |
| 220 Wright St | 0.33mi | 2/1.0 (-1) | 1,162 (-6%) | 4mo | $135,000 | $116 | 62 |
| 218 W 8th St | 0.26mi | 3/1.0 | 1,379 (+12%) | 4mo | $48,000 | $35 | 62 |
| 428 E 4th St | 0.26mi | 2/2.0 (-1) | 1,401 (+13%) | 0mo | $67,000 | $48 | 60 |
| 420 Frank T Bunton St | 0.72mi | 3/1.0 | 1,200 (-3%) | 0mo | $20,000 | $17 | 57 |
| 818 Church St | 0.35mi | 3/1.0 | 1,350 (+9%) | 13mo | $115,000 | $85 | 54 |
| 4 Lynn Cv | 0.50mi | 3/1.5 | 1,072 (-13%) | 13mo | $137,500 | $128 | 42 |
Match score weights: distance 35% · size 25% · config 20% · recency 20%. Top-matched comps best support the ARV.
Projected returns pro-forma
-3.0% appreciation · 3.0% rent growth · sell at horizon
- IRR
- 13.9%
- Equity multiple
- 1.56×
- Total profit
- $12,919
- Equity at exit
- $12,376
- IRR
- 22.7%
- Equity multiple
- 2.94×
- Total profit
- $45,139
- Equity at exit
- $7,176
Cash invested: $23,240 (down + closing). Projections, not guarantees.
Landlord ↔ Tenant lean methodology
- Overall (STATE)
- 92 Strongly Landlord-Friendly
- State Arkansas
- 92 Strongly Landlord-Friendly · R+14
- County
- — inherits STATE
- City
- — inherits STATE
ZIP-level market 72086
- Home prices YoY
- -18.4%
- Active inventory
- 61
- Price-to-rent
- 5.9×
Monthly cashflow live
- Estimated rent
- $1,167 high interval (Pro) →
- Mortgage (P&I)
- −$435
- Tax from tax record
- −$37 /mo · $450/yr
- Insurance
- −$35
- HOA
- −$0
- Vacancy / Maint / Mgmt
- −$245
- Net cashflow
- $414
Break-even live
UW: 25.0% down · 7.5% · 30yr · 1.5% tax · 5.0% vac · 8.0% maint · 8.0% mgmt
Financing live
Cash to close
- Down payment
- $20,750
- Closing costs
- $2,490
- Reserves months
- —
- Total cash needed
- —
Loan-product check · same deal, 3 products live
Conventional
25% down · 7.5% · 30yr
- Down + closing
- —
- Monthly P&I
- —
- Monthly cashflow
- —
- DSCR
- —
- Eligible?
- —
Personal DTI + credit; lowest rate.
DSCR
20% down · 8.5% · 30yr
- Down + closing
- —
- Monthly P&I
- —
- Monthly cashflow
- —
- DSCR
- —
- Eligible?
- —
No personal income docs; deal must DSCR.
Hard money
10% down · 12.0% · 12mo
- Down + closing
- —
- Monthly P&I
- —
- Monthly cashflow
- —
- DSCR
- —
- Eligible?
- —
Short-term bridge; refi at stabilization.
Rent comps 5 comps
| Address | Beds | Baths | Sqft | Rent | $/sqft | DOM | Units | Dist |
|---|---|---|---|---|---|---|---|---|
| 700 Barnes St Lonoke, AR | 3.0 | 1.5 | 1204 | $1,350 | $1.12 | 44d | 1 | 0.12mi |
| 412 E 3rd St Unit 5 Lonoke, AR | 2.0 | 1.0 | 900 | $800 | $0.89 | 23d | 1 | 0.34mi |
| 412 E 3rd St Unit 3 Lonoke, AR | 2.0 | 1.0 | 900 | $800 | $0.89 | 44d | 1 | 0.34mi |
| 311 E Cherry St Lonoke, AR | 2.0 | 1.0 | 880 | $1,080 | $1.23 | 44d | 1 | 0.92mi |
| 112 E Palm St Lonoke, AR | 3.0 | 2.0 | 1218 | $1,350 | $1.11 | 44d | 1 | 0.96mi |
Listing history 3 events
-
2026-04-13status Under Contract
-
2026-02-20$83,000 New Listing
-
1979-06-26soldstatus $15,000
ⓘ Source: listings_history table (triggers on properties + properties_extension) + one-shot
backfill from property_details.listing_events for pre-trigger history.
Tax reassessment forecast AR · Resets to sale price
- Current annual tax
- $450 · $37/mo
- Projected year-2 tax
- $531 · $44/mo
- Expected delta
- +$82/yr (+$7/mo · 18.2%)
ⓘ Screening estimate from a state-policy table — verify with the county assessor before closing.
Climate risk First Street
- Flood 1/10 Low FEMA zone X (unshaded) · 0% chance over 30 yrs
- Wildfire 1/10 Low
- Heat 7/10 Severe 7 d/yr ≥110°F today · 20 d/yr by 30 yrs out
- Wind 4/10 Moderate 10% chance of damaging wind over 30 yrs
- Air quality 2/10 Low 1 unhealthy d/yr today · 1 by 30 yrs out
Nearby sold comps map
Loading sold comps map…
Walkable amenities ~0.75 mi
Loading nearby amenities…
Taxation est. · year 1
- Rental income
- $14,000
- − Mortgage interest
- −$4,649
- − Property taxes
- −$450
- − Insurance
- −$415
- − Repairs & maintenance
- −$1,120
- − Management
- −$1,120
- − Depreciation
- −$2,415
- Taxable income
- $3,832
- Est. tax owed @ 24.0%
- −$920
- After-tax cash flow
- $4,053/yr
For passive investors: Depreciation is non-cash, so a rental often shows a tax loss while cash-flowing — sheltering income. Rental losses are passive: they offset passive income freely, and up to $25,000/yr can offset ordinary (W-2) income if you actively participate and your MAGI is under $100k (phasing out to $0 by $150k); unused losses carry forward. On sale, claimed depreciation is recaptured at up to 25%, and gains may owe capital-gains tax (a 1031 exchange can defer both). Figures are a year-1 estimate at your 24.0% rate — not tax advice; consult a CPA.
Schools (NCES district)
- District
- Lonoke School District
- NCES district ID
- 0509060
- Math proficiency
- 30% ▼ -10.00%
- Reading proficiency
- 31% ▼ -2.00%
- Median HH income
- $46,440
- Composite
- 26.28/100
- National rank
- #7247
- State rank
- #146 of 238 in AR
Livability — Lonoke
- Score
- 63/100
- State rank
- #195
- US rank
- #15446
Category grades
Schools grade is shown separately in the Schools card above.
Census & demographics
- Census place
- Lonoke, AR
- Population (ZIP)
- 12,250
Population outlook (Lonoke County) Hauer SSP2
- Today (2025)
- 78,072 people
- By 2030
- 80,673 · +3.3%
- By 2040
- 84,977 · +8.8%
- By 2050
- 87,778 · +12.4%
- By 2075
- 91,398 · +17.1%
- By 2100
- 87,858 · +12.5%
Race, ethnicity, and origin ACS 2023
- Neighborhood character
- Predominantly White (79%)
- Race & ethnicity
- White 79% Black 10% Hispanic / Latino 6% Two or more races 5%
- Hispanic origin (detail)
- Mexican 6%
- Common ancestry
- Lithuanian 1% Portuguese 1% Slovak 1%
- Foreign-born
- 4% · Canada
- Languages at home
- 94% English-only · Spanish 5% Other Asian/Pacific 1%
Political lean MEDSL · Lonoke
- 2024 margin
- Solid R (+53.7) · D 22.2% · R 75.8% · Other 2.0%
- 2008→2024 swing
- -6.2pp toward R · 2008: -47.5pp · 2024: -53.7pp
- All cycles
- 2024: R+53.7 2020: R+52.8 2016: R+53.3 2012: R+50.9 2008: R+47.5
Not yet ingested
- Civics
- —
Market trends
- HPI YoY
- ▼ -44.46%
- Current HPI
- 197.6009
- Rent YoY
- —
- Metro
- —
- State GDP YoY
- ▲ 3.80%
- F500 in state
- 10
Industry mix (Fortune 500 HQ in AR)
| Industry | F500 HQs | Revenue |
|---|---|---|
| Retail | 1 | $681B |
|
||
| Food / Agriculture | 1 | $53B |
|
||
| Retail / Energy | 1 | $22B |
|
||
| Transportation / Logistics | 1 | $12B |
|
||
| Energy | 1 | $4B |
|
||
Price history
+453.3% since first listed3 events — show timeline
- 2026-04-13 Pending — CARMLS
- 2026-02-20 Listed $83,000 CARMLS
- 1979-06-26 Sold (Public Records) $15,000 Public Records
Property tax history
+0.9%/yrLatest (2025): $450 · +0.0% YoY. Source: county tax records.
Cash-flow waterfall
monthlySold comps — $/sqft
last 12 mo · ≤1 miLoading sold comps…