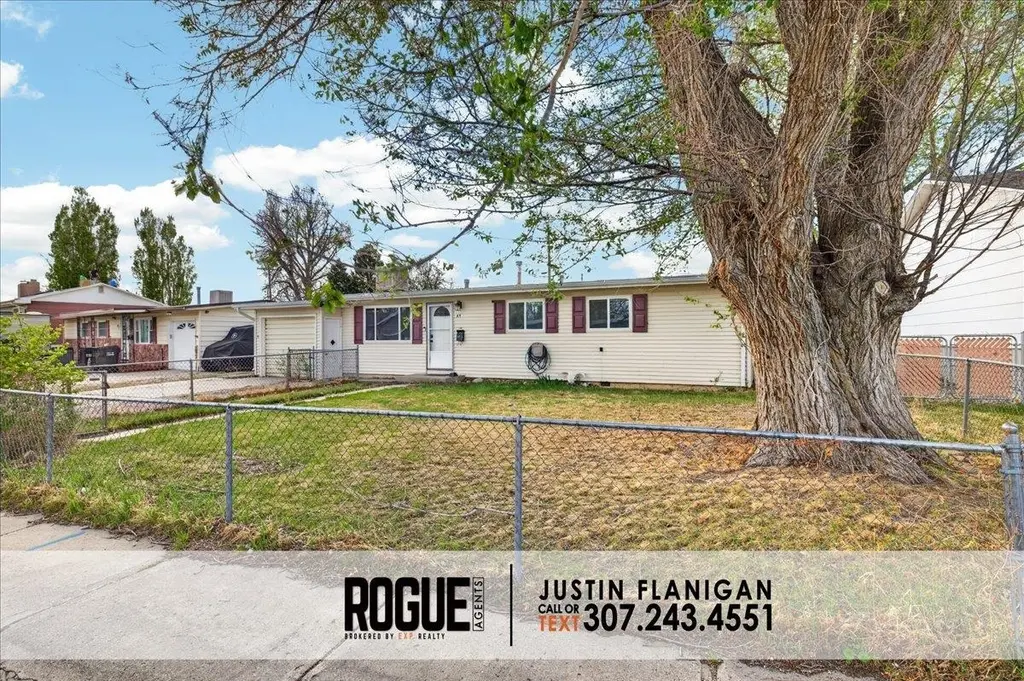
45 Gardenia · Casper, WY
Flood risk 1/10 · Minimal
- FEMA flood zone
- X (unshaded)
- Chance of flooding over 30 yrs
- 0.0%
- Est. flood insurance / yr
- $507 – $1,088
Fire risk 6/10 · Moderate
- Est. fire insurance / yr
- $564 – $1,046
Heat risk 3/10 · Minor
- Hot days now (above 91°F)
- 7 days/yr
- Hot days in 30 yrs
- 19 days/yr
Wind risk 1/10 · Minimal
- Chance of severe wind over 30 yrs
- —
Air-quality risk 2/10 · Minimal
- Unhealthy air days now
- 1 days/yr
- Unhealthy air days in 30 yrs
- 2 days/yr
Risk factors via First Street. Map © Google.
Why this score? — see what drove the D- grade
The composite is a weighted blend of 9 inputs, each scored 0–100. Each bar is that input's sub-score; the figure is the points it added to the 100-point composite (weight × sub-score).
- Cash flow +10.2/30.0
- ARV discount +9.4/15.0
- Schools +4.2/10.0
- Livability +3.9/5.0
- DSCR +2.9/10.0
- Rent growth +2.5/5.0
- Condition / age +2.5/5.0
- 1% rule +1.8/10.0
- Appreciation +0.0/10.0
$239,000
🖨 Deal sheet 📄 Offer letter ✓ Due diligence
Key facts
- 5,820 sq ft lot
- Garage
- Built 1959
Property features AI
Exterior
- Parking: Attached garage with garage door opener; 1-car garage
- Utilities: Public water; Natural gas available
- Home design: Single-family residential property
- Construction: Vinyl siding
- Exterior features: Chain link fencing
Interior
- Kitchen: Dishwasher; Range; Oven; Refrigerator
- Flooring: Carpet; Hardwood; Vinyl
- Heating & cooling: Forced air heating
- Interior features: Dishwasher; Dryer; Refrigerator; Range; Oven; Washer
- Laundry & utility: Washer; Dryer
Neighborhood map
What this means for you Summary
Snapshot
- This is a 3-bed/1.0-bath single-family listed at $239k.
Deal economics
- At list price, monthly cash flow is $-135 ($-2k/yr) — negative.
- To cash-flow at today's rent, offer at most $215k (10.0% below list).
- To meet the 1% rule (rent ≥ 1% of price), the offer needs to be $161k (32.5% below list).
- Recommended offer: $161k (32.5% below list) — sets the bar for 1% rule.
- Cap rate 5.6% vs local median 3.0% in Casper — top-decile yield for the area; either an underpriced asset or a hidden risk that comps aren't pricing in. Stress-test before assuming the spread holds.
Location & tenants
- Location reads 78/100 on livability (#8 in WY, #2,629 nationally) — a middle-class / working-renter tenant base. Strengths: commute A+, cost of living A+, housing A+; Watch: amenities D, health & safety F.
- Natrona County School District #1 (urban): math 44% / reading 52% proficiency, ranked #32 of 41 in WY (top 78%) — families likely to look elsewhere, expect single-tenant / working-renter base with shorter leases.
- Market conditions: 203 active listings in the ZIP; solid renter incomes; 310 units permitted in Natrona County in 2024 (104 in 5+ unit buildings).
Forward outlook
- Local home prices are declining (-3.0%/yr); year-one equity from $2k of loan paydown is wiped out by about $7k of value loss. Plan a longer hold.
- Natrona County population projected at +46% by 2050 — long-run rental-demand tailwind backs the buy-and-hold thesis.
Negotiation context
- It's been on market 21 days — a 2% lower offer ($235k) is reasonable based on typical stale-listing flexibility.
- 4 sale attempts since 13y ago with the ask held roughly flat each time — persistent listings suggest the price (not the market) is what's stuck; bring a comps-based counter.
Risks & watch-outs
- Watch-outs: built in 1959 — expect roof / HVAC / electrical / plumbing capex.
- Climate carrying-cost: major wildfire risk — expect insurance premiums to compound above CPI over the hold.
Questions for the listing agent
- What do current leases actually rent for vs. the listed asking? Can we see a recent rent roll and the last 12 months of T-12 income?
- Built in 1959 — when were the roof, HVAC, electrical panel, plumbing, and water heater last replaced?
- Is there a deadline driving the sale (1031 exchange, divorce, estate, relocation)? That informs how much negotiation room exists.
- The area grade is low — what's the realistic commute time and amenity access for the typical tenant pool here? Any planned neighborhood developments (good or bad) we should know about?
- What's the average days-on-market for RENTAL listings here right now (not sales)? A rising rental-DOM trend means longer vacancies and softer asking-rent achievability than the comps imply.
- What's the recent tenant-quality profile in this submarket — average credit score on applications, eviction rate, late-payment / NSF rate, and stable-employment percentage? A property-management company in the area should have these aggregated.
- How much new for-sale + rental construction is in the pipeline within 1–3 miles? Heavy new supply typically softens prices + rents 12–24 months out; constrained supply supports both.
Investment metrics
- 1% rule
- 0.68% ✗
- Cap rate
- 5.61%
- Cash-on-cash
- -2.42%
- DSCR
- 0.89
- GRM
- 12.3
CMA / ARV
- ARV (on-the-fly)
- $249,435
- Comps found
- 12
Show comp detail 12 sales within ~0.75 mi
| Address | Dist | Beds/Ba | Sqft | Sold | Price | $/sf | Match |
|---|---|---|---|---|---|---|---|
| 42 Honeysuckle St | 0.29mi | 3/1.0 | 1,008 (-3%) | 1mo | $245,000 | $243 | 81 |
| 13 Gardenia St | 0.10mi | 3/1.0 | 1,056 (+2%) | 19mo | $195,000 | $185 | 76 |
| 11 Jonquil | 0.43mi | 3/1.0 | 1,000 (-3%) | 1mo | $240,000 | $240 | 74 |
| 25 Marigold St | 0.20mi | 2/1.0 (-1) | 1,040 (+0%) | 15mo | $230,000 | $221 | 72 |
| 50 Honeysuckle | 0.29mi | 3/1.0 | 1,008 (-3%) | 13mo | $245,000 | $243 | 72 |
| 16 Honeysuckle St | 0.28mi | 3/1.0 | 1,008 (-3%) | 14mo | $265,000 | $263 | 71 |
| 93 Honeysuckle St | 0.38mi | 3/1.0 | 1,000 (-3%) | 9mo | $245,000 | $245 | 69 |
| 38 Riverbend Rd | 0.43mi | 3/1.0 | 1,008 (-3%) | 12mo | $243,000 | $241 | 65 |
| 102 Honeysuckle St | 0.42mi | 3/1.0 | 980 (-5%) | 15mo | $220,000 | $224 | 59 |
| 78 Jasmine St | 0.47mi | 3/1.2 | 1,142 (+10%) | 12mo | $279,900 | $245 | 50 |
| 2202 Jonquil St | 0.50mi | 3/2.0 | 1,104 (+7%) | 16mo | $259,900 | $235 | 48 |
| 126 Honeysuckle | 0.49mi | 3/1.0 | 960 (-7%) | 21mo | $209,900 | $219 | 48 |
Match score weights: distance 35% · size 25% · config 20% · recency 20%. Top-matched comps best support the ARV.
Projected returns pro-forma
-3.0% appreciation · 3.0% rent growth · sell at horizon
- IRR
- -20.4%
- Equity multiple
- 0.29×
- Total profit
- $-47,460
- Equity at exit
- $35,636
- IRR
- -13.7%
- Equity multiple
- 0.21×
- Total profit
- $-52,914
- Equity at exit
- $20,664
Cash invested: $66,920 (down + closing). Projections, not guarantees.
Landlord ↔ Tenant lean methodology
- Overall (STATE)
- 90 Strongly Landlord-Friendly
- State Wyoming
- 90 Strongly Landlord-Friendly · R+25
- County
- — inherits STATE
- City
- — inherits STATE
ZIP-level market 82604
- Active inventory
- 203
- Price-to-rent
- 12.3×
Monthly cashflow live
- Estimated rent
- $1,614 medium interval (Pro) →
- Mortgage (P&I)
- −$1,253
- Tax from tax record
- −$58 /mo · $690/yr
- Insurance
- −$100
- HOA
- −$0
- Vacancy / Maint / Mgmt
- −$339
- Net cashflow
- $-135
Break-even live
UW: 25.0% down · 7.5% · 30yr · 1.5% tax · 5.0% vac · 8.0% maint · 8.0% mgmt
Financing live
Cash to close
- Down payment
- $59,750
- Closing costs
- $7,170
- Reserves months
- —
- Total cash needed
- —
Loan-product check · same deal, 3 products live
Conventional
25% down · 7.5% · 30yr
- Down + closing
- —
- Monthly P&I
- —
- Monthly cashflow
- —
- DSCR
- —
- Eligible?
- —
Personal DTI + credit; lowest rate.
DSCR
20% down · 8.5% · 30yr
- Down + closing
- —
- Monthly P&I
- —
- Monthly cashflow
- —
- DSCR
- —
- Eligible?
- —
No personal income docs; deal must DSCR.
Hard money
10% down · 12.0% · 12mo
- Down + closing
- —
- Monthly P&I
- —
- Monthly cashflow
- —
- DSCR
- —
- Eligible?
- —
Short-term bridge; refi at stabilization.
Listing history 26 events
-
2026-06-19days on market $239,000 Active 21 DOM
-
2026-06-18days on market $239,000 Active 20 DOM
-
2026-06-17days on market $239,000 Active 19 DOM
-
2026-06-17days on market $239,000 Active 18 DOM
-
2026-06-15days on market $239,000 Active 17 DOM
-
2026-06-14days on market $239,000 Active 15 DOM
-
2026-06-13days on market $239,000 Active 14 DOM
-
2026-06-10days on market $239,000 Active 12 DOM
-
2026-06-09days on market $239,000 Active 11 DOM
-
2026-06-08days on market $239,000 Active 10 DOM
-
2026-06-07days on market $239,000 Active 9 DOM
-
2026-06-05days on market $239,000 Active 6 DOM
-
2026-06-03days on market $239,000 Active 5 DOM
-
2026-06-02days on market $239,000 Active 4 DOM
-
2026-06-01days on market $239,000 Active 3 DOM
-
2026-05-31days on market $239,000 Active 2 DOM
-
2026-05-17price $245,000 347-char remark
-
2026-05-10price $249,000 347-char remark
-
2026-05-01$255,000 Active 347-char remark
-
2021-07-16soldstatus
-
2021-07-16soldstatus
-
2021-05-10$176,000
-
2014-12-11soldstatus
-
2013-06-22$139,500
-
2006-06-02soldstatus
-
2005-01-19soldstatus
ⓘ Source: listings_history table (triggers on properties + properties_extension) + one-shot
backfill from property_details.listing_events for pre-trigger history.
Tax reassessment forecast WY · Resets to sale price
- Current annual tax
- $690 · $58/mo
- Projected year-2 tax
- $1,458 · $121/mo
- Expected delta
- +$768/yr (+$64/mo · 111.3%)
ⓘ Screening estimate from a state-policy table — verify with the county assessor before closing.
Climate risk First Street
- Flood 1/10 Low FEMA zone X (unshaded) · 0% chance over 30 yrs
- Wildfire 6/10 Major
- Heat 3/10 Moderate 7 d/yr ≥91°F today · 19 d/yr by 30 yrs out
- Wind 1/10 Low
- Air quality 2/10 Low 1 unhealthy d/yr today · 2 by 30 yrs out
Nearby sold comps map
Loading sold comps map…
Walkable amenities ~0.75 mi
Loading nearby amenities…
Taxation est. · year 1
- Rental income
- $19,371
- − Mortgage interest
- −$13,388
- − Property taxes
- −$690
- − Insurance
- −$1,195
- − Repairs & maintenance
- −$1,550
- − Management
- −$1,550
- − Depreciation
- −$6,953
- Taxable loss
- −$5,954
- Est. tax savings @ 24.0%
- +$1,429
- After-tax cash flow
- $-193/yr
For passive investors: Depreciation is non-cash, so a rental often shows a tax loss while cash-flowing — sheltering income. Rental losses are passive: they offset passive income freely, and up to $25,000/yr can offset ordinary (W-2) income if you actively participate and your MAGI is under $100k (phasing out to $0 by $150k); unused losses carry forward. On sale, claimed depreciation is recaptured at up to 25%, and gains may owe capital-gains tax (a 1031 exchange can defer both). Figures are a year-1 estimate at your 24.0% rate — not tax advice; consult a CPA.
Schools (NCES district)
- District
- Natrona County School District #1
- NCES district ID
- 5604510
- Math proficiency
- 44% ▼ -4.00%
- Reading proficiency
- 52% ▼ -2.00%
- Median HH income
- $55,217
- Composite
- 41.6/100
- National rank
- #3437
- State rank
- #32 of 41 in WY
Livability — Casper
- Score
- 78/100
- State rank
- #8
- US rank
- #2629
Category grades
Schools grade is shown separately in the Schools card above.
Census & demographics
- Census place
- Casper, WY
- County
- Natrona County · 72,922 people
- City population
- 72,922
- Metro
- Casper, WY
- Population (ZIP)
- 27,487
- Household income
- $79,118
- Rent vs Own
- Severe rent burden
- 396.0
Population outlook (Natrona County) Hauer SSP2
- Today (2025)
- 98,530 people
- By 2030
- 107,084 · +8.7%
- By 2040
- 124,838 · +26.7%
- By 2050
- 143,617 · +45.8%
- By 2075
- 192,378 · +95.2%
- By 2100
- 228,435 · +131.8%
Race, ethnicity, and origin ACS 2023
- Neighborhood character
- Predominantly White (87%)
- Race & ethnicity
- White 87% Two or more races 7% Hispanic / Latino 7%
- Hispanic origin (detail)
- Mexican 5%
- Common ancestry
- Slovak 3% Portuguese 3% Lithuanian 2%
- Foreign-born
- 2% · Canada, China, Guatemala
- Languages at home
- 95% English-only · Spanish 3% French/Haitian/Cajun 1%
Political lean MEDSL · Natrona
- 2024 margin
- Solid R (+48.6) · D 24.8% · R 73.5% · Other 1.7%
- 2008→2024 swing
- -14.3pp toward R · 2008: -34.4pp · 2024: -48.6pp
- All cycles
- 2024: R+48.6 2020: R+47.6 2016: R+52.2 2012: R+41.1 2008: R+34.4
Not yet ingested
- Civics
- —
Market trends
- HPI YoY
- ▼ -238.49%
- Current HPI
- 180.7072
- Rent YoY
- —
- Metro
- Casper, WY
- State GDP YoY
- —
- F500 in state
- 0
Price history
+71.3% since first listed12 events — show timeline
- 2026-05-29 Listed $239,000 WMLS
- 2026-05-21 Price Changed $240,000 WMLS
- 2026-05-17 Price Changed $245,000 WMLS
- 2026-05-10 Price Changed $249,000 WMLS
- 2026-05-01 Listed $255,000 WMLS
- 2021-07-16 Sold (Public Records) — Public Records
- 2021-07-16 Sold (MLS) — WMLS
- 2021-05-10 Listed $176,000 WMLS
- 2014-12-11 Sold (Public Records) — Public Records
- 2013-06-22 Listed $139,500 WMLS
- 2006-06-02 Sold (Public Records) — Public Records
- 2005-01-19 Sold (Public Records) — Public Records
Property tax history
-2.5%/yrLatest (2025): $690 · -20.8% YoY. Source: county tax records.
Cash-flow waterfall
monthlySold comps — $/sqft
last 12 mo · ≤1 miLoading sold comps…