8814 Grand Ave · Rotonda, FL
Flood risk 9/10 · Severe
- FEMA flood zone
- AE
- Chance of flooding over 30 yrs
- 0.99%
- Est. flood insurance / yr
- $1,737 – $8,500
Fire risk 1/10 · Minimal
- Est. fire insurance / yr
- $947 – $1,759
Heat risk 10/10 · Severe
- Hot days now (above 107°F)
- 7 days/yr
- Hot days in 30 yrs
- 26 days/yr
Wind risk 10/10 · Severe
- Chance of severe wind over 30 yrs
- 99.0%
Air-quality risk 3/10 · Minor
- Unhealthy air days now
- 2 days/yr
- Unhealthy air days in 30 yrs
- 2 days/yr
Risk factors via First Street. Map © Google.
Why this score? — see what drove the D+ grade
The composite is a weighted blend of 9 inputs, each scored 0–100. Each bar is that input's sub-score; the figure is the points it added to the 100-point composite (weight × sub-score).
- ARV discount +13.7/15.0
- Cash flow +12.0/30.0
- Schools +4.6/10.0
- Appreciation +4.0/10.0
- DSCR +3.5/10.0
- Livability +3.4/5.0
- 1% rule +2.7/10.0
- Rent growth +2.5/5.0
- Condition / age +2.5/5.0
$989,000
🖨 Deal sheet (PDF) 📄 Offer letter ✓ Due diligence
Listing remarks
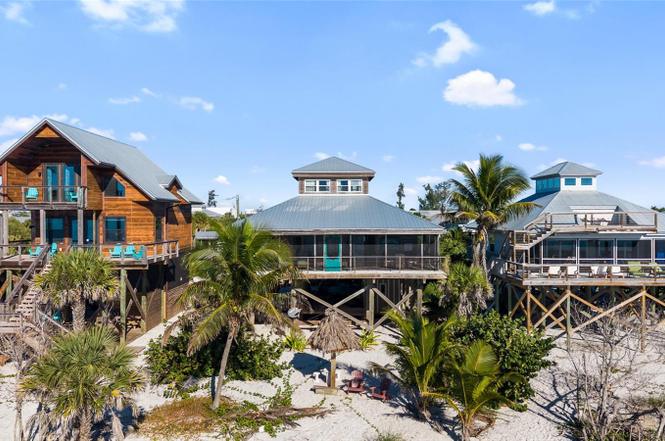
Price reduced on this charming beachfront home radiates Old Florida charm and is located on Little Gasparilla Island. LGI is a bridgeless barrier island situated off the coast of the Cape Haze Peninsula accessible only by private boat or water taxi, and it offers a peaceful escape in just a short 10-minute ride across the bay. If you’re seeking a quiet getaway, Little Gasparilla Island is the perfect destination. As soon as you arrive, you’ll feel the stress of the mainland melt away. The home features warm wood walls and floors throughout, creating a cozy and comfortable atmosphere. The spacious, screened-in front porch overlooks the Gulf, providing an ideal spot to unwind. Her
Key facts
- Ample cabinetry
- Large pantry
- Beachfront home
Tags
Property features AI
Finance
- Other: Furnished; Property type: Residential, single family; Zoning: BBI
- HOA & community: No association
Exterior
- Parking: Directions note: property is on a bridgeless barrier island accessible by private boat or water taxi only; listing agent can assist with transportation for showings
- Utilities: Public water; Septic tank; Electricity connected; Water connected
- Home design: Single family residence; 2 stories (stilt/on piling foundation); Faces west; On waterfront with full gulf/ocean view and water access
- Construction: Frame construction with wood siding; Metal roof; Stilt/On piling foundation; Built on a 0.18-acre lot (approx. 50 x 155)
- Exterior features: Outdoor lighting; Storage
Interior
- Kitchen: Range; Microwave; Dishwasher; Refrigerator
- Bedrooms: 3 bedrooms
- Flooring: Wood flooring
- Bathrooms: 1 full bathroom
- Heating & cooling: Central heating (electric); Central air conditioning
- Interior features: Cathedral ceilings; Ceiling fans; Open living/dining area; Solid wood cabinets; Stone countertops
- Laundry & utility: Indoor laundry room; Washer; Dryer; Electric water heater
Neighborhood map
What this means for you Summary
Snapshot
- This is a 2-bed/2.0-bath single-family listed at $989k.
Deal economics
- At list price, monthly cash flow is $-671 ($-8k/yr) — negative.
- To cash-flow at today's rent, offer at most $871k (12.0% below list).
- To meet the 1% rule (rent ≥ 1% of price), the offer needs to be $766k (22.5% below list).
- Recommended offer: $766k (22.5% below list) — sets the bar for 1% rule.
- Cap rate 6.0% vs local median 3.1% in Rotonda — top-decile yield for the area; either an underpriced asset or a hidden risk that comps aren't pricing in. Stress-test before assuming the spread holds.
Location & tenants
- Location reads 67/100 on livability (#548 in FL) — a middle-class / working-renter tenant base. Strengths: crime A+, housing A-, cost of living B+; Watch: amenities F, commute F, health & safety D-.
- Charlotte (suburban): math 54% / reading 54% proficiency, ranked #22 of 73 in FL (top 30%) — acceptable for families but not a draw, mixed tenant base, ~2y average lease.
- Zoned schools: Vineland Elementary School (math 74% / reading 67%, grade A-, #333 of 2,144 statewide, top 16%, 579 students, 45% FRL); L. A. Ainger Middle School (math 65% / reading 53%, grade B, #144 of 571 statewide, top 26%, 720 students, 40% FRL); Lemon Bay High School (math 50% / reading 56%, grade C-, #148 of 667 statewide, top 23%, 1,360 students, 28% FRL) — zoned schools average 38% FRL vs 54% district-wide (16 pts lower); this property's tenant base skews higher-income than the district average.
- Market conditions: 916 active listings in the ZIP; 5 comparable units currently listed for rent nearby; rentals at typical pace (median 23d on market — plan ~3-4 weeks tenant-placement turnaround); 4,585 units permitted in Charlotte County in 2024 (703 in 5+ unit buildings).
Forward outlook
- Local home prices are declining (-1.9%/yr); year-one equity from $7k of loan paydown is wiped out by about $19k of value loss. Plan a longer hold.
- Charlotte County population projected at +24% by 2050 — long-run rental-demand tailwind backs the buy-and-hold thesis.
Negotiation context
- It's been on market 152 days — a 12% lower offer ($870k) is reasonable based on typical stale-listing flexibility.
- Current owner paid $800k; 24% above their basis — modest negotiation headroom, anchor on the comps not their cost.
Risks & watch-outs
- Watch-outs: flood insurance adds $427/mo.
- Climate carrying-cost: in FEMA flood zone AE (mandatory federal flood insurance); severe wind risk, 99% chance of damaging wind over 30y; extreme-heat days projected 7→26/yr by 2055 (HVAC capex compounding) — expect insurance premiums to compound above CPI over the hold.
Questions for the listing agent
- What do current leases actually rent for vs. the listed asking? Can we see a recent rent roll and the last 12 months of T-12 income?
- It's been on market 152 days. Have you received any prior offers? Is the seller open to a 23% concession, seller financing, or rate buy-down credit?
- What's the actual annual flood-insurance premium (NFIP or private), and is the property in a SFHA with mandatory coverage?
- Why hasn't it sold? Are there any deal-killer items the seller is aware of (foundation, flood, title, zoning, code violations)?
- Is there a deadline driving the sale (1031 exchange, divorce, estate, relocation)? That informs how much negotiation room exists.
- Schools are D-rated, which usually means shorter tenancies and higher turnover. Who's the typical renter profile here, and what's been the actual vacancy rate?
- The area grade is low — what's the realistic commute time and amenity access for the typical tenant pool here? Any planned neighborhood developments (good or bad) we should know about?
- What's the average days-on-market for RENTAL listings here right now (not sales)? A rising rental-DOM trend means longer vacancies and softer asking-rent achievability than the comps imply.
- What's the recent tenant-quality profile in this submarket — average credit score on applications, eviction rate, late-payment / NSF rate, and stable-employment percentage? A property-management company in the area should have these aggregated.
- How much new for-sale + rental construction is in the pipeline within 1–3 miles? Heavy new supply typically softens prices + rents 12–24 months out; constrained supply supports both.
Investment metrics
- 1% rule
- 0.77% ✗
- Cap rate
- 6.00%
- Cash-on-cash
- -1.06%
- DSCR
- 0.95
- GRM
- 10.8
CMA / ARV
- ARV (on-the-fly)
- $1,147,612
- Comps found
- 1
Show comp detail 1 sale within ~0.75 mi
| Address | Dist | Beds/Ba | Sqft | Sold | Price | $/sf | Match |
|---|---|---|---|---|---|---|---|
| 8770 King St | 0.22mi | 3/2.0 (+1) | 1,586 (+5%) | 7mo | $1,200,000 | $757 | 71 |
Match score weights: distance 35% · size 25% · config 20% · recency 20%. Top-matched comps best support the ARV.
Projected returns pro-forma
-1.9% appreciation · 3.0% rent growth · sell at horizon
- IRR
- -14.3%
- Equity multiple
- 0.43×
- Total profit
- $-156,812
- Equity at exit
- $196,517
- IRR
- -7.0%
- Equity multiple
- 0.46×
- Total profit
- $-150,023
- Equity at exit
- $172,193
Cash invested: $276,920 (down + closing). Projections, not guarantees.
Landlord ↔ Tenant lean methodology
- Overall (STATE)
- 87 Strongly Landlord-Friendly
- State Florida
- 87 Strongly Landlord-Friendly · R+3
- County
- — inherits STATE
- City
- — inherits STATE
ZIP-level market 33946
- Home prices YoY
- -0.7%
- Active inventory
- 916
- Price-to-rent
- 10.8×
Monthly cashflow live
- Estimated rent
- $7,662 medium interval (Pro) →
- Mortgage (P&I)
- −$5,186
- Tax from tax record
- −$699 /mo · $8,387/yr
- Insurance
- −$412
- Flood insurance flood zone
- −$427 /mo · $5,118/yr
- HOA
- −$0
- Vacancy / Maint / Mgmt
- −$1,609
- Net cashflow
- $-671
Break-even live
Sensitivity live
| Price | -10% $-111 | -5% $-391 | +0% $-671 | +5% $-951 | +10% $-1,230 |
|---|---|---|---|---|---|
| Rent | -10% $-1,276 | -5% $-973 | +0% $-671 | +5% $-368 | +10% $-65 |
| Rate | -1.0pp $-173 | -0.5pp $-419 | base $-671 | +0.5pp $-927 | +1.0pp $-1,188 |
UW: 25.0% down · 7.5% · 30yr · 1.5% tax · 5.0% vac · 8.0% maint · 8.0% mgmt
Financing live
Cash to close
- Down payment
- $247,250
- Closing costs
- $29,670
- Reserves months
- —
- Total cash needed
- —
Loan-product check · same deal, 3 products live
Conventional
25% down · 7.5% · 30yr
- Down + closing
- —
- Monthly P&I
- —
- Monthly cashflow
- —
- DSCR
- —
- Eligible?
- —
Personal DTI + credit; lowest rate.
DSCR
20% down · 8.5% · 30yr
- Down + closing
- —
- Monthly P&I
- —
- Monthly cashflow
- —
- DSCR
- —
- Eligible?
- —
No personal income docs; deal must DSCR.
Hard money
10% down · 12.0% · 12mo
- Down + closing
- —
- Monthly P&I
- —
- Monthly cashflow
- —
- DSCR
- —
- Eligible?
- —
Short-term bridge; refi at stabilization.
Rent comps 5 comps
| Address | Beds | Baths | Sqft | Rent | $/sqft | DOM | Units | Dist |
|---|---|---|---|---|---|---|---|---|
| 9498 Alborado Rd Placida, FL | 3.0 | 3.0 | 1780 | $8,500 | $4.78 | 23d | 1 | 0.89mi |
| 550 Gaspar Dr Placida, FL | 3.0 | 3.0 | 1803 | $5,500 | $3.05 | 23d | 1 | 0.91mi |
| 11000 Placida Rd #2201 Placida, FL | 2.0 | 2.5 | 1973 | $8,750 | $4.43 | 23d | 1 | 0.98mi |
| 13045 Via Aurelia Placida, FL | 3.0 | 2.0 | 1961 | $8,200 | $4.18 | 23d | 1 | 1.26mi |
| 11 Amberjack Ln Placida, FL | 3.0 | 2.0 | 1786 | $2,700 | $1.51 | 15d | 1 | 1.47mi |
Listing history 19 events
-
2026-06-22days on market $989,000 Active 152 DOM
-
2026-06-18days on market $989,000 Active 149 DOM
-
2026-06-17days on market $989,000 Active 148 DOM
-
2026-06-16days on market $989,000 Active 147 DOM
-
2026-06-15days on market $989,000 Active 146 DOM
-
2026-06-14days on market $989,000 Active 144 DOM
-
2026-06-13days on market $989,000 Active 143 DOM
-
2026-06-10days on market $989,000 Active 141 DOM
-
2026-06-09days on market $989,000 Active 140 DOM
-
2026-06-08days on market $989,000 Active 139 DOM
-
2026-06-05days on market $989,000 Active 135 DOM
-
2026-06-03days on market $989,000 Active 134 DOM
-
2026-06-02days on market $989,000 Active 133 DOM
-
2026-06-01days on market $989,000 Active 132 DOM
-
2026-05-31days on market $989,000 Active 131 DOM
-
2026-05-30days on market $989,000 Active 130 DOM
-
2026-04-17price $989,000
-
2026-01-20$1,224,000 Active
-
2025-02-11soldstatus $800,000
ⓘ Source: listings_history table (triggers on properties + properties_extension) + one-shot
backfill from property_details.listing_events for pre-trigger history.
Tax reassessment forecast FL · Resets to sale price
- Current annual tax
- $8,387 · $699/mo
- Projected year-2 tax
- $8,387 · $699/mo
- Expected delta
- $0/yr ($0/mo · 0.0%)
ⓘ Screening estimate from a state-policy table — verify with the county assessor before closing.
Climate risk First Street
- Flood 9/10 Extreme FEMA zone AE · 99% chance over 30 yrs
- Wildfire 1/10 Low
- Heat 10/10 Extreme 7 d/yr ≥107°F today · 26 d/yr by 30 yrs out
- Wind 10/10 Extreme 99% chance of damaging wind over 30 yrs
- Air quality 3/10 Moderate 2 unhealthy d/yr today · 2 by 30 yrs out
Nearby sold comps map
Loading sold comps map…
Walkable amenities ~0.75 mi
Loading nearby amenities…
Taxation est. · year 1
- Rental income
- $91,950
- − Mortgage interest
- −$55,399
- − Property taxes
- −$8,387
- − Insurance
- −$10,064
- − Repairs & maintenance
- −$7,356
- − Management
- −$7,356
- − Depreciation
- −$28,771
- Taxable loss
- −$25,383
- Est. tax savings @ 24.0%
- +$6,092
- After-tax cash flow
- $-1,955/yr
For passive investors: Depreciation is non-cash, so a rental often shows a tax loss while cash-flowing — sheltering income. Rental losses are passive: they offset passive income freely, and up to $25,000/yr can offset ordinary (W-2) income if you actively participate and your MAGI is under $100k (phasing out to $0 by $150k); unused losses carry forward. On sale, claimed depreciation is recaptured at up to 25%, and gains may owe capital-gains tax (a 1031 exchange can defer both). Figures are a year-1 estimate at your 24.0% rate — not tax advice; consult a CPA.
Schools (NCES district)
- District
- Charlotte
- NCES district ID
- 1200240
- Math proficiency
- 54% ▼ -6.00%
- Reading proficiency
- 54% ▼ -1.00%
- Median HH income
- $44,864
- Composite
- 45.62/100
- National rank
- #2586
- State rank
- #22 of 73 in FL
Livability — Rotonda
- Score
- 67/100
- State rank
- #548
- US rank
- #10359
Category grades
Schools grade is shown separately in the Schools card above.
Census & demographics
- City population
- 10,490
- Population (ZIP)
- 2,745
Population outlook (Charlotte County) Hauer SSP2
- Today (2025)
- 198,646 people
- By 2030
- 210,507 · +6.0%
- By 2040
- 230,857 · +16.2%
- By 2050
- 247,148 · +24.4%
- By 2075
- 281,777 · +41.8%
- By 2100
- 293,609 · +47.8%
Race, ethnicity, and origin ACS 2023
- Neighborhood character
- Predominantly White (95%)
- Race & ethnicity
- White 95% Hispanic / Latino 2% Asian 1% Two or more races 1%
- Common ancestry
- Italian 3% Romanian 2% Russian 2%
- Foreign-born
- 6% · Canada
- Languages at home
- 91% English-only · Russian/Polish/Slavic 5% Spanish 1% French/Haitian/Cajun 1%
Political lean MEDSL · Charlotte
- 2024 margin
- Solid R (+34.0) · D 32.7% · R 66.7%
- 2008→2024 swing
- -26.7pp toward R · 2008: -7.2pp · 2024: -34.0pp
- All cycles
- 2024: R+34.0 2020: R+26.6 2016: R+27.8 2012: R+14.3 2008: R+7.2
Not yet ingested
- Civics
- —
Market trends
- HPI YoY
- ▼ -1.90%
- Current HPI
- 288.559
- Rent YoY
- —
- Metro
- —
- State GDP YoY
- ▲ 3.28%
- F500 in state
- 36
Industry mix (Fortune 500 HQ in FL)
| Industry | F500 HQs | Revenue |
|---|---|---|
| Industrial Technology | 2 | $29B |
|
||
| Insurance | 2 | $17B |
|
||
| Retail | 1 | $60B |
|
||
| Technology Distribution | 1 | $58B |
|
||
| Homebuilding | 1 | $35B |
|
||
| Technology Manufacturing | 1 | $35B |
|
||
Price history
+23.6% since first listed3 events — show timeline
- 2026-04-17 Price Changed $989,000 Stellar MLS as Distributed by MLS Grid
- 2026-01-20 Listed $1,224,000 Stellar MLS as Distributed by MLS Grid
- 2025-02-11 Sold (Public Records) $800,000 Public Records
Property tax history
+3.4%/yrLatest (2025): $8,387 · -9.1% YoY. Source: county tax records.
Cash-flow waterfall
monthlySold comps — $/sqft
last 12 mo · ≤1 miLoading sold comps…