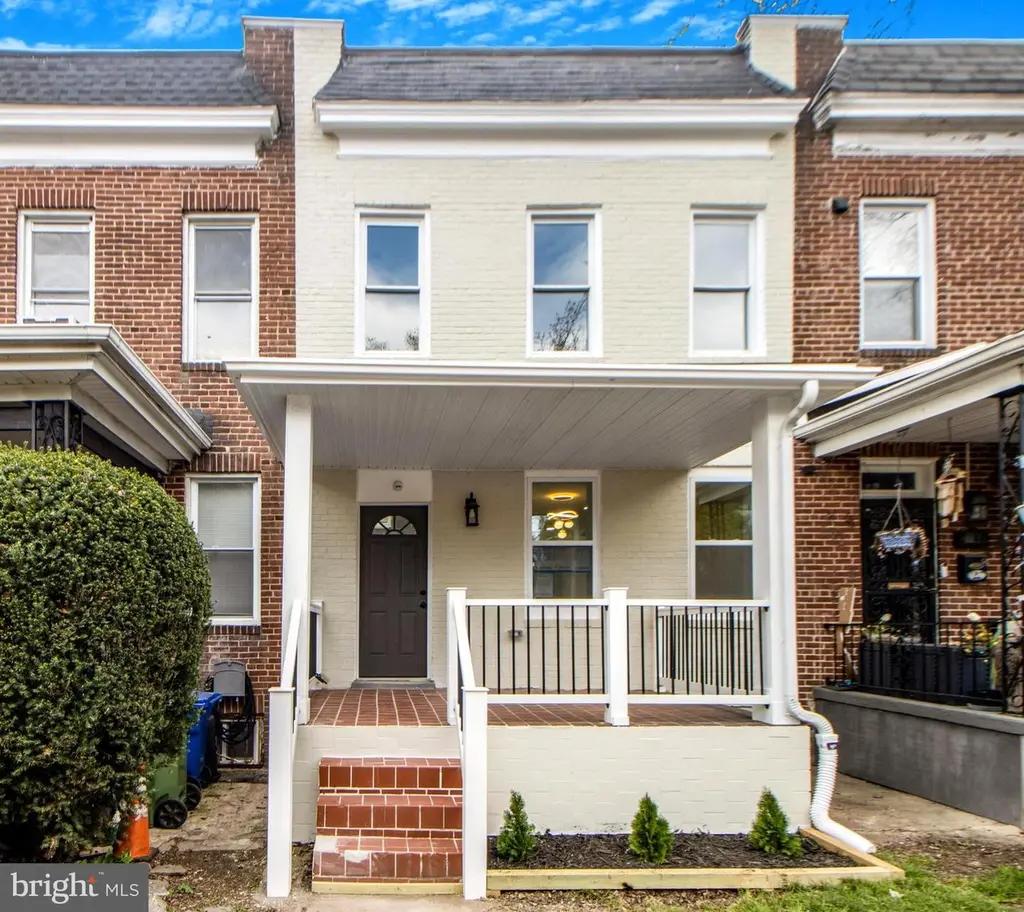
3706 Overview Rd · Baltimore, MD
Flood risk 8/10 · Major
- FEMA flood zone
- X (unshaded)
- Chance of flooding over 30 yrs
- 0.99%
- Est. flood insurance / yr
- $473 – $860
Fire risk 1/10 · Minimal
- Est. fire insurance / yr
- $755 – $1,403
Heat risk 6/10 · Moderate
- Hot days now (above 104°F)
- 7 days/yr
- Hot days in 30 yrs
- 14 days/yr
Wind risk 6/10 · Moderate
- Chance of severe wind over 30 yrs
- 27.0%
Air-quality risk 3/10 · Minor
- Unhealthy air days now
- 3 days/yr
- Unhealthy air days in 30 yrs
- 4 days/yr
Risk factors via First Street. Map © Google.
Why this score? — see what drove the C- grade
The composite is a weighted blend of 9 inputs, each scored 0–100. Each bar is that input's sub-score; the figure is the points it added to the 100-point composite (weight × sub-score).
- Cash flow +23.5/30.0
- ARV discount +8.4/15.0
- DSCR +7.6/10.0
- 1% rule +4.9/10.0
- Livability +3.8/5.0
- Rent growth +3.1/5.0
- Condition / age +2.5/5.0
- Schools +1.0/10.0
- Appreciation +0.0/10.0
$219,900
🖨 Deal sheet 📄 Offer letter ✓ Due diligence
Listing remarks MLS
Spacious three bedroom brick townhome in need of restoration to its former beauty. Large finished basement and great backyard.
Key facts
- Built 1920
- Listed 9 days
Neighborhood map
What this means for you Summary
Snapshot
- This is a 4-bed/3.5-bath townhouse listed at $220k.
Deal economics
- At list price, monthly cash flow is $354 ($4k/yr) — positive.
- The deal already cash-flows at list — no discount required.
- To meet the 1% rule (rent ≥ 1% of price), the offer needs to be $218k (0.9% below list).
- Recommended offer: $218k (0.9% below list) — sets the bar for 1% rule.
- Cap rate 8.5% vs local median 6.0% in Baltimore — top-decile yield for the area; either an underpriced asset or a hidden risk that comps aren't pricing in. Stress-test before assuming the spread holds.
Location & tenants
- Location reads 76/100 on livability (#90 in MD, #3,396 nationally) — a middle-class / working-renter tenant base. Strengths: amenities A+, commute A+, housing A+; Watch: schools D, crime F.
- Baltimore City Public Schools (urban): math 7% / reading 16% proficiency, ranked #24 of 24 in MD (top 100%) — low school quality limits family demand, transient renter base, plan for 1-2y turnover; 79% free/reduced lunch — lower-income household profile, screen leases tightly.
- Market conditions: Rents rising (+2.4%/yr); 351 active listings in the ZIP; 28 comparable units currently listed for rent nearby; rentals at typical pace (median 24d on market — plan ~3-4 weeks tenant-placement turnaround); 1,273 units permitted in Baltimore city in 2024 (1,104 in 5+ unit buildings).
- At $2,178/mo this rent would consume 51% of the median local household income ($52k/yr) (locally 3644% of renters already pay >50% of income on rent) — very limited rent-growth headroom before tenants either downsize or default.
Forward outlook
- Local home prices are declining (-3.0%/yr); year-one equity from $2k of loan paydown is wiped out by about $7k of value loss. Plan a longer hold.
- Baltimore County population projected to shrink 4% by 2050 — rents likely to lag national; underwrite the cash flow, not the appreciation.
Negotiation context
- Only 9 days on market — expect competitive offers; lowballing is unlikely to land.
- 9 sale attempts since 25y ago with the ask held roughly flat each time — persistent listings suggest the price (not the market) is what's stuck; bring a comps-based counter.
- Current owner paid $40k; list at $220k implies a 450% gain — meaningful room to come down on a strong offer.
Risks & watch-outs
- Watch-outs: flood insurance adds $56/mo; built in 1920 — expect roof / HVAC / electrical / plumbing capex.
- Climate carrying-cost: severe flood risk; major wind risk, 27% chance of damaging wind over 30y; extreme-heat days projected 7→14/yr by 2055 (HVAC capex compounding) — expect insurance premiums to compound above CPI over the hold.
Questions for the listing agent
- Built in 1920 — when were the roof, HVAC, electrical panel, plumbing, and water heater last replaced?
- What's the actual annual flood-insurance premium (NFIP or private), and is the property in a SFHA with mandatory coverage?
- Is there a deadline driving the sale (1031 exchange, divorce, estate, relocation)? That informs how much negotiation room exists.
- Schools are D-rated, which usually means shorter tenancies and higher turnover. Who's the typical renter profile here, and what's been the actual vacancy rate?
- Crime grade is F in this area — have there been break-ins, vandalism, or insurance claims at this property in the last 3 years? What carrier currently insures it and at what premium?
- What's the average days-on-market for RENTAL listings here right now (not sales)? A rising rental-DOM trend means longer vacancies and softer asking-rent achievability than the comps imply.
- What's the recent tenant-quality profile in this submarket — average credit score on applications, eviction rate, late-payment / NSF rate, and stable-employment percentage? A property-management company in the area should have these aggregated.
- How much new for-sale + rental construction is in the pipeline within 1–3 miles? Heavy new supply typically softens prices + rents 12–24 months out; constrained supply supports both.
Investment metrics
- 1% rule
- 0.99% ✗
- Cap rate
- 8.53%
- Cash-on-cash
- 7.98%
- DSCR
- 1.36
- GRM
- 8.4
CMA / ARV
- ARV (on-the-fly)
- $224,400
- Comps found
- 12
Show comp detail 12 sales within ~0.75 mi
| Address | Dist | Beds/Ba | Sqft | Sold | Price | $/sf | Match |
|---|---|---|---|---|---|---|---|
| 3706 Overview Rd | 0.00mi | 4/3.5 | 1,870 (0%) | 0mo | $220,000 | $118 | 100 |
| 2800 Suffolk Ave | 0.27mi | 4/2.0 | 1,881 (+1%) | 2mo | $37,500 | $20 | 79 |
| 4054 Hilton Rd | 0.30mi | 4/3.5 | 1,815 (-3%) | 3mo | $250,000 | $138 | 78 |
| 2922 Ulman Ave | 0.10mi | 5/1.5 (+1) | 1,800 (-4%) | 2mo | $82,900 | $46 | 74 |
| 2627 Loyola Northway | 0.66mi | 4/3.5 | 1,900 (+2%) | 2mo | $250,000 | $132 | 64 |
| 4043 Cedardale Rd | 0.42mi | 4/3.5 | 1,997 (+7%) | 6mo | $257,900 | $129 | 64 |
| 2258 Druid Park Dr | 0.59mi | 3/3.5 (-1) | 1,764 (-6%) | 2mo | $282,500 | $160 | 56 |
| 3825 Pall Mall Rd | 0.40mi | 4/2.0 | 1,670 (-11%) | 2mo | $246,000 | $147 | 56 |
| 3520 White Chapel Rd | 0.44mi | 3/2.5 (-1) | 1,718 (-8%) | 5mo | $130,000 | $76 | 53 |
| 3512 Reisterstown Rd | 0.22mi | 4/1.0 | 2,145 (+15%) | 7mo | $59,900 | $28 | 49 |
| 3911 Bareva Rd | 0.54mi | 4/2.0 | 1,620 (-13%) | 0mo | $112,100 | $69 | 46 |
| 4006 Greenspring Ave | 0.63mi | 3/2.0 (-1) | 1,767 (-6%) | 5mo | $212,000 | $120 | 46 |
Match score weights: distance 35% · size 25% · config 20% · recency 20%. Top-matched comps best support the ARV.
Projected returns pro-forma
-3.0% appreciation · 2.41% rent growth · sell at horizon
- IRR
- -6.4%
- Equity multiple
- 0.77×
- Total profit
- $-14,436
- Equity at exit
- $32,788
- IRR
- 2.6%
- Equity multiple
- 1.18×
- Total profit
- $10,998
- Equity at exit
- $19,013
Cash invested: $61,572 (down + closing). Projections, not guarantees.
Landlord ↔ Tenant lean methodology
- Overall (CITY)
- 12 Strongly Tenant-Friendly
- State Maryland
- 27 Tenant-Leaning · D+14
- County
- — inherits STATE
- City Baltimore
- 12 Strongly Tenant-Friendly · D+58
ZIP-level market 21215
- Rents YoY
- 2.4%
- Active inventory
- 351
- Price-to-rent
- 8.4×
Monthly cashflow live
- Estimated rent
- $2,178 high interval (Pro) →
- Mortgage (P&I)
- −$1,153
- Tax from tax record
- −$67 /mo · $799/yr
- Insurance
- −$92
- Flood insurance flood zone
- −$56 /mo · $666/yr
- HOA
- −$0
- Vacancy / Maint / Mgmt
- −$457
- Net cashflow
- $354
Break-even live
UW: 25.0% down · 7.5% · 30yr · 1.5% tax · 5.0% vac · 8.0% maint · 8.0% mgmt
Financing live
Cash to close
- Down payment
- $54,975
- Closing costs
- $6,597
- Reserves months
- —
- Total cash needed
- —
Loan-product check · same deal, 3 products live
Conventional
25% down · 7.5% · 30yr
- Down + closing
- —
- Monthly P&I
- —
- Monthly cashflow
- —
- DSCR
- —
- Eligible?
- —
Personal DTI + credit; lowest rate.
DSCR
20% down · 8.5% · 30yr
- Down + closing
- —
- Monthly P&I
- —
- Monthly cashflow
- —
- DSCR
- —
- Eligible?
- —
No personal income docs; deal must DSCR.
Hard money
10% down · 12.0% · 12mo
- Down + closing
- —
- Monthly P&I
- —
- Monthly cashflow
- —
- DSCR
- —
- Eligible?
- —
Short-term bridge; refi at stabilization.
Rent comps 28 comps
| Address | Beds | Baths | Sqft | Rent | $/sqft | DOM | Units | Dist |
|---|---|---|---|---|---|---|---|---|
| 3204 Sequoia Ave Baltimore, MD | 4.0 | 2.5 | 1791 | $2,600 | $1.45 | 44d | 1 | 0.18mi |
| 3822 Pall Mall Rd Baltimore, MD | 3.0 | 1.5 | 1320 | $1,875 | $1.42 | 44d | 1 | 0.40mi |
| 4037 Cedardale Rd Baltimore, MD | 5.0 | 3.0 | 1500 | $2,800 | $1.87 | 15d | 1 | 0.42mi |
| 4230 Towanda Ave Baltimore, MD | 3.0 | 2.0 | 1400 | $1,800 | $1.29 | 18d | 1 | 0.55mi |
| 2305 Wichita Ave Unit 1 Baltimore, MD | 3.0 | 1.0 | 1950 | $1,300 | $0.67 | 24d | 1 | 0.63mi |
| 2619 Loyola Northway Baltimore, MD | 3.0 | 2.0 | 1400 | $1,995 | $1.43 | 24d | 1 | 0.70mi |
| 3104 Tioga Pkwy Baltimore, MD | 3.0 | 2.0 | 1640 | $2,050 | $1.25 | 22d | 1 | 0.82mi |
| 3632 Parkdale Ave Baltimore, MD | 3.0 | 1.0 | 1400 | $3,000 | $2.14 | 44d | 1 | 0.85mi |
| 3784 Columbus Dr Baltimore, MD | 4.0 | 2.0 | 1250 | $2,200 | $1.76 | 24d | 1 | 1.03mi |
| 4704 Pimlico Rd Baltimore, MD | 3.0 | 1.5 | 2006 | $1,800 | $0.90 | 24d | 1 | 1.16mi |
| 3030 Windsor Ave Baltimore, MD | 4.0 | 1.5 | 2124 | $1,995 | $0.94 | 4d | 1 | 1.17mi |
| 4320 Roland Heights Ave Baltimore, MD | 3.0 | 2.5 | 1800 | $3,300 | $1.83 | 18d | 1 | 1.19mi |
| 4322 Roland Heights Ave Baltimore, MD | 3.0 | 3.0 | 1800 | $3,000 | $1.67 | 44d | 1 | 1.19mi |
| 2812 Clifton Ave Baltimore, MD | 3.0 | 1.5 | 1650 | $1,850 | $1.12 | 44d | 1 | 1.20mi |
| 2216 Whittier Ave Baltimore, MD | 5.0 | 1.5 | 1392 | $1,975 | $1.42 | 24d | 1 | 1.21mi |
| 2201 Whittier Ave Baltimore, MD | 4.0 | 2.0 | 1750 | $1,700 | $0.97 | 18d | 1 | 1.24mi |
| 2201 Whittier Ave Baltimore, MD | 4.0 | 2.0 | 1750 | $1,700 | $0.97 | 44d | 1 | 1.24mi |
| 4319 Medfield Ave Baltimore, MD | 3.0 | 2.5 | 1800 | $3,100 | $1.72 | 44d | 1 | 1.24mi |
| 2917 Clifton Ave Baltimore, MD | 4.0 | 4.0 | 1700 | $2,150 | $1.26 | 24d | 1 | 1.25mi |
| 2001 W Cold Spring Ln Baltimore, MD | 1.0–3.0 | 1.0–2.0 | 1154 | $3,505 | $3.04 | 2d | 31 | 1.29mi |
| 2128 N Pulaski St Baltimore, MD | 4.0 | 3.0 | 2166 | $2,200 | $1.02 | 44d | 1 | 1.30mi |
| 2204 Clifton Ave Baltimore, MD | 3.0 | 1.0 | 1400 | $1,450 | $1.04 | 4d | 1 | 1.31mi |
| 3904 Gwynns Falls Pkwy Baltimore, MD | 3.0 | 2.0 | 1772 | $2,600 | $1.47 | 44d | 1 | 1.40mi |
| 2405 W North Ave Baltimore, MD | 4.0 | 3.0 | 1826 | $1,900 | $1.04 | 4d | 1 | 1.43mi |
| 2401 W North Ave Baltimore, MD | 5.0 | 2.0 | 2037 | $1,800 | $0.88 | 4d | 1 | 1.43mi |
| 3534 Poole St Unit 1 Baltimore, MD | 3.0 | 2.0 | 1450 | $2,600 | $1.79 | 24d | 1 | 1.43mi |
| 1816 N Bentalou St Baltimore, MD | 3.0 | 2.0 | 1350 | $1,700 | $1.26 | 24d | 1 | 1.47mi |
| 1816 N Bentalou St Baltimore, MD | 3.0 | 2.0 | 1350 | $1,700 | $1.26 | 11d | 1 | 1.47mi |
Listing history 29 events
-
2026-04-23status Pending
-
2026-04-15status Active
-
2026-04-15historical
-
2026-04-15$219,900 Active
-
2026-04-13price $219,900
-
2026-04-11historical $209,900
-
2024-12-13soldstatus $40,000 Closed 126-char remark
Show marketing remark (126 chars)
Spacious three bedroom brick townhome in need of restoration to its former beauty. Large finished basement and great backyard.
-
2024-11-08status Pending 126-char remark
Show marketing remark (126 chars)
Spacious three bedroom brick townhome in need of restoration to its former beauty. Large finished basement and great backyard.
-
2024-10-22$44,950 Active 126-char remark
Show marketing remark (126 chars)
Spacious three bedroom brick townhome in need of restoration to its former beauty. Large finished basement and great backyard.
-
2022-12-30historical
-
2022-11-05price $85,000
-
2022-10-18historical
-
2022-10-06$86,500 Active
-
2022-09-20price $86,500
-
2022-09-20status Active
-
2022-05-18historical
-
2022-05-18$87,000
-
2022-04-28soldstatus $68,000 Closed
-
2022-04-04status Pending
-
2022-03-31soldstatus $68,000 Closed
-
2022-03-18status Pending
-
2021-12-09$87,500 Active
-
2021-11-08historical
-
2021-10-27price $52,900
-
2021-10-06price $59,900
-
2021-09-25price $64,900
-
2021-09-21$69,900 Active
-
2002-08-31historical
-
2001-09-04
ⓘ Source: listings_history table (triggers on properties + properties_extension) + one-shot
backfill from property_details.listing_events for pre-trigger history.
Tax reassessment forecast MD · Partial reset (capped growth)
- Current annual tax
- $799 · $67/mo
- Projected year-2 tax
- $1,598 · $133/mo
- Expected delta
- +$799/yr (+$67/mo · 100.1%)
ⓘ Screening estimate from a state-policy table — verify with the county assessor before closing.
Climate risk First Street
- Flood 8/10 Severe FEMA zone X (unshaded) · 99% chance over 30 yrs
- Wildfire 1/10 Low
- Heat 6/10 Major 7 d/yr ≥104°F today · 14 d/yr by 30 yrs out
- Wind 6/10 Major 27% chance of damaging wind over 30 yrs
- Air quality 3/10 Moderate 3 unhealthy d/yr today · 4 by 30 yrs out
Nearby sold comps map
Loading sold comps map…
Walkable amenities ~0.75 mi
Loading nearby amenities…
Taxation est. · year 1
- Rental income
- $26,140
- − Mortgage interest
- −$12,318
- − Property taxes
- −$799
- − Insurance
- −$1,766
- − Repairs & maintenance
- −$2,091
- − Management
- −$2,091
- − Depreciation
- −$6,397
- Taxable income
- $678
- Est. tax owed @ 24.0%
- −$163
- After-tax cash flow
- $4,085/yr
For passive investors: Depreciation is non-cash, so a rental often shows a tax loss while cash-flowing — sheltering income. Rental losses are passive: they offset passive income freely, and up to $25,000/yr can offset ordinary (W-2) income if you actively participate and your MAGI is under $100k (phasing out to $0 by $150k); unused losses carry forward. On sale, claimed depreciation is recaptured at up to 25%, and gains may owe capital-gains tax (a 1031 exchange can defer both). Figures are a year-1 estimate at your 24.0% rate — not tax advice; consult a CPA.
Schools (NCES district)
- District
- Baltimore City Public Schools
- NCES district ID
- 2400090
- Math proficiency
- 7% ▼ -9.00%
- Reading proficiency
- 16% ▼ -5.00%
- Median HH income
- $42,108
- Composite
- 10.08/100
- National rank
- #9805
- State rank
- #24 of 24 in MD
Livability — Baltimore
- Score
- 76/100
- State rank
- #90
- US rank
- #3396
Category grades
Schools grade is shown separately in the Schools card above.
Census & demographics
- Census place
- Baltimore, MD
- County
- Baltimore City · 558,601 people
- City population
- 588,727
- Metro
- Baltimore-Columbia-Towson, MD
- Population (ZIP)
- 52,229
- Household income
- $51,587
- Rent vs Own
- Severe rent burden
- 3644.0
Population outlook (Baltimore County) Hauer SSP2
- Today (2025)
- 624,249 people
- By 2030
- 621,541 · -0.4%
- By 2040
- 609,756 · -2.3%
- By 2050
- 597,249 · -4.3%
- By 2075
- 552,236 · -11.5%
- By 2100
- 513,934 · -17.7%
Race, ethnicity, and origin ACS 2023
- Neighborhood character
- Predominantly Black (73%)
- Race & ethnicity
- Black 73% White 17% Hispanic / Latino 5% Two or more races 4% Asian 1%
- Common ancestry
- Scotch-Irish 2% Romanian 2% Italian 1%
- Foreign-born
- 9% · Canada, South Korea
- Languages at home
- 91% English-only · Spanish 4% French/Haitian/Cajun 1% Other Indo-European 1%
Political lean MEDSL · Baltimore
- 2024 margin
- Solid D (+73.0) · D 85.2% · R 12.2% · Other 2.6%
- 2008→2024 swing
- -2.5pp toward R · 2008: 75.5pp · 2024: 73.0pp
- All cycles
- 2024: D+73.0 2020: D+76.6 2016: D+74.6 2012: D+76.4 2008: D+75.5
Not yet ingested
- Civics
- —
Market trends
- HPI YoY
- ▼ -318.58%
- Current HPI
- 291.4926
- Rent YoY
- ▲ 2.41%
- Metro
- Baltimore-Columbia-Towson, MD
- State GDP YoY
- ▲ 2.97%
- F500 in state
- 12
Industry mix (Fortune 500 HQ in MD)
| Industry | F500 HQs | Revenue |
|---|---|---|
| Aerospace / Defense | 1 | $71B |
|
||
| Utilities | 1 | $25B |
|
||
| Hotels | 1 | $24B |
|
||
| Consumer Goods | 1 | $7B |
|
||
| Real Estate | 1 | $6B |
|
||
| Chemicals | 1 | $2B |
|
||
Price history
+214.6% since first listed29 events — show timeline
- 2026-04-23 Pending — BRIGHT MLS
- 2026-04-15 Relisted — BRIGHT MLS
- 2026-04-15 Listing Removed — BRIGHT MLS
- 2026-04-15 Listed $219,900 BRIGHT MLS
- 2026-04-13 Price Changed $219,900 BRIGHT MLS
- 2026-04-11 Coming Soon $209,900 BRIGHT MLS
- 2024-12-13 Sold (MLS) $40,000 BRIGHT MLS
- 2024-11-08 Pending — BRIGHT MLS
- 2024-10-22 Listed $44,950 BRIGHT MLS
- 2022-12-30 Listing Removed — BRIGHT MLS
- 2022-11-05 Price Changed $85,000 BRIGHT MLS
- 2022-10-18 Listing Removed — BRIGHT MLS
- 2022-10-06 Listed $86,500 BRIGHT MLS
- 2022-09-20 Price Changed $86,500 BRIGHT MLS
- 2022-09-20 Relisted — BRIGHT MLS
- 2022-05-18 Listed $87,000 BRIGHT MLS
- 2022-05-18 Listing Removed — BRIGHT MLS
- 2022-04-28 Sold (MLS) $68,000 BRIGHT MLS
- 2022-04-04 Pending — BRIGHT MLS
- 2022-03-31 Sold (MLS) $68,000 BRIGHT MLS
- 2022-03-18 Pending — BRIGHT MLS
- 2021-12-09 Listed $87,500 BRIGHT MLS
- 2021-11-08 Listing Removed — BRIGHT MLS
- 2021-10-27 Price Changed $52,900 BRIGHT MLS
- 2021-10-06 Price Changed $59,900 BRIGHT MLS
- 2021-09-25 Price Changed $64,900 BRIGHT MLS
- 2021-09-21 Listed $69,900 BRIGHT MLS
- 2002-08-31 Delisted — MRIS
- 2001-09-04 Listed — MRIS
Property tax history
+1.8%/yrLatest (2025): $799 · +17.2% YoY. Source: county tax records.
Cash-flow waterfall
monthlySold comps — $/sqft
last 12 mo · ≤1 miLoading sold comps…