 Multi-family
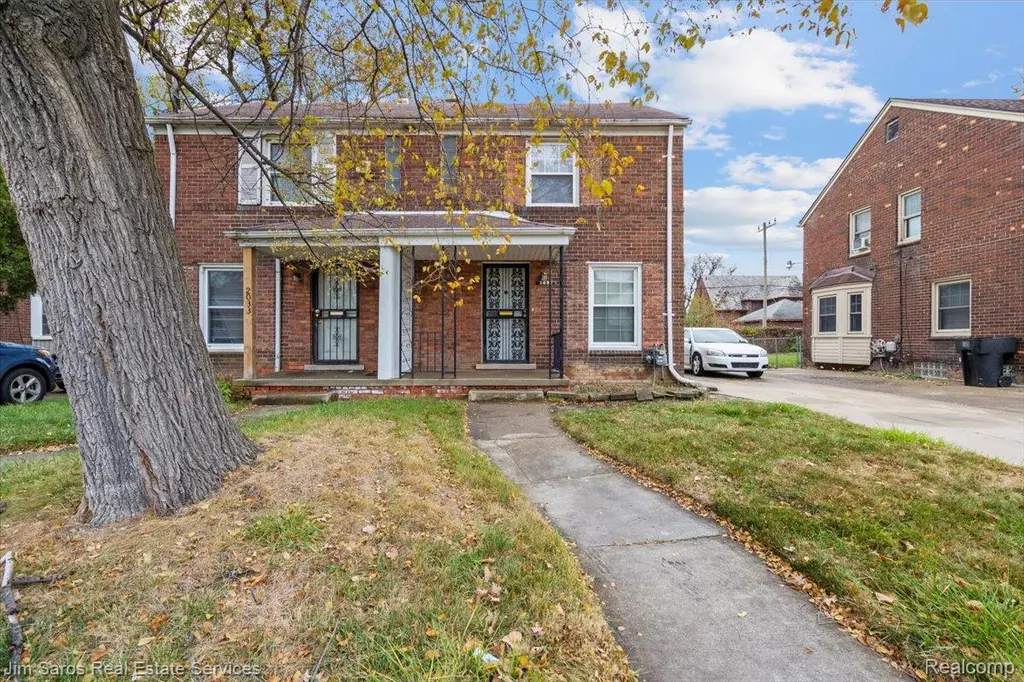
2039 Ewald Cir · Detroit, MI
Flood risk 3/10 · Minor
- FEMA flood zone
- X (unshaded)
- Chance of flooding over 30 yrs
- 0.1%
- Est. flood insurance / yr
- $473 – $860
Fire risk 1/10 · Minimal
- Est. fire insurance / yr
- $784 – $1,456
Heat risk 3/10 · Minor
- Hot days now (above 97°F)
- 7 days/yr
- Hot days in 30 yrs
- 15 days/yr
Wind risk 2/10 · Minimal
- Chance of severe wind over 30 yrs
- —
Air-quality risk 4/10 · Minor
- Unhealthy air days now
- 4 days/yr
- Unhealthy air days in 30 yrs
- 6 days/yr
Risk factors via First Street. Map © Google.
Why this score? — see what drove the D grade
The composite is a weighted blend of 9 inputs, each scored 0–100. Each bar is that input's sub-score; the figure is the points it added to the 100-point composite (weight × sub-score).
- Cash flow +15.7/30.0
- ARV discount +7.5/15.0
- DSCR +4.8/10.0
- Rent growth +4.0/5.0
- Livability +3.7/5.0
- 1% rule +3.4/10.0
- Condition / age +2.5/5.0
- Schools +1.3/10.0
- Appreciation +0.0/10.0
$119,900
🖨 Deal sheet (PDF) 📄 Offer letter ✓ Due diligence
Multi-family units
County records classify this as Multi-Family (2-4 Unit). Listing-text estimate: 1 unit. estimate disagrees with records
Listing remarks MLS
Offered at an exceptionally appealing price, this two-bedroom, townhouse-style half-duplex is a fantastic opportunity to own a home in one of Detroit’s highly sought-after and rapidly developing neighborhoods. Inside, you’ll find a bright and inviting layout featuring a well-kept kitchen, hardwood floors, fresh paint, and abundant natural light throughout. The private basement provides extra storage or potential for additional living space, while the large backyard offers room to relax, garden, or entertain. You’ll enter into a spacious living room that sets the tone for the home’s warm and comfortable feel. With several updates already in place, the property is just waiting for your personal cosmetic touches to make it truly your own. Seller financing is available, and terms are negotiable. Current market rent is $999.00.
Key facts
- Well kept kitchen
- Private basement
- Large backyard
Tags
Neighborhood map
What this means for you Summary
Snapshot
- This is a 2-bed/1.0-bath multifamily listed at $120k.
Deal economics
- At list price, monthly cash flow is $53 ($634/yr) — positive.
- The deal already cash-flows at list — no discount required.
- To meet the 1% rule (rent ≥ 1% of price), the offer needs to be $101k (16.2% below list).
- Recommended offer: $101k (16.2% below list) — sets the bar for 1% rule.
- Cap rate 6.8% vs local median 10.0% in Detroit — below-typical yield; the buyer is paying a premium for something (appreciation thesis, condition, location) that the cap rate doesn't capture.
Location & tenants
- Location reads 73/100 on livability (#218 in MI) — a middle-class / working-renter tenant base. Strengths: amenities A+, commute A+, cost of living A+; Watch: crime F, employment F.
- Detroit Public Schools Community District (urban): math 10% / reading 24% proficiency, ranked #499 of 540 in MI (top 92%) — low school quality limits family demand, transient renter base, plan for 1-2y turnover; 90% free/reduced lunch — lower-income household profile, screen leases tightly.
- Zoned schools: Thurgood Marshall Elementary School (math 24% / reading 24%, grade F, #980 of 1,397 statewide, top 74%, 482 students, 88% FRL); Mumford High School (math 24% / reading 24%, grade F, #481 of 713 statewide, top 81%, 889 students, 86% FRL) — zoned schools at 87% FRL track the district average.
- Market conditions: Rents rising fast (+6.1%/yr); 350 active listings in the ZIP; 40 comparable units currently listed for rent nearby; rentals at typical pace (median 26d on market — plan ~3-4 weeks tenant-placement turnaround); 42% of comp listings sitting > 30 days — soft ceiling on asking rent; lower-income renter base — watch delinquency; 2,639 units permitted in Wayne County in 2024 (1,216 in 5+ unit buildings).
- This rent runs 36% of the median local income ($33k/yr) — at the standard rent-burdened threshold; future hikes will face affordability resistance.
Forward outlook
- Local home prices are declining (-3.0%/yr); year-one equity from $829 of loan paydown is wiped out by about $4k of value loss. Plan a longer hold.
- Wayne County population projected at -17% by 2050 — secular population decline; favor cash flow + early exit over multi-decade hold.
Negotiation context
- It's been on market 212 days — a 12% lower offer ($106k) is reasonable based on typical stale-listing flexibility.
- 5 sale attempts; this cycle's ask is 11902% above the opening price — seller raised mid-cycle; expect resistance to lowballs.
Risks & watch-outs
- Watch-outs: built in 1944 — expect roof / HVAC / electrical / plumbing capex.
Questions for the listing agent
- It's been on market 212 days. Have you received any prior offers? Is the seller open to a 16% concession, seller financing, or rate buy-down credit?
- Built in 1944 — when were the roof, HVAC, electrical panel, plumbing, and water heater last replaced?
- Why hasn't it sold? Are there any deal-killer items the seller is aware of (foundation, flood, title, zoning, code violations)?
- Is there a deadline driving the sale (1031 exchange, divorce, estate, relocation)? That informs how much negotiation room exists.
- Schools are F-rated, which usually means shorter tenancies and higher turnover. Who's the typical renter profile here, and what's been the actual vacancy rate?
- Crime grade is F in this area — have there been break-ins, vandalism, or insurance claims at this property in the last 3 years? What carrier currently insures it and at what premium?
- The area grade is low — what's the realistic commute time and amenity access for the typical tenant pool here? Any planned neighborhood developments (good or bad) we should know about?
- What's the average days-on-market for RENTAL listings here right now (not sales)? A rising rental-DOM trend means longer vacancies and softer asking-rent achievability than the comps imply.
- What's the recent tenant-quality profile in this submarket — average credit score on applications, eviction rate, late-payment / NSF rate, and stable-employment percentage? A property-management company in the area should have these aggregated.
- How much new apartment / multifamily construction is in the pipeline within 1–3 miles? Heavy new supply (>2% of stock underway) typically softens rents 12–24 months out; light construction supports rent growth.
Investment metrics
- 1% rule
- 0.84% ✗
- Cap rate
- 6.82%
- Cash-on-cash
- 1.89%
- DSCR
- 1.08
- GRM
- 9.9
CMA / ARV
- ARV (median comp)
- $40,605
- List price
- $119,900
- Delta
- 195.29%
- Verdict
- OVERPRICED
- Comps
- 20 within 1.0 mi
Projected returns pro-forma
-3.0% appreciation · 6.14% rent growth · sell at horizon
- IRR
- -10.2%
- Equity multiple
- 0.62×
- Total profit
- $-12,826
- Equity at exit
- $17,877
- IRR
- 2.7%
- Equity multiple
- 1.22×
- Total profit
- $7,347
- Equity at exit
- $10,367
Cash invested: $33,572 (down + closing). Projections, not guarantees.
Landlord ↔ Tenant lean methodology
- Overall (STATE)
- 62 Landlord-Friendly
- State Michigan
- 62 Landlord-Friendly · EVEN
- County
- — inherits STATE
- City
- — inherits STATE
ZIP-level market 48238
- Home prices YoY
- -14.4%
- Rents YoY
- 6.1%
- Active inventory
- 350
- Price-to-rent
- 9.9×
Monthly cashflow live
- Estimated rent
- $1,005 high interval (Pro) →
- Mortgage (P&I)
- −$629
- Tax from tax record
- −$62 /mo · $750/yr
- Insurance
- −$50
- HOA
- −$0
- Vacancy / Maint / Mgmt
- −$211
- Net cashflow
- $53
Break-even live
Sensitivity live
| Price | -10% $121 | -5% $87 | +0% $53 | +5% $19 | +10% $-15 |
|---|---|---|---|---|---|
| Rent | -10% $-27 | -5% $13 | +0% $53 | +5% $93 | +10% $132 |
| Rate | -1.0pp $113 | -0.5pp $83 | base $53 | +0.5pp $22 | +1.0pp $-10 |
UW: 25.0% down · 7.5% · 30yr · 1.5% tax · 5.0% vac · 8.0% maint · 8.0% mgmt
Financing live
Cash to close
- Down payment
- $29,975
- Closing costs
- $3,597
- Reserves months
- —
- Total cash needed
- —
Loan-product check · same deal, 3 products live
Conventional
25% down · 7.5% · 30yr
- Down + closing
- —
- Monthly P&I
- —
- Monthly cashflow
- —
- DSCR
- —
- Eligible?
- —
Personal DTI + credit; lowest rate.
DSCR
20% down · 8.5% · 30yr
- Down + closing
- —
- Monthly P&I
- —
- Monthly cashflow
- —
- DSCR
- —
- Eligible?
- —
No personal income docs; deal must DSCR.
Hard money
10% down · 12.0% · 12mo
- Down + closing
- —
- Monthly P&I
- —
- Monthly cashflow
- —
- DSCR
- —
- Eligible?
- —
Short-term bridge; refi at stabilization.
Rent comps 40 comps
| Address | Beds | Baths | Sqft | Rent | $/sqft | DOM | Units | Dist |
|---|---|---|---|---|---|---|---|---|
| 2034 Ewald Cir Detroit, MI | 2.0 | 1.0 | 1000 | $995 | $0.99 | 7d | 1 | 0.01mi |
| 1875 Ewald Cir Unit 2E Detroit, MI | 1.0 | 1.0 | 725 | $875 | $1.21 | 7d | 1 | 0.13mi |
| 3266 Pasadena St Unit 3 Detroit, MI | 1.0 | 1.0 | 696 | $700 | $1.01 | 45d | 1 | 0.14mi |
| 3808 Kendall St Unit 3 Detroit, MI | 1.0 | 1.0 | 550 | $700 | $1.27 | 45d | 1 | 0.26mi |
| 1705 Oakman Blvd Unit 8 Detroit, MI | 1.0 | 1.0 | 650 | $950 | $1.46 | 0d | 1 | 0.29mi |
| 1705 Oakman Blvd Unit 5 Detroit, MI | 1.0 | 1.0 | 650 | $895 | $1.38 | 45d | 1 | 0.29mi |
| 1705 Oakman Blvd Unit 10 Detroit, MI | 1.0 | 1.0 | 650 | $895 | $1.38 | 26d | 1 | 0.29mi |
| 2341 Ewald Cir Unit 3 Detroit, MI | 1.0 | 1.0 | 600 | $900 | $1.50 | 45d | 1 | 0.30mi |
| 3812 W Grand St Detroit, MI | 2.0 | 1.0 | 1100 | $1,025 | $0.93 | 18d | 1 | 0.33mi |
| 4045 Clements St Detroit, MI | 3.0 | 1.0 | 850 | $1,150 | $1.35 | 45d | 1 | 0.44mi |
| 4045 Clements St Detroit, MI | 3.0 | 1.0 | 850 | $1,150 | $1.35 | 26d | 1 | 0.44mi |
| 3824 Tyler St Apt 1 Detroit, MI | 3.0 | 1.0 | 900 | $1,523 | $1.69 | 18d | 1 | 0.50mi |
| 2433 Pasadena St Unit 2435 Detroit, MI | 2.0 | 1.0 | 700 | $1,025 | $1.46 | 45d | 1 | 0.50mi |
| 3783 Tyler St Unit Lower Detroit, MI | 3.0 | 1.0 | 1000 | $1,150 | $1.15 | 45d | 1 | 0.51mi |
| 13639 La Salle Blvd Detroit, MI | 1.0 | 1.0 | 800 | $775 | $0.97 | 45d | 1 | 0.55mi |
| 13639 La Salle Blvd Detroit, MI | 2.0 | 1.0 | 800 | $695 | $0.87 | 13d | 1 | 0.55mi |
| 13641 La Salle Blvd Detroit, MI | 1.0 | 1.0 | 800 | $775 | $0.97 | 26d | 1 | 0.55mi |
| 4203 Tyler St Detroit, MI | 2.0 | 1.0 | 950 | $895 | $0.94 | 45d | 1 | 0.62mi |
| 14950 Stoepel St Detroit, MI | 2.0 | 1.0 | 600 | $900 | $1.50 | 26d | 1 | 0.62mi |
| 2690 Ewald Cir Detroit, MI | 1.0–2.0 | 1.0 | 750 | $900 | $1.20 | 26d | 4 | 0.67mi |
| 2676 Sturtevant St Unit 1 Detroit, MI | 2.0 | 1.0 | 1000 | $1,000 | $1.00 | 26d | 1 | 0.77mi |
| 2638 Richton St Unit 2638 Richton Upper Detroit, MI | 2.0 | 1.0 | 1000 | $900 | $0.90 | 45d | 1 | 0.90mi |
| 2630 Richton St Apt 105 Detroit, MI | 1.0 | 1.0 | 700 | $1,250 | $1.79 | 45d | 1 | 0.90mi |
| 2926 Ewald Cir Detroit, MI | 2.0 | 1.0 | 800 | $900 | $1.12 | 19d | 1 | 0.90mi |
| 4268 Cortland St Unit 1 Detroit, MI | 2.0 | 1.0 | 1000 | $1,050 | $1.05 | 45d | 1 | 0.93mi |
| 15906 Alden St Detroit, MI | 3.0 | 1.0 | 1030 | $1,150 | $1.12 | 18d | 1 | 0.99mi |
| 12728 Monica St Unit 2 Detroit, MI | 1.0 | 1.0 | 620 | $750 | $1.21 | 45d | 1 | 1.01mi |
| 12663 Stoepel St Unit 1 Detroit, MI | 2.0 | 1.0 | 750 | $975 | $1.30 | 19d | 1 | 1.02mi |
| 12663 Stoepel St Detroit, MI | 2.0 | 1.0 | 1100 | $1,050 | $0.95 | 23d | 1 | 1.02mi |
| 14656 Roselawn St Detroit, MI | 3.0 | 1.0 | 1000 | $1,200 | $1.20 | 19d | 1 | 1.04mi |
| 2285 Cortland St Detroit, MI | 2.0 | 1.0 | 900 | $1,000 | $1.11 | 18d | 1 | 1.06mi |
| 7350 Globe St Detroit, MI | 3.0 | 1.0 | 1000 | $1,550 | $1.55 | 5d | 1 | 1.08mi |
| 14550 Northlawn St Detroit, MI | 3.0 | 2.0 | 950 | $1,200 | $1.26 | 18d | 1 | 1.13mi |
| 16174 Princeton St Unit 2 Detroit, MI | 2.0 | 1.0 | 985 | $1,100 | $1.12 | 45d | 1 | 1.13mi |
| 16174 Princeton St Detroit, MI | 2.0 | 1.0 | 985 | $1,100 | $1.12 | 21d | 1 | 1.13mi |
| 12415 Monica St Detroit, MI | 2.0 | 1.0 | 1000 | $1,200 | $1.20 | 45d | 1 | 1.15mi |
| 14570 Cherrylawn St Detroit, MI | 3.0 | 1.0 | 840 | $1,250 | $1.49 | 14d | 1 | 1.18mi |
| 15771 Turner St Detroit, MI | 2.0 | 1.0 | 1000 | $1,049 | $1.05 | 45d | 1 | 1.24mi |
| 2023 Tuxedo St Detroit, MI | 1.0 | 1.0 | 650 | $795 | $1.22 | 45d | 1 | 1.30mi |
| 2023 Tuxedo St Detroit, MI | 1.0 | 1.0 | 650 | $895 | $1.38 | 7d | 1 | 1.30mi |
Listing history 21 events
-
2026-06-21days on market $119,900 Active 212 DOM
-
2026-06-18days on market $119,900 Active 209 DOM
-
2026-06-17days on market $119,900 Active 208 DOM
-
2026-06-15days on market $119,900 Active 206 DOM
-
2026-06-13days on market $119,900 Active 204 DOM
-
2026-06-13days on market $119,900 Active 203 DOM
-
2026-06-09days on market $119,900 Active 200 DOM
-
2026-06-08days on market $119,900 Active 199 DOM
-
2026-06-07days on market $119,900 Active 198 DOM
-
2026-06-04days on market $119,900 Active 195 DOM
-
2026-06-03days on market $119,900 Active 194 DOM
-
2026-06-01days on market $119,900 Active 192 DOM
-
2026-05-31days on market $119,900 Active 191 DOM
-
2026-01-31historical $999
-
2026-01-09$999
-
2026-01-09historical $999
-
2026-01-09$999
-
2026-01-09historical $999
-
2025-12-04$999
-
2025-11-21$119,900 Active 858-char remark
Show marketing remark (834 chars)
Offered at an exceptionally appealing price, this two-bedroom, townhouse-style half-duplex is a fantastic opportunity to own a home in one of Detroit's highly sought-after and rapidly developing neighborhoods. Inside, you'll find a bright and inviting layout featuring a well-kept kitchen, hardwood floors, fresh paint, and abundant natural light throughout. The private basement provides extra storage or potential for additional living space, while the large backyard offers room to relax, garden, or entertain. You'll enter into a spacious living room that sets the tone for the home's warm and comfortable feel. With several updates already in place, the property is just waiting for your personal cosmetic touches to make it truly your own. Seller financing is available, and terms are negotiable. Current market rent is $999.00.
-
2025-11-21$119,900 Active 834-char remark
Show marketing remark (834 chars)
Offered at an exceptionally appealing price, this two-bedroom, townhouse-style half-duplex is a fantastic opportunity to own a home in one of Detroit's highly sought-after and rapidly developing neighborhoods. Inside, you'll find a bright and inviting layout featuring a well-kept kitchen, hardwood floors, fresh paint, and abundant natural light throughout. The private basement provides extra storage or potential for additional living space, while the large backyard offers room to relax, garden, or entertain. You'll enter into a spacious living room that sets the tone for the home's warm and comfortable feel. With several updates already in place, the property is just waiting for your personal cosmetic touches to make it truly your own. Seller financing is available, and terms are negotiable. Current market rent is $999.00.
ⓘ Source: listings_history table (triggers on properties + properties_extension) + one-shot
backfill from property_details.listing_events for pre-trigger history.
Tax reassessment forecast MI · Partial reset (capped growth)
- Current annual tax
- $750 · $62/mo
- Projected year-2 tax
- $1,298 · $108/mo
- Expected delta
- +$548/yr (+$46/mo · 73.1%)
ⓘ Screening estimate from a state-policy table — verify with the county assessor before closing.
Climate risk First Street
- Flood 3/10 Moderate FEMA zone X (unshaded) · 10% chance over 30 yrs
- Wildfire 1/10 Low
- Heat 3/10 Moderate 7 d/yr ≥97°F today · 15 d/yr by 30 yrs out
- Wind 2/10 Low
- Air quality 4/10 Moderate 4 unhealthy d/yr today · 6 by 30 yrs out
Nearby sold comps map
Loading sold comps map…
Walkable amenities ~0.75 mi
Loading nearby amenities…
Taxation est. · year 1
- Rental income
- $12,062
- − Mortgage interest
- −$6,716
- − Property taxes
- −$750
- − Insurance
- −$600
- − Repairs & maintenance
- −$965
- − Management
- −$965
- − Depreciation
- −$3,488
- Taxable loss
- −$1,422
- Est. tax savings @ 24.0%
- +$341
- After-tax cash flow
- $975/yr
For passive investors: Depreciation is non-cash, so a rental often shows a tax loss while cash-flowing — sheltering income. Rental losses are passive: they offset passive income freely, and up to $25,000/yr can offset ordinary (W-2) income if you actively participate and your MAGI is under $100k (phasing out to $0 by $150k); unused losses carry forward. On sale, claimed depreciation is recaptured at up to 25%, and gains may owe capital-gains tax (a 1031 exchange can defer both). Figures are a year-1 estimate at your 24.0% rate — not tax advice; consult a CPA.
Schools (NCES district)
- District
- Detroit Public Schools Community District
- NCES district ID
- 2601103
- Math proficiency
- 10% ▼ -2.00%
- Reading proficiency
- 24% ▲ 6.00%
- Median HH income
- $25,815
- Composite
- 13.06/100
- National rank
- #9564
- State rank
- #499 of 540 in MI
Livability — Detroit
- Score
- 73/100
- State rank
- #218
- US rank
- #5427
Category grades
Schools grade is shown separately in the Schools card above.
Census & demographics
- Census place
- Detroit, MI
- County
- Wayne County · 1,562,939 people
- City population
- 572,865
- Metro
- Detroit-Warren-Dearborn, MI
- Population (ZIP)
- 24,731
- Household income
- $33,315
- Rent vs Own
- Severe rent burden
- 2172.0
Population outlook (Wayne County) Hauer SSP2
- Today (2025)
- 1,675,273 people
- By 2030
- 1,620,300 · -3.3%
- By 2040
- 1,502,341 · -10.3%
- By 2050
- 1,384,039 · -17.4%
- By 2075
- 1,124,592 · -32.9%
- By 2100
- 881,193 · -47.4%
Race, ethnicity, and origin ACS 2023
- Neighborhood character
- Predominantly Black (94%)
- Race & ethnicity
- Black 94% Two or more races 3% White 1%
- Foreign-born
- 1%
Political lean MEDSL · Wayne
- 2024 margin
- Strong D (+29.0) · D 62.7% · R 33.7% · Other 3.6%
- 2008→2024 swing
- -20.5pp toward R · 2008: 49.5pp · 2024: 29.0pp
- All cycles
- 2024: D+29.0 2020: D+38.1 2016: D+37.3 2012: D+46.9 2008: D+49.5
Not yet ingested
- Civics
- —
Market trends
- HPI YoY
- ▼ -31.96%
- Current HPI
- 189.6227
- Rent YoY
- ▲ 6.14%
- Metro
- Detroit-Warren-Dearborn, MI
- State GDP YoY
- ▲ 1.37%
- F500 in state
- 28
Industry mix (Fortune 500 HQ in MI)
| Industry | F500 HQs | Revenue |
|---|---|---|
| Automotive Parts | 3 | $48B |
|
||
| Automotive | 2 | $372B |
|
||
| Chemicals | 1 | $45B |
|
||
| Automotive Retail | 1 | $29B |
|
||
| Healthcare / Medical Devices | 1 | $23B |
|
||
| Automotive Technology | 1 | $20B |
|
||
Price history
+0.0% since first listed8 events — show timeline
- 2026-01-31 Rental Removed $999 REALSOURCE
- 2026-01-09 Listed for Rent $999 REALSOURCE
- 2026-01-09 Rental Removed $999 SWMMLS
- 2026-01-09 Listed for Rent $999 SWMMLS
- 2026-01-09 Rental Removed $999 SHOWMOJO
- 2025-12-04 Listed for Rent $999 SHOWMOJO
- 2025-11-21 Listed $119,900 REALCOMP
- 2025-11-21 Listed $119,900 MiRealSource-MiMLS
Property tax history
-2.1%/yrLatest (2025): $750 · -36.1% YoY. Source: county tax records.
Cash-flow waterfall
monthlySold comps — $/sqft
last 12 mo · ≤1 miLoading sold comps…