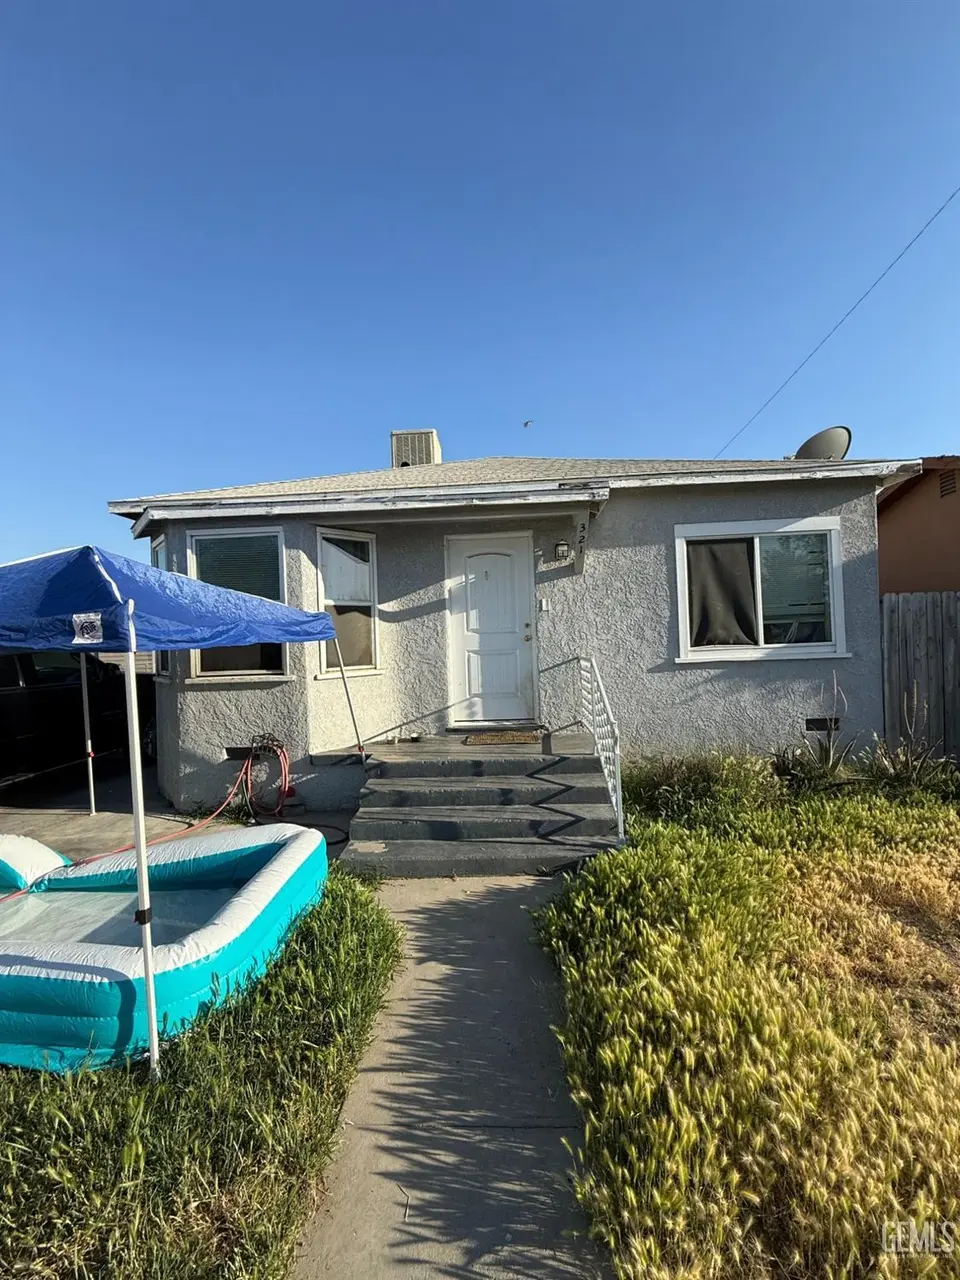
321 Sperry St · Rexland Acres, CA
Flood risk 1/10 · Minimal
- FEMA flood zone
- X (unshaded)
- Chance of flooding over 30 yrs
- 0.0%
- Est. flood insurance / yr
- $507 – $1,088
Fire risk 4/10 · Minor
- Est. fire insurance / yr
- $659 – $1,223
Heat risk 8/10 · Major
- Hot days now (above 105°F)
- 7 days/yr
- Hot days in 30 yrs
- 18 days/yr
Wind risk 1/10 · Minimal
- Chance of severe wind over 30 yrs
- —
Air-quality risk 10/10 · Severe
- Unhealthy air days now
- 33 days/yr
- Unhealthy air days in 30 yrs
- 37 days/yr
Risk factors via First Street. Map © Google.
Why this score? — see what drove the D grade
The composite is a weighted blend of 9 inputs, each scored 0–100. Each bar is that input's sub-score; the figure is the points it added to the 100-point composite (weight × sub-score).
- ARV discount +15.0/15.0
- Cash flow +10.1/30.0
- Rent growth +3.9/5.0
- Schools +3.4/10.0
- 1% rule +3.3/10.0
- DSCR +2.9/10.0
- Livability +2.5/5.0
- Condition / age +2.5/5.0
- Appreciation +0.0/10.0
$199,900
🖨 Deal sheet (PDF) 📄 Offer letter ✓ Due diligence
Listing remarks
Great opportunity at 321 Sperry St, Bakersfield, CA 93307. This 2-bedroom, 1-bath home features newer windows, a 2-car garage with alley access, and a convenient location near local parks and schools. The kitchen has been updated with granite countertops, giving the home a nice head start for the next owner. Property could use some TLC, but offers plenty of potential for a buyer looking to add their own personal touch.
Key facts
- Alley access
- Near schools
- Near local parks
Tags
Property features AI
Finance
- Other: Occupied by tenant
Exterior
- Parking: 2-car garage; Carport
- Utilities: Septic tank; Public water
- Home design: Zoned R1
- Construction: Composition roof
- Exterior features: Neighborhood: Rexland Acres; Cross street at Garber Way
Interior
- Bathrooms: 1 full bathroom
- Heating & cooling: Evaporative cooling
- Interior features: Formal living room; Evaporative cooling
Neighborhood map
What this means for you Summary
Snapshot
- This is a 2-bed/1.0-bath single-family listed at $200k.
Deal economics
- At list price, monthly cash flow is $-118 ($-1k/yr) — negative.
- To cash-flow at today's rent, offer at most $179k (10.4% below list).
- To meet the 1% rule (rent ≥ 1% of price), the offer needs to be $165k (17.4% below list).
- Recommended offer: $165k (17.4% below list) — sets the bar for 1% rule.
Location & tenants
- Location reads: area grade D — affects rentability + tenant quality, not the cash-flow math above.
- Kern High (urban): math 21% / reading 51% proficiency, ranked #860 of 1,400 in CA (top 61%) — families likely to look elsewhere, expect single-tenant / working-renter base with shorter leases.
- Zoned schools: Golden Valley High (reading 77%, 2,533 students, 91% FRL).
- Market conditions: Rents rising fast (+5.7%/yr); 314 active listings in the ZIP; 8 comparable units currently listed for rent nearby; rentals leasing fast (median 5d on market — plan ~1-2 weeks tenant-placement turnaround); 3,244 units permitted in Kern County in 2024 (73 in 5+ unit buildings).
- This rent runs 35% of the median local income ($56k/yr) — at the standard rent-burdened threshold; future hikes will face affordability resistance.
Forward outlook
- Local home prices are declining (-3.0%/yr); year-one equity from $1k of loan paydown is wiped out by about $6k of value loss. Plan a longer hold.
- Kern County population projected at +17% by 2050 — long-run rental-demand tailwind backs the buy-and-hold thesis.
Negotiation context
- It's been on market 19 days — a 2% lower offer ($197k) is reasonable based on typical stale-listing flexibility.
Risks & watch-outs
- Watch-outs: built in 1947 — expect roof / HVAC / electrical / plumbing capex.
- Climate carrying-cost: extreme-heat days projected 7→18/yr by 2055 (HVAC capex compounding) — expect insurance premiums to compound above CPI over the hold.
Questions for the listing agent
- What do current leases actually rent for vs. the listed asking? Can we see a recent rent roll and the last 12 months of T-12 income?
- Built in 1947 — when were the roof, HVAC, electrical panel, plumbing, and water heater last replaced?
- Is there a deadline driving the sale (1031 exchange, divorce, estate, relocation)? That informs how much negotiation room exists.
- The area grade is low — what's the realistic commute time and amenity access for the typical tenant pool here? Any planned neighborhood developments (good or bad) we should know about?
- What's the average days-on-market for RENTAL listings here right now (not sales)? A rising rental-DOM trend means longer vacancies and softer asking-rent achievability than the comps imply.
- What's the recent tenant-quality profile in this submarket — average credit score on applications, eviction rate, late-payment / NSF rate, and stable-employment percentage? A property-management company in the area should have these aggregated.
- How much new for-sale + rental construction is in the pipeline within 1–3 miles? Heavy new supply typically softens prices + rents 12–24 months out; constrained supply supports both.
Investment metrics
- 1% rule
- 0.83% ✗
- Cap rate
- 5.58%
- Cash-on-cash
- -2.53%
- DSCR
- 0.89
- GRM
- 10.1
CMA / ARV
- ARV (median comp)
- $259,140
- List price
- $199,900
- Delta
- -22.86%
- Verdict
- UNDERPRICED
- Comps
- 20 within 1.0 mi
Show comp detail 6 sales within ~0.75 mi
| Address | Dist | Beds/Ba | Sqft | Sold | Price | $/sf | Match |
|---|---|---|---|---|---|---|---|
| 412 E Fairview Rd | 0.11mi | 2/1.0 | 891 (+8%) | 3mo | $275,000 | $309 | 78 |
| 333 Price St | 0.07mi | 2/1.0 | 884 (+8%) | 14mo | $225,225 | $255 | 72 |
| 521 Burchfield | 0.28mi | 3/1.0 (+1) | 900 (+10%) | 4mo | $180,000 | $200 | 62 |
| 436 E Fairview Rd | 0.17mi | 2/1.0 | 936 (+14%) | 11mo | $240,000 | $256 | 59 |
| 342 Rexland Dr | 0.42mi | 1/1.0 (-1) | 869 (+6%) | 13mo | $228,000 | $262 | 55 |
| 2732 Karen Pl | 0.24mi | 3/1.0 (+1) | 728 (-11%) | 13mo | $264,000 | $363 | 54 |
Match score weights: distance 35% · size 25% · config 20% · recency 20%. Top-matched comps best support the ARV.
Projected returns pro-forma
-3.0% appreciation · 5.71% rent growth · sell at horizon
- IRR
- -17.4%
- Equity multiple
- 0.37×
- Total profit
- $-35,237
- Equity at exit
- $29,806
- IRR
- -4.9%
- Equity multiple
- 0.64×
- Total profit
- $-20,106
- Equity at exit
- $17,284
Cash invested: $55,972 (down + closing). Projections, not guarantees.
Landlord ↔ Tenant lean methodology
- Overall (STATE)
- 18 Strongly Tenant-Friendly
- State California
- 18 Strongly Tenant-Friendly · D+13
- County
- — inherits STATE
- City
- — inherits STATE
ZIP-level market 93307
- Rents YoY
- 5.7%
- Active inventory
- 314
- Price-to-rent
- 10.1×
Monthly cashflow live
- Estimated rent
- $1,651 high interval (Pro) →
- Mortgage (P&I)
- −$1,048
- Tax from tax record
- −$291 /mo · $3,487/yr
- Insurance
- −$83
- HOA
- −$0
- Vacancy / Maint / Mgmt
- −$347
- Net cashflow
- $-118
Break-even live
Sensitivity live
| Price | -10% $-5 | -5% $-61 | +0% $-118 | +5% $-175 | +10% $-231 |
|---|---|---|---|---|---|
| Rent | -10% $-248 | -5% $-183 | +0% $-118 | +5% $-53 | +10% $12 |
| Rate | -1.0pp $-17 | -0.5pp $-67 | base $-118 | +0.5pp $-170 | +1.0pp $-223 |
UW: 25.0% down · 7.5% · 30yr · 1.5% tax · 5.0% vac · 8.0% maint · 8.0% mgmt
Financing live
Cash to close
- Down payment
- $49,975
- Closing costs
- $5,997
- Reserves months
- —
- Total cash needed
- —
Loan-product check · same deal, 3 products live
Conventional
25% down · 7.5% · 30yr
- Down + closing
- —
- Monthly P&I
- —
- Monthly cashflow
- —
- DSCR
- —
- Eligible?
- —
Personal DTI + credit; lowest rate.
DSCR
20% down · 8.5% · 30yr
- Down + closing
- —
- Monthly P&I
- —
- Monthly cashflow
- —
- DSCR
- —
- Eligible?
- —
No personal income docs; deal must DSCR.
Hard money
10% down · 12.0% · 12mo
- Down + closing
- —
- Monthly P&I
- —
- Monthly cashflow
- —
- DSCR
- —
- Eligible?
- —
Short-term bridge; refi at stabilization.
Rent comps 8 comps
| Address | Beds | Baths | Sqft | Rent | $/sqft | DOM | Units | Dist |
|---|---|---|---|---|---|---|---|---|
| 1050 E Panama Ln Bakersfield, CA | 2.0 | 2.0 | 1015 | $1,895 | $1.87 | 45d | 1 | 0.55mi |
| 331 Pacheco Rd Bakersfield, CA | 2.0–3.0 | 1.5–2.0 | 1147 | $1,575 | $1.37 | 4d | 3 | 0.67mi |
| 4519 Gordon St Bakersfield, CA | 3.0 | 1.0 | 1051 | $1,695 | $1.61 | 4d | 1 | 0.82mi |
| 4412 Gordon St Bakersfield, CA | 3.0 | 1.0 | 1039 | $1,795 | $1.73 | 4d | 1 | 0.85mi |
| 813 Karma Ct Apt D Bakersfield, CA | 2.0 | 1.0 | 862 | $1,150 | $1.33 | 16d | 1 | 0.91mi |
| 1000 Pacheco Rd Unit 131 Bakersfield, CA | 3.0 | 1.0 | 1095 | $1,650 | $1.51 | 4d | 1 | 1.05mi |
| 400 White Ln Bakersfield, CA | 2.0 | 1.0 | 900 | $1,399 | $1.55 | 4d | 1 | 1.13mi |
| 5213 S H St Unit A Bakersfield, CA | 2.0 | 1.0 | 850 | $1,495 | $1.76 | 5d | 1 | 1.41mi |
Listing history 5 events
-
2026-06-01days on market $199,900 Active 19 DOM
-
2026-05-31days on market $199,900 Active 18 DOM
-
2026-05-12$209,900 Active 422-char remark
-
2021-05-27soldstatus $175,000
-
2020-10-22soldstatus $98,500
ⓘ Source: listings_history table (triggers on properties + properties_extension) + one-shot
backfill from property_details.listing_events for pre-trigger history.
Tax reassessment forecast CA · Resets to sale price
- Current annual tax
- $3,487 · $291/mo
- Projected year-2 tax
- $3,487 · $291/mo
- Expected delta
- $0/yr ($0/mo · 0.0%)
ⓘ Screening estimate from a state-policy table — verify with the county assessor before closing.
Climate risk First Street
- Flood 1/10 Low FEMA zone X (unshaded) · 0% chance over 30 yrs
- Wildfire 4/10 Moderate
- Heat 8/10 Severe 7 d/yr ≥105°F today · 18 d/yr by 30 yrs out
- Wind 1/10 Low
- Air quality 10/10 Extreme 33 unhealthy d/yr today · 37 by 30 yrs out
Nearby sold comps map
Loading sold comps map…
Walkable amenities ~0.75 mi
Loading nearby amenities…
Taxation est. · year 1
- Rental income
- $19,809
- − Mortgage interest
- −$11,198
- − Property taxes
- −$3,487
- − Insurance
- −$1,000
- − Repairs & maintenance
- −$1,585
- − Management
- −$1,585
- − Depreciation
- −$5,815
- Taxable loss
- −$4,859
- Est. tax savings @ 24.0%
- +$1,166
- After-tax cash flow
- $-250/yr
For passive investors: Depreciation is non-cash, so a rental often shows a tax loss while cash-flowing — sheltering income. Rental losses are passive: they offset passive income freely, and up to $25,000/yr can offset ordinary (W-2) income if you actively participate and your MAGI is under $100k (phasing out to $0 by $150k); unused losses carry forward. On sale, claimed depreciation is recaptured at up to 25%, and gains may owe capital-gains tax (a 1031 exchange can defer both). Figures are a year-1 estimate at your 24.0% rate — not tax advice; consult a CPA.
Schools (NCES district)
- District
- Kern High
- NCES district ID
- 0619540
- Math proficiency
- 21% ▬ 0.00%
- Reading proficiency
- 51% ▲ 2.00%
- Median HH income
- $49,686
- Composite
- 33.68/100
- National rank
- #10443
- State rank
- #860 of 1400 in CA
Livability — Rexland Acres
No livability data for this city. (Only ~50 U.S. cities are tracked.)
Census & demographics
- Census place
- Rexland Acres, CA
- County
- Kern County · 710,371 people
- Metro
- Bakersfield, CA
- Population (ZIP)
- 85,945
- Household income
- $56,446
- Rent vs Own
- Severe rent burden
- 3246.0
Population outlook (Kern County) Hauer SSP2
- Today (2025)
- 947,286 people
- By 2030
- 978,984 · +3.3%
- By 2040
- 1,045,018 · +10.3%
- By 2050
- 1,105,232 · +16.7%
- By 2075
- 1,229,538 · +29.8%
- By 2100
- 1,238,059 · +30.7%
Race, ethnicity, and origin ACS 2023
- Neighborhood character
- Predominantly Hispanic (80%)
- Race & ethnicity
- Hispanic / Latino 80% Two or more races 12% White 10% Black 6% Asian 3% Native American 1%
- Hispanic origin (detail)
- Mexican 73%
- Common ancestry
- Lithuanian 0%
- Foreign-born
- 31% · Canada
- Languages at home
- 28% English-only · Spanish 69% Other Indo-European 1% Arabic 1%
Political lean MEDSL · Kern
- 2024 margin
- Strong R (+21.1) · D 38.2% · R 59.3% · Other 2.5%
- 2008→2024 swing
- -3.3pp toward R · 2008: -17.8pp · 2024: -21.1pp
- All cycles
- 2024: R+21.1 2020: R+10.2 2016: R+15.0 2012: R+20.9 2008: R+17.8
Not yet ingested
- Civics
- —
Market trends
- HPI YoY
- ▼ -263.59%
- Current HPI
- 447.1746
- Rent YoY
- ▲ 5.71%
- Metro
- Bakersfield, CA
- State GDP YoY
- ▲ 3.21%
- F500 in state
- 116
Industry mix (Fortune 500 HQ in CA)
| Industry | F500 HQs | Revenue |
|---|---|---|
| Technology | 27 | $1,492B |
|
||
| Financial Services | 3 | $174B |
|
||
| Retail | 3 | $44B |
|
||
| Insurance | 3 | $26B |
|
||
| Media / Entertainment | 2 | $115B |
|
||
| Pharmaceuticals / Biotech | 2 | $62B |
|
||
Price history
+102.9% since first listed4 events — show timeline
- 2026-05-27 Price Changed $199,900 GEMLS
- 2026-05-12 Listed $209,900 GEMLS
- 2021-05-27 Sold (Public Records) $175,000 Public Records
- 2020-10-22 Sold (Public Records) $98,500 Public Records
Property tax history
+6.9%/yrLatest (2025): $3,487 · +2.1% YoY. Source: county tax records.
Cash-flow waterfall
monthlySold comps — $/sqft
last 12 mo · ≤1 miLoading sold comps…