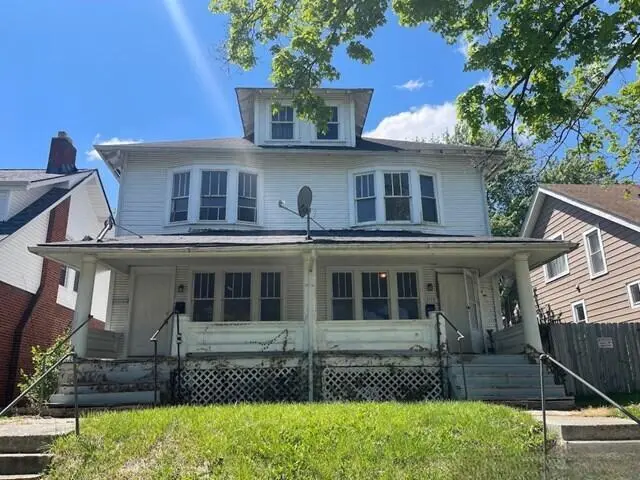
 Duplex
1175 Oakwood Ave · Columbus, OH
Flood risk 1/10 · Minimal
- FEMA flood zone
- X (unshaded)
- Chance of flooding over 30 yrs
- 0.0%
- Est. flood insurance / yr
- $473 – $860
Fire risk 1/10 · Minimal
- Est. fire insurance / yr
- $713 – $1,323
Heat risk 4/10 · Minor
- Hot days now (above 100°F)
- 7 days/yr
- Hot days in 30 yrs
- 18 days/yr
Wind risk 2/10 · Minimal
- Chance of severe wind over 30 yrs
- 1.0%
Air-quality risk 3/10 · Minor
- Unhealthy air days now
- 2 days/yr
- Unhealthy air days in 30 yrs
- 3 days/yr
Risk factors via First Street. Map © Google.
Why this score? — see what drove the B+ grade
The composite is a weighted blend of 9 inputs, each scored 0–100. Each bar is that input's sub-score; the figure is the points it added to the 100-point composite (weight × sub-score).
- Cash flow +30.0/30.0
- ARV discount +15.0/15.0
- DSCR +10.0/10.0
- 1% rule +8.8/10.0
- Livability +4.0/5.0
- Rent growth +3.4/5.0
- Condition / age +2.2/5.0
- Schools +1.7/10.0
- Appreciation +0.0/10.0
$254,900
🖨 Deal sheet 📄 Offer letter ✓ Due diligence
Multi-family units
County records classify this as Multi-Family (2-4 Unit). Listing-text estimate: 2 units. confirmed
Listing remarks
Large duplex with each side having 3 bedrooms and 1 bath. Live in 1 side and rent the other to cover your mortgage. Call your Realtor today for a viewing.
Key facts
- 5,662 sq ft lot
- 2 parking spots
- Built 1924
Property features AI
Finance
- Other: Listing marked as Real Estate Owned
- Financial info: Taxes reported for 2024
Exterior
- Parking: 2 parking spaces
- Utilities: Public water; Public sewer
- Home design: Duplex; Built in 1924
- Exterior features: Lot approximately 0.13 acres (about 5,662.8 sq ft); Located near Stewart Ave
Interior
- Bedrooms: 2 total units
- Interior features: Duplex (multi-unit property)
Neighborhood map
What this means for you Summary
Snapshot
- This is a 2 × 3-bed/1-bath units multifamily listed at $255k. Condition is rated fair.
Deal economics
- At list price, monthly cash flow is $1k ($12k/yr) — positive. Per door: $509/mo.
- The deal already cash-flows at list — no discount required.
- Meets the 1% rule at list price ($4k rent vs $255k).
- Recommended offer: $251k (1.5% below list) — sets the bar for market timing.
- Cap rate 11.1% vs local median 3.8% in Columbus — top-decile yield for the area; either an underpriced asset or a hidden risk that comps aren't pricing in. Stress-test before assuming the spread holds.
Location & tenants
- Location reads 81/100 on livability (#97 in OH, #1,491 nationally) — a professional / high-income tenant draw. Strengths: commute A+, cost of living A+, housing A+; Watch: employment C-, crime F.
- Columbus City School District (urban): math 15% / reading 26% proficiency, ranked #626 of 656 in OH (top 95%) — low school quality limits family demand, transient renter base, plan for 1-2y turnover; 72% free/reduced lunch — lower-income household profile, screen leases tightly.
- Market conditions: Rents rising (+3.5%/yr); 193 active listings in the ZIP; 2 comparable units currently listed for rent nearby; solid renter incomes; 8,139 units permitted in Franklin County in 2024 (5,940 in 5+ unit buildings).
- At $3,518/mo this rent would consume 56% of the median local household income ($76k/yr) (locally 846% of renters already pay >50% of income on rent) — very limited rent-growth headroom before tenants either downsize or default.
Forward outlook
- Local home prices are declining (-3.0%/yr); year-one equity from $2k of loan paydown is wiped out by about $8k of value loss. Plan a longer hold.
- Franklin County population projected at +34% by 2050 — long-run rental-demand tailwind backs the buy-and-hold thesis.
- At projected returns (-3.0% appreciation + 3.5% rent growth), your $71k cash investment doubles in ~7 years — after that, you're playing with house money.
Negotiation context
- It's been on market 23 days — a 2% lower offer ($251k) is reasonable based on typical stale-listing flexibility.
- 2 sale attempts with the ask held roughly flat each time — persistent listings suggest the price (not the market) is what's stuck; bring a comps-based counter.
Risks & watch-outs
- Watch-outs: built in 1924 — expect roof / HVAC / electrical / plumbing capex.
Questions for the listing agent
- Can we see the unit-by-unit rent roll, current vacancy, and any below-market leases? What's the average tenancy length?
- What capital expenditures (roof, boiler, parking lot, exteriors) have been made in the last 5 years, and what's planned in the next 2?
- Have any recent inspections been done? Can we get a copy of the seller's disclosures and any deferred-maintenance estimates?
- Built in 1924 — when were the roof, HVAC, electrical panel, plumbing, and water heater last replaced?
- Is there a deadline driving the sale (1031 exchange, divorce, estate, relocation)? That informs how much negotiation room exists.
- Crime grade is F in this area — have there been break-ins, vandalism, or insurance claims at this property in the last 3 years? What carrier currently insures it and at what premium?
- What's the average days-on-market for RENTAL listings here right now (not sales)? A rising rental-DOM trend means longer vacancies and softer asking-rent achievability than the comps imply.
- What's the recent tenant-quality profile in this submarket — average credit score on applications, eviction rate, late-payment / NSF rate, and stable-employment percentage? A property-management company in the area should have these aggregated.
- How much new apartment / multifamily construction is in the pipeline within 1–3 miles? Heavy new supply (>2% of stock underway) typically softens rents 12–24 months out; light construction supports rent growth.
Investment metrics
- 1% rule
- 1.38% ✓
- Cap rate
- 11.08%
- Cash-on-cash
- 17.11%
- DSCR
- 1.76
- GRM
- 6.0
CMA / ARV
- ARV (on-the-fly)
- $424,704
- Comps found
- 12
Show comp detail 12 sales within ~0.75 mi
| Address | Dist | Beds/Ba | Sqft | Sold | Price | $/sf | Match |
|---|---|---|---|---|---|---|---|
| 1165-1167 E Whittier St | 0.27mi | 6/— | 2,596 (-3%) | 3mo | $411,000 | $158 | 79 |
| 1113-1115 S Ohio Ave | 0.15mi | 6/— | 2,576 (-4%) | 11mo | $387,000 | $150 | 77 |
| 1167-1169 Wilson Ave | 0.09mi | 6/— | 2,464 (-8%) | 7mo | $220,000 | $89 | 76 |
| 1314 S Champion Ave | 0.21mi | 6/— | 2,464 (-8%) | 2mo | $220,000 | $89 | 75 |
| 917 Lockbourne Rd | 0.54mi | 6/— | 2,700 (+0%) | 12mo | $380,000 | $141 | 64 |
| 519-521 E Deshler Ave | 0.66mi | 6/— | 2,610 (-3%) | 2mo | $415,000 | $159 | 63 |
| 1306-1308 Wilson Ave | 0.21mi | 6/— | 2,352 (-12%) | 9mo | $373,450 | $159 | 62 |
| 1142-1144 Wilson Ave | 0.14mi | 6/— | 2,376 (-12%) | 15mo | $237,500 | $100 | 62 |
| 1328-1330 S Champion Ave | 0.23mi | 6/— | 2,432 (-10%) | 16mo | $479,900 | $197 | 60 |
| 1021-1023 Miller Ave | 0.49mi | 6/— | 2,352 (-12%) | 4mo | $372,000 | $158 | 53 |
| 887 E Livingston Ave | 0.64mi | 6/— | 2,496 (-7%) | 9mo | $400,000 | $160 | 51 |
| 857-859 Wilson Ave | 0.49mi | 6/— | 3,055 (+14%) | 13mo | $465,000 | $152 | 44 |
Match score weights: distance 35% · size 25% · config 20% · recency 20%. Top-matched comps best support the ARV.
Projected returns pro-forma
-3.0% appreciation · 3.51% rent growth · sell at horizon
- IRR
- 9.0%
- Equity multiple
- 1.36×
- Total profit
- $25,378
- Equity at exit
- $38,006
- IRR
- 18.6%
- Equity multiple
- 2.59×
- Total profit
- $113,298
- Equity at exit
- $22,039
Cash invested: $71,372 (down + closing). Projections, not guarantees.
Landlord ↔ Tenant lean methodology
- Overall (STATE)
- 73 Landlord-Friendly
- State Ohio
- 73 Landlord-Friendly · R+6
- County
- — inherits STATE
- City
- — inherits STATE
ZIP-level market 43206
- Rents YoY
- 3.5%
- Active inventory
- 193
- Price-to-rent
- 12.1×
Monthly cashflow live
- Estimated rent
- $3,518 high interval (Pro) →
- Mortgage (P&I)
- −$1,337
- Tax est. 1.5%
- −$319 /mo · $3,824/yr
- Insurance
- −$106
- HOA
- −$0
- Vacancy / Maint / Mgmt
- −$739
- Net cashflow
- $1,018
Break-even live
2-unit breakdown (identical units grouped — click to expand)
| Units | Beds | Baths | Est. rent |
|---|---|---|---|
| 2× units | 3 | 1 | $3,518 |
| #1 | 3 | 1 | $1,759 |
| #2 | 3 | 1 | $1,759 |
| Total (2 units) | $3,518 | ||
UW: 25.0% down · 7.5% · 30yr · 1.5% tax · 5.0% vac · 8.0% maint · 8.0% mgmt
Financing live
Cash to close
- Down payment
- $63,725
- Closing costs
- $7,647
- Reserves months
- —
- Total cash needed
- —
Loan-product check · same deal, 3 products live
Conventional
25% down · 7.5% · 30yr
- Down + closing
- —
- Monthly P&I
- —
- Monthly cashflow
- —
- DSCR
- —
- Eligible?
- —
Personal DTI + credit; lowest rate.
DSCR
20% down · 8.5% · 30yr
- Down + closing
- —
- Monthly P&I
- —
- Monthly cashflow
- —
- DSCR
- —
- Eligible?
- —
No personal income docs; deal must DSCR.
Hard money
10% down · 12.0% · 12mo
- Down + closing
- —
- Monthly P&I
- —
- Monthly cashflow
- —
- DSCR
- —
- Eligible?
- —
Short-term bridge; refi at stabilization.
Rent comps 2 comps
| Address | Beds | Baths | Sqft | Rent | $/sqft | DOM | Units | Dist |
|---|---|---|---|---|---|---|---|---|
| 438 S Ohio Ave Columbus, OH | 5.0 | 2.0 | 1900 | $2,195 | $1.16 | 43d | 1 | 1.06mi |
| 2089 Lockbourne Rd Columbus, OH | 5.0 | 2.0 | 2534 | $2,800 | $1.10 | 10d | 1 | 1.25mi |
Listing history 19 events
-
2026-06-18days on market $254,900 Active 23 DOM
-
2026-06-17days on market $254,900 Active 22 DOM
-
2026-06-16days on market $254,900 Active 21 DOM
-
2026-06-15days on market $254,900 Active 20 DOM
-
2026-06-13days on market $254,900 Active 18 DOM
-
2026-06-13days on market $254,900 Active 17 DOM
-
2026-06-09days on market $254,900 Active 14 DOM
-
2026-06-08days on market $254,900 Active 13 DOM
-
2026-06-07days on market $254,900 Active 12 DOM
-
2026-06-05days on market $254,900 Active 9 DOM
-
2026-06-03days on market $254,900 Active 8 DOM
-
2026-06-02days on market $254,900 Active 7 DOM
-
2026-06-01days on market $254,900 Active 6 DOM
-
2026-05-31days on market $254,900 Active 5 DOM
-
2026-05-26$254,900 Active
-
2025-09-30price $259,000
-
2025-09-30historical
-
2025-09-18price $269,000
-
2025-08-01$300,000 Active
ⓘ Source: listings_history table (triggers on properties + properties_extension) + one-shot
backfill from property_details.listing_events for pre-trigger history.
Climate risk First Street
- Flood 1/10 Low FEMA zone X (unshaded) · 0% chance over 30 yrs
- Wildfire 1/10 Low
- Heat 4/10 Moderate 7 d/yr ≥100°F today · 18 d/yr by 30 yrs out
- Wind 2/10 Low 100% chance of damaging wind over 30 yrs
- Air quality 3/10 Moderate 2 unhealthy d/yr today · 3 by 30 yrs out
Nearby sold comps map
Loading sold comps map…
Walkable amenities ~0.75 mi
Loading nearby amenities…
Taxation est. · year 1
- Rental income
- $42,216
- − Mortgage interest
- −$14,278
- − Property taxes
- −$3,824
- − Insurance
- −$1,274
- − Repairs & maintenance
- −$3,377
- − Management
- −$3,377
- − Depreciation
- −$7,415
- Taxable income
- $8,670
- Est. tax owed @ 24.0%
- −$2,081
- After-tax cash flow
- $10,131/yr
For passive investors: Depreciation is non-cash, so a rental often shows a tax loss while cash-flowing — sheltering income. Rental losses are passive: they offset passive income freely, and up to $25,000/yr can offset ordinary (W-2) income if you actively participate and your MAGI is under $100k (phasing out to $0 by $150k); unused losses carry forward. On sale, claimed depreciation is recaptured at up to 25%, and gains may owe capital-gains tax (a 1031 exchange can defer both). Figures are a year-1 estimate at your 24.0% rate — not tax advice; consult a CPA.
Condition & rehab AI · 13 photos
This two-unit property requires extensive repairs and maintenance to improve its condition and increase its resale and rental value.
Repairs flagged
- Major Exposed wiring in the kitchen — Safety hazard
- Major Missing cabinets in the kitchen — Aesthetically unappealing and functional
- Major Exposed plumbing in the bathrooms — Safety hazard
- Major Missing fixtures in the bathrooms — Aesthetically unappealing and functional
- Major Peeling paint on exterior — Reduces curb appeal
- Major Rusted railings on exterior — Safety hazard
- Major Overgrown landscaping — Reduces curb appeal
- Major Exposed drywall in multiple rooms — Safety hazard
- Major Worn hardwood floors — Reduces value
- Major No visible HVAC or mechanical systems — Safety hazard
Value-add opportunities
- Both Painting and re-staining the exterior — Improves curb appeal and rental value
- Both Re-roofing — Fixes a major safety hazard and improves resale value
- Both Re-painting interior walls and cabinets — Improves aesthetics and rental value
- Both Re-finishing hardwood floors — Improves aesthetics and rental value
- Both Re-plumbing and re-installing fixtures in bathrooms — Fixes safety hazard and improves aesthetics
- Both Re-installing cabinets in kitchen — Fixes safety hazard and improves aesthetics
- Both Re-installing HVAC and mechanical systems — Fixes safety hazard and improves aesthetics
Renovation cost estimate screening
| Repair item | Severity | Est. cost |
|---|---|---|
| Exposed wiring in the kitchen · Safety hazard | Major | $15,000–50,000 |
| Missing cabinets in the kitchen · Aesthetically unappealing and functional | Major | $15,000–50,000 |
| Exposed plumbing in the bathrooms · Safety hazard | Major | $15,000–50,000 |
| Missing fixtures in the bathrooms · Aesthetically unappealing and functional | Major | $15,000–50,000 |
| Peeling paint on exterior · Reduces curb appeal | Major | $15,000–50,000 |
| Rusted railings on exterior · Safety hazard | Major | $15,000–50,000 |
| Overgrown landscaping · Reduces curb appeal | Major | $15,000–50,000 |
| Exposed drywall in multiple rooms · Safety hazard | Major | $15,000–50,000 |
| Worn hardwood floors · Reduces value | Major | $15,000–50,000 |
| No visible HVAC or mechanical systems · Safety hazard | Major | $15,000–50,000 |
| Total estimated repair cost · 10 items | $150,000–500,000 |
Value-add ROI direction
- Both Painting and re-staining the exterior — Improves curb appeal and rental value ↑
- Both Re-roofing — Fixes a major safety hazard and improves resale value ↑
- Both Re-painting interior walls and cabinets — Improves aesthetics and rental value ↑
- Both Re-finishing hardwood floors — Improves aesthetics and rental value ↑
- Both Re-plumbing and re-installing fixtures in bathrooms — Fixes safety hazard and improves aesthetics ↑
- Both Re-installing cabinets in kitchen — Fixes safety hazard and improves aesthetics ↑
- Both Re-installing HVAC and mechanical systems — Fixes safety hazard and improves aesthetics ↑
ⓘ Cost ranges are severity-bucket heuristics (US national rule-of-thumb). Get contractor quotes + a written scope before underwriting a rehab budget.
Schools (NCES district)
- District
- Columbus City School District
- NCES district ID
- 3904380
- Math proficiency
- 15% ▼ -17.00%
- Reading proficiency
- 26% ▼ -12.00%
- Median HH income
- $38,483
- Composite
- 17.19/100
- National rank
- #9105
- State rank
- #626 of 656 in OH
Livability — Columbus
- Score
- 81/100
- State rank
- #97
- US rank
- #1491
Category grades
Schools grade is shown separately in the Schools card above.
Census & demographics
- Census place
- Columbus, OH
- County
- Franklin County · 1,351,780 people
- City population
- 612,189
- Metro
- Columbus, OH
- Population (ZIP)
- 21,996
- Household income
- $75,806
- Rent vs Own
- Severe rent burden
- 846.0
Population outlook (Franklin County) Hauer SSP2
- Today (2025)
- 1,456,139 people
- By 2030
- 1,556,890 · +6.9%
- By 2040
- 1,757,349 · +20.7%
- By 2050
- 1,950,539 · +34.0%
- By 2075
- 2,376,171 · +63.2%
- By 2100
- 2,636,796 · +81.1%
Race, ethnicity, and origin ACS 2023
- Neighborhood character
- Diverse neighborhood (Simpson 0.59)
- Race & ethnicity
- White 56% Black 31% Two or more races 9% Hispanic / Latino 4% Asian 1% Native American 1%
- Common ancestry
- Romanian 3% Slovak 2% Lithuanian 1%
- Foreign-born
- 4% · Canada
- Languages at home
- 96% English-only · Spanish 2% Other Indo-European 1%
Political lean MEDSL · Franklin
- 2024 margin
- Strong D (+28.4) · D 63.7% · R 35.3% · Other 1.0%
- 2008→2024 swing
- +7.7pp toward D · 2008: 20.7pp · 2024: 28.4pp
- All cycles
- 2024: D+28.4 2020: D+31.4 2016: D+25.9 2012: D+21.7 2008: D+20.7
Not yet ingested
- Civics
- —
Market trends
- HPI YoY
- ▼ -576.73%
- Current HPI
- 173.8569
- Rent YoY
- ▲ 3.51%
- Metro
- Columbus, OH
- State GDP YoY
- ▲ 1.98%
- F500 in state
- 48
Industry mix (Fortune 500 HQ in OH)
| Industry | F500 HQs | Revenue |
|---|---|---|
| Insurance | 3 | $145B |
|
||
| Industrial Machinery | 3 | $49B |
|
||
| Financial Services | 3 | $24B |
|
||
| Consumer Goods | 2 | $93B |
|
||
| Aerospace / Defense | 2 | $47B |
|
||
| Utilities | 2 | $33B |
|
||
Price history
-15.0% since first listed5 events — show timeline
- 2026-05-26 Listed $254,900 CBRMLS
- 2025-09-30 Price Changed $259,000 CBRMLS
- 2025-09-30 Listing Removed — CBRMLS
- 2025-09-18 Price Changed $269,000 CBRMLS
- 2025-08-01 Listed $300,000 CBRMLS
Cash-flow waterfall
monthlySold comps — $/sqft
last 12 mo · ≤1 miLoading sold comps…