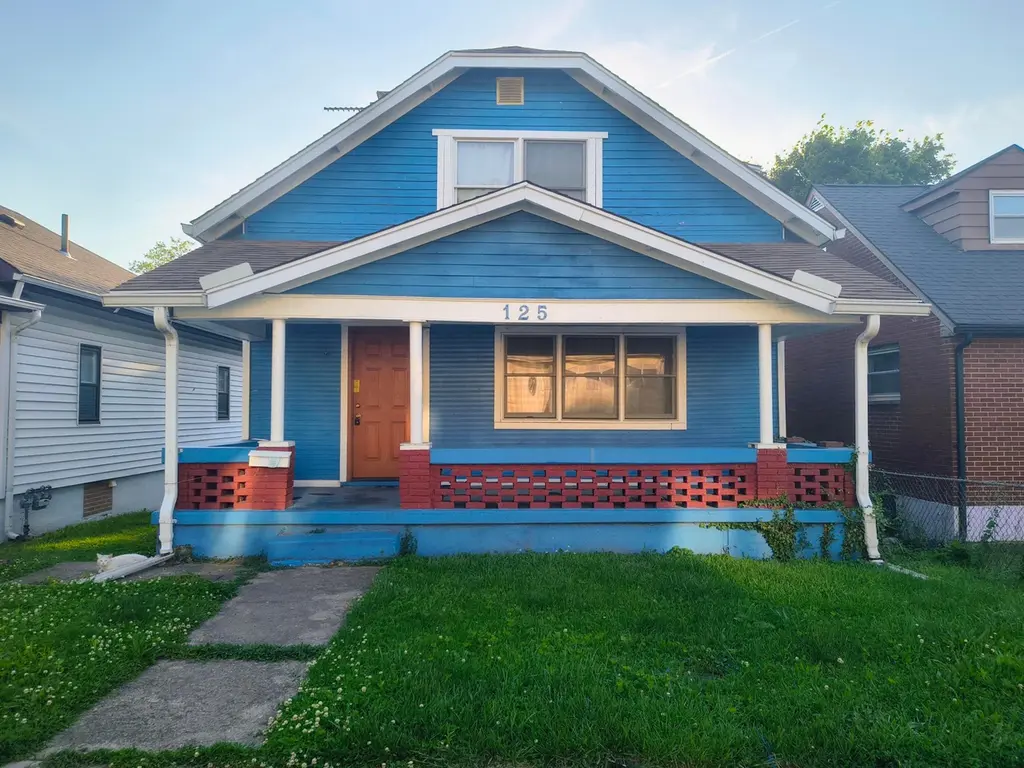
125 Grove Ave · Dayton, OH
Flood risk 1/10 · Minimal
- FEMA flood zone
- X (unshaded)
- Chance of flooding over 30 yrs
- 0.0%
- Est. flood insurance / yr
- $473 – $860
Fire risk 1/10 · Minimal
- Est. fire insurance / yr
- $713 – $1,323
Heat risk 4/10 · Minor
- Hot days now (above 102°F)
- 7 days/yr
- Hot days in 30 yrs
- 18 days/yr
Wind risk 2/10 · Minimal
- Chance of severe wind over 30 yrs
- —
Air-quality risk 3/10 · Minor
- Unhealthy air days now
- 2 days/yr
- Unhealthy air days in 30 yrs
- 4 days/yr
Risk factors via First Street. Map © Google.
Why this score? — see what drove the B grade
The composite is a weighted blend of 9 inputs, each scored 0–100. Each bar is that input's sub-score; the figure is the points it added to the 100-point composite (weight × sub-score).
- Cash flow +30.0/30.0
- ARV discount +15.0/15.0
- 1% rule +10.0/10.0
- DSCR +10.0/10.0
- Livability +3.2/5.0
- Rent growth +2.5/5.0
- Condition / age +2.5/5.0
- Schools +1.3/10.0
- Appreciation +0.0/10.0
$54,999
🖨 Deal sheet 📄 Offer letter ✓ Due diligence
Listing remarks
Here is the finalized, clean version of * * Option 1 * * for you to copy and paste. --- INVESTOR SPECIAL! High-Upside Rehab Opportunity in Old North Dayton Calling all flippers, landlords, and portfolio builders! 125 Grove Ave offers a blank canvas with massive equity potential. This 2-bedroom, 1-bathroom cottage spans over 900 sq. ft. and is ready for a complete top-to-bottom transformation. Nestled in a high-demand rental pocket of Greater Old North Dayton, this property sits just blocks from Dayton Children's Hospital and less than 2 miles from RiverScape MetroPark and downtown Dayton. Whether you are looking to execute a high-yield BRRRR strategy or a quick fix-and-flip, the l
Key facts
- Downtown dayton
- 3,920 sq ft lot
- Garage
Tags
Property features AI
Finance
- Financial info: Annual tax information available
Exterior
- Parking: Attached garage (1 car)
- Utilities: Public water; Public sewer
- Home design: Single-family residence; Two stories; No shared/common walls; Built in 1908
- Construction: Block foundation; Built in 1908
- Exterior features: Block foundation; Lot approximately 0.09 acres
Interior
- Bathrooms: 1 full bathroom; 1 half bathroom (1.5 total)
- Interior features: Full basement
Neighborhood map
What this means for you Summary
Snapshot
- This is a 2-bed/1.5-bath single-family listed at $55k.
Deal economics
- At list price, monthly cash flow is $435 ($5k/yr) — positive.
- The deal already cash-flows at list — no discount required.
- Meets the 1% rule at list price ($969 rent vs $55k).
- Recommended offer: $53k (3.0% below list) — sets the bar for market timing.
- Cap rate 15.8% vs local median 7.4% in Dayton — top-decile yield for the area; either an underpriced asset or a hidden risk that comps aren't pricing in. Stress-test before assuming the spread holds.
Location & tenants
- Location reads 65/100 on livability (#716 in OH) — a middle-class / working-renter tenant base. Strengths: cost of living A+, housing A+, health & safety A; Watch: schools C-, amenities C-, crime F.
- Dayton City (urban): math 12% / reading 21% proficiency, ranked #641 of 656 in OH (top 98%) — low school quality limits family demand, transient renter base, plan for 1-2y turnover; 74% free/reduced lunch — lower-income household profile, screen leases tightly.
- Market conditions: 66 active listings in the ZIP; 29 comparable units currently listed for rent nearby; rentals at typical pace (median 23d on market — plan ~3-4 weeks tenant-placement turnaround); lower-income renter base — watch delinquency; 907 units permitted in Montgomery County in 2024 (416 in 5+ unit buildings).
Forward outlook
- Local home prices are declining (-3.0%/yr); year-one equity from $380 of loan paydown is wiped out by about $2k of value loss. Plan a longer hold.
- Montgomery County population projected at -10% by 2050 — secular population decline; favor cash flow + early exit over multi-decade hold.
- At projected returns (-3.0% appreciation + 3.0% rent growth), your $15k cash investment doubles in ~4 years — after that, you're playing with house money.
Negotiation context
- It's been on market 33 days — a 3% lower offer ($53k) is reasonable based on typical stale-listing flexibility.
Risks & watch-outs
- Watch-outs: built in 1908 — expect roof / HVAC / electrical / plumbing capex.
Questions for the listing agent
- It's been on market 33 days. Have you received any prior offers? Is the seller open to a 3% concession, seller financing, or rate buy-down credit?
- Built in 1908 — when were the roof, HVAC, electrical panel, plumbing, and water heater last replaced?
- Is there a deadline driving the sale (1031 exchange, divorce, estate, relocation)? That informs how much negotiation room exists.
- Crime grade is F in this area — have there been break-ins, vandalism, or insurance claims at this property in the last 3 years? What carrier currently insures it and at what premium?
- What's the average days-on-market for RENTAL listings here right now (not sales)? A rising rental-DOM trend means longer vacancies and softer asking-rent achievability than the comps imply.
- What's the recent tenant-quality profile in this submarket — average credit score on applications, eviction rate, late-payment / NSF rate, and stable-employment percentage? A property-management company in the area should have these aggregated.
- How much new for-sale + rental construction is in the pipeline within 1–3 miles? Heavy new supply typically softens prices + rents 12–24 months out; constrained supply supports both.
Investment metrics
- 1% rule
- 1.76% ✓
- Cap rate
- 15.79%
- Cash-on-cash
- 33.91%
- DSCR
- 2.51
- GRM
- 4.7
CMA / ARV
- ARV (on-the-fly)
- $87,552
- Comps found
- 9
Show comp detail 9 sales within ~0.75 mi
| Address | Dist | Beds/Ba | Sqft | Sold | Price | $/sf | Match |
|---|---|---|---|---|---|---|---|
| 121 Grove Ave | 0.01mi | 2/1.0 | 896 (-2%) | 15mo | $100,000 | $112 | 83 |
| 637 Willow St | 0.47mi | 2/1.0 | 896 (-2%) | 2mo | $40,000 | $45 | 71 |
| 36 Baltimore St | 0.15mi | 3/1.0 (+1) | 962 (+6%) | 8mo | $140,000 | $146 | 70 |
| 1702 Leonhard St | 0.28mi | 2/1.0 | 886 (-3%) | 15mo | $85,000 | $96 | 68 |
| 11 Grove Ave | 0.09mi | 2/1.0 | 864 (-5%) | 24mo | $78,000 | $90 | 65 |
| 415 Deeds Ave | 0.21mi | 1/1.0 (-1) | 936 (+3%) | 21mo | $37,295 | $40 | 62 |
| 510 Maryland Ave | 0.13mi | 3/1.0 (+1) | 827 (-9%) | 20mo | $69,000 | $83 | 55 |
| 1626 Leo St | 0.41mi | 2/1.0 | 792 (-13%) | 22mo | $88,000 | $111 | 39 |
| 2022 Bickmore Ave | 0.74mi | 2/1.0 | 858 (-6%) | 23mo | $115,000 | $134 | 35 |
Match score weights: distance 35% · size 25% · config 20% · recency 20%. Top-matched comps best support the ARV.
Projected returns pro-forma
-3.0% appreciation · 3.0% rent growth · sell at horizon
- IRR
- 29.2%
- Equity multiple
- 2.22×
- Total profit
- $18,789
- Equity at exit
- $8,201
- IRR
- 36.6%
- Equity multiple
- 4.38×
- Total profit
- $51,987
- Equity at exit
- $4,755
Cash invested: $15,400 (down + closing). Projections, not guarantees.
Landlord ↔ Tenant lean methodology
- Overall (STATE)
- 73 Landlord-Friendly
- State Ohio
- 73 Landlord-Friendly · R+6
- County
- — inherits STATE
- City
- — inherits STATE
ZIP-level market 45404
- Home prices YoY
- -24.2%
- Active inventory
- 66
- Price-to-rent
- 4.7×
Monthly cashflow live
- Estimated rent
- $969 high interval (Pro) →
- Mortgage (P&I)
- −$288
- Tax from tax record
- −$19 /mo · $224/yr
- Insurance
- −$23
- HOA
- −$0
- Vacancy / Maint / Mgmt
- −$203
- Net cashflow
- $435
Break-even live
UW: 25.0% down · 7.5% · 30yr · 1.5% tax · 5.0% vac · 8.0% maint · 8.0% mgmt
Financing live
Cash to close
- Down payment
- $13,750
- Closing costs
- $1,650
- Reserves months
- —
- Total cash needed
- —
Loan-product check · same deal, 3 products live
Conventional
25% down · 7.5% · 30yr
- Down + closing
- —
- Monthly P&I
- —
- Monthly cashflow
- —
- DSCR
- —
- Eligible?
- —
Personal DTI + credit; lowest rate.
DSCR
20% down · 8.5% · 30yr
- Down + closing
- —
- Monthly P&I
- —
- Monthly cashflow
- —
- DSCR
- —
- Eligible?
- —
No personal income docs; deal must DSCR.
Hard money
10% down · 12.0% · 12mo
- Down + closing
- —
- Monthly P&I
- —
- Monthly cashflow
- —
- DSCR
- —
- Eligible?
- —
Short-term bridge; refi at stabilization.
Rent comps 29 comps
| Address | Beds | Baths | Sqft | Rent | $/sqft | DOM | Units | Dist |
|---|---|---|---|---|---|---|---|---|
| 528 Troy St Unit B Dayton, OH | 1.0 | 1.0 | 850 | $750 | $0.88 | 23d | 1 | 0.03mi |
| 502 Hart St Unit 504 Dayton, OH | 1.0 | 1.0 | 900 | $700 | $0.78 | 43d | 1 | 0.07mi |
| 163 Grove Ave Unit 163 Dayton, OH | 3.0 | 1.0 | 1000 | $950 | $0.95 | 43d | 1 | 0.09mi |
| 623 Troy St Unit A Dayton, OH | 1.0 | 1.0 | 550 | $695 | $1.26 | 43d | 1 | 0.13mi |
| 623 Troy St Unit D Dayton, OH | 1.0 | 1.0 | 550 | $725 | $1.32 | 2d | 1 | 0.13mi |
| 78 Notre Dame Ave Unit A Dayton, OH | 3.0 | 1.0 | 1015 | $1,025 | $1.01 | 43d | 1 | 0.16mi |
| 224 Deeds Ave Dayton, OH | 2.0 | 1.0 | 1124 | $950 | $0.85 | 23d | 1 | 0.20mi |
| 451 Hunter Ave Dayton, OH | 2.0 | 1.0 | 974 | $800 | $0.82 | 23d | 1 | 0.56mi |
| 809 Herman Ave Dayton, OH | 2.0 | 1.0 | 747 | $700 | $0.94 | 3d | 1 | 0.58mi |
| 2034 Leo St Dayton, OH | 2.0 | 1.0 | 888 | $1,100 | $1.24 | 21d | 1 | 0.61mi |
| 204 Sears St Dayton, OH | 3.0 | 1.0–2.5 | 1124 | $2,228 | $1.98 | 2d | 10 | 0.96mi |
| 112 Webster St Dayton, OH | 2.0 | 1.0–2.0 | 802 | $2,198 | $2.74 | 2d | 63 | 0.98mi |
| 29 N Garfield St Dayton, OH | 3.0 | 1.0 | 1092 | $1,000 | $0.92 | 23d | 1 | 1.00mi |
| 329 E 1st St Dayton, OH | 1.0 | 1.0 | 832 | $1,405 | $1.69 | 2d | 15 | 1.07mi |
| 307 E 1st St Dayton, OH | 1.0 | 1.0 | 483 | $1,270 | $2.63 | 2d | 9 | 1.09mi |
| 140 E Monument Ave Dayton, OH | 3.0 | 1.0–2.0 | 1048 | $1,952 | $1.86 | 2d | 11 | 1.19mi |
| 22 Emmet St Unit 10 Dayton, OH | 1.0 | 1.0 | 650 | $895 | $1.38 | 43d | 1 | 1.19mi |
| 2200 E 5th St Dayton, OH | 2.0 | 1.0 | 1000 | $825 | $0.82 | 23d | 1 | 1.22mi |
| 500 E 3rd St Dayton, OH | 1.0–2.0 | 1.0–2.0 | 935 | $1,660 | $1.78 | 3d | 16 | 1.23mi |
| 2351 E 5th St Unit 2349-U Dayton, OH | 1.0 | 1.0 | 900 | $750 | $0.83 | 43d | 1 | 1.28mi |
| 101 N Irwin St Dayton, OH | 2.0 | 1.0 | 900 | $1,100 | $1.22 | 3d | 1 | 1.31mi |
| 100 N Jefferson St Dayton, OH | 1.0–2.0 | 1.0–2.0 | 800 | $1,532 | $1.92 | 3d | 11 | 1.31mi |
| 35 Neal Ave Dayton, OH | 2.0 | 1.0 | 728 | $875 | $1.20 | 23d | 1 | 1.33mi |
| 425 Dayton Towers Dr Dayton, OH | 2.0 | 1.0–2.0 | 852 | $1,799 | $2.11 | 2d | 30 | 1.36mi |
| 35 S Saint Clair St Dayton, OH | 1.0–2.0 | 1.0–2.0 | 918 | $1,844 | $2.01 | 3d | 18 | 1.40mi |
| 120 S Monmouth St Dayton, OH | 2.0 | 1.0 | 1000 | $950 | $0.95 | 43d | 1 | 1.40mi |
| 44 5 Oaks Ave Unit 2 Dayton, OH | 2.0 | 1.0 | 700 | $800 | $1.14 | 43d | 1 | 1.40mi |
| 115 W Monument Ave Dayton, OH | 1.0–2.0 | 1.0–2.5 | 1053 | $2,199 | $2.09 | 2d | 20 | 1.44mi |
| 408 E 6th St Unit 10 Dayton, OH | 1.0 | 1.0 | 700 | $1,150 | $1.64 | 43d | 1 | 1.50mi |
Listing history 16 events
-
2026-06-18days on market $54,999 Active 33 DOM
-
2026-06-17days on market $54,999 Active 32 DOM
-
2026-06-16days on market $54,999 Active 31 DOM
-
2026-06-15days on market $54,999 Active 30 DOM
-
2026-06-14days on market $54,999 Active 28 DOM
-
2026-06-13days on market $54,999 Active 27 DOM
-
2026-06-10days on market $54,999 Active 25 DOM
-
2026-06-09days on market $54,999 Active 24 DOM
-
2026-06-08days on market $54,999 Active 23 DOM
-
2026-06-07days on market $54,999 Active 22 DOM
-
2026-06-05days on market $54,999 Active 19 DOM
-
2026-06-03days on market $54,999 Active 18 DOM
-
2026-06-02pricedays on market $54,999 Active 17 DOM
-
2026-06-01days on market $59,999 Active 16 DOM
-
2026-05-31days on market $59,999 Active 15 DOM
-
2026-05-16$64,900 Active
ⓘ Source: listings_history table (triggers on properties + properties_extension) + one-shot
backfill from property_details.listing_events for pre-trigger history.
Tax reassessment forecast OH · Partial reset (capped growth)
- Current annual tax
- $224 · $19/mo
- Projected year-2 tax
- $541 · $45/mo
- Expected delta
- +$317/yr (+$26/mo · 141.4%)
ⓘ Screening estimate from a state-policy table — verify with the county assessor before closing.
Climate risk First Street
- Flood 1/10 Low FEMA zone X (unshaded) · 0% chance over 30 yrs
- Wildfire 1/10 Low
- Heat 4/10 Moderate 7 d/yr ≥102°F today · 18 d/yr by 30 yrs out
- Wind 2/10 Low
- Air quality 3/10 Moderate 2 unhealthy d/yr today · 4 by 30 yrs out
Nearby sold comps map
Loading sold comps map…
Walkable amenities ~0.75 mi
Loading nearby amenities…
Taxation est. · year 1
- Rental income
- $11,623
- − Mortgage interest
- −$3,081
- − Property taxes
- −$224
- − Insurance
- −$275
- − Repairs & maintenance
- −$930
- − Management
- −$930
- − Depreciation
- −$1,600
- Taxable income
- $4,584
- Est. tax owed @ 24.0%
- −$1,100
- After-tax cash flow
- $4,122/yr
For passive investors: Depreciation is non-cash, so a rental often shows a tax loss while cash-flowing — sheltering income. Rental losses are passive: they offset passive income freely, and up to $25,000/yr can offset ordinary (W-2) income if you actively participate and your MAGI is under $100k (phasing out to $0 by $150k); unused losses carry forward. On sale, claimed depreciation is recaptured at up to 25%, and gains may owe capital-gains tax (a 1031 exchange can defer both). Figures are a year-1 estimate at your 24.0% rate — not tax advice; consult a CPA.
Schools (NCES district)
- District
- Dayton City
- NCES district ID
- 3904384
- Math proficiency
- 12% ▼ -12.00%
- Reading proficiency
- 21% ▼ -11.00%
- Median HH income
- $28,688
- Composite
- 12.94/100
- National rank
- #9579
- State rank
- #641 of 656 in OH
Livability — Dayton
- Score
- 65/100
- State rank
- #716
- US rank
- #12895
Category grades
Schools grade is shown separately in the Schools card above.
Census & demographics
- Census place
- Dayton, OH
- County
- Montgomery County · 459,541 people
- City population
- 164,387
- Metro
- Dayton-Kettering, OH
- Population (ZIP)
- 9,826
- Household income
- $38,874
- Rent vs Own
- Severe rent burden
- 702.0
Population outlook (Montgomery County) Hauer SSP2
- Today (2025)
- 523,241 people
- By 2030
- 514,948 · -1.6%
- By 2040
- 493,378 · -5.7%
- By 2050
- 469,639 · -10.2%
- By 2075
- 418,360 · -20.0%
- By 2100
- 353,315 · -32.5%
Race, ethnicity, and origin ACS 2023
- Neighborhood character
- Predominantly White (70%)
- Race & ethnicity
- White 70% Black 19% Two or more races 7% Hispanic / Latino 4% Asian 1%
- Common ancestry
- Iranian 3% Slovak 2% Serbian 1%
- Foreign-born
- 9% · Canada
- Languages at home
- 88% English-only · Spanish 4% Arabic 4% Other Asian/Pacific 3%
Political lean MEDSL · Montgomery
- 2024 margin
- Toss-up / Even · D 49.8% · R 49.3%
- 2008→2024 swing
- -5.8pp toward R · 2008: 6.2pp · 2024: 0.5pp
- All cycles
- 2024: D+0.5 2020: D+2.2 2016: R+1.2 2012: D+3.1 2008: D+6.2
Not yet ingested
- Civics
- —
Market trends
- HPI YoY
- ▼ -67.48%
- Current HPI
- 210.9571
- Rent YoY
- —
- Metro
- Dayton-Kettering, OH
- State GDP YoY
- ▲ 1.98%
- F500 in state
- 48
Industry mix (Fortune 500 HQ in OH)
| Industry | F500 HQs | Revenue |
|---|---|---|
| Insurance | 3 | $145B |
|
||
| Industrial Machinery | 3 | $49B |
|
||
| Financial Services | 3 | $24B |
|
||
| Consumer Goods | 2 | $93B |
|
||
| Aerospace / Defense | 2 | $47B |
|
||
| Utilities | 2 | $33B |
|
||
Price history
1 event — show timeline
- 2026-05-16 Listed $64,900 CBRMLS
Property tax history
-2.1%/yrLatest (2025): $224 · -8.2% YoY. Source: county tax records.
Cash-flow waterfall
monthlySold comps — $/sqft
last 12 mo · ≤1 miLoading sold comps…