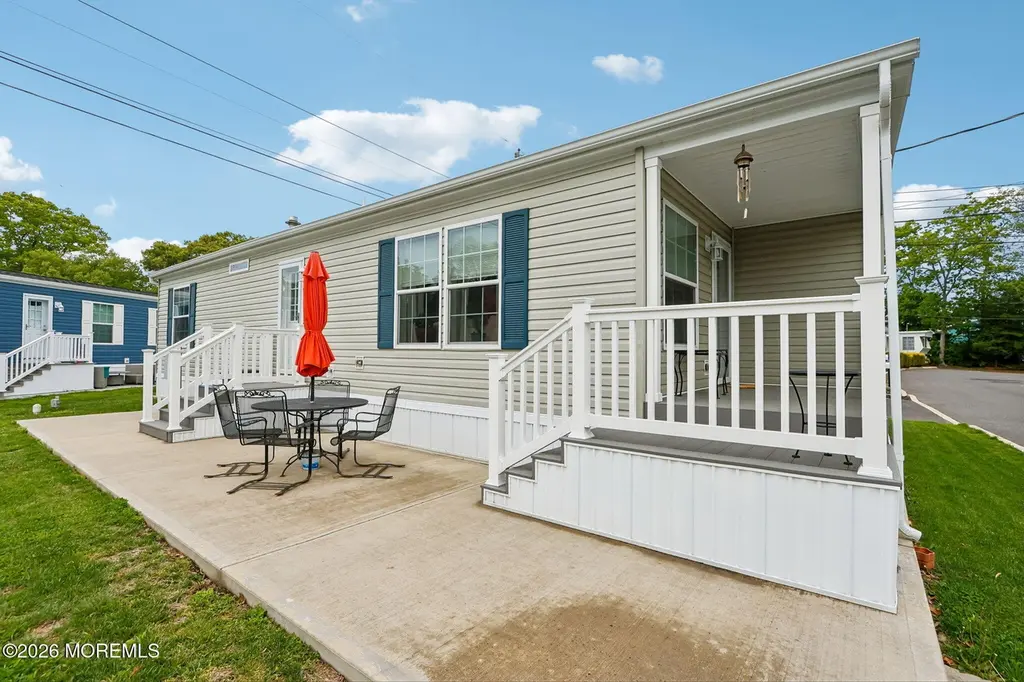
1919 Atlantic Ave #12 · Allenwood, NJ
Flood risk No data
- FEMA flood zone
- —
- Chance of flooding over 30 yrs
- —
- Est. flood insurance / yr
- —
Fire risk No data
- Est. fire insurance / yr
- —
Heat risk No data
- Hot days now (above threshold)
- —
- Hot days in 30 yrs
- —
Wind risk No data
- Chance of severe wind over 30 yrs
- —
Air-quality risk No data
- Unhealthy air days now
- —
- Unhealthy air days in 30 yrs
- —
Risk factors via First Street. Map © Google.
Why this score? — see what drove the B+ grade
The composite is a weighted blend of 9 inputs, each scored 0–100. Each bar is that input's sub-score; the figure is the points it added to the 100-point composite (weight × sub-score).
- Cash flow +30.0/30.0
- ARV discount +15.0/15.0
- 1% rule +10.0/10.0
- DSCR +10.0/10.0
- Schools +4.4/10.0
- Condition / age +4.0/5.0
- Livability +3.5/5.0
- Rent growth +2.5/5.0
- Appreciation +0.0/10.0
$259,000
🖨 Deal sheet 📄 Offer letter ✓ Due diligence
Listing remarks MLS
Welcome to this gorgeous manufactured home, built in 2022, located in a 55+ community, Shore Acres. Step inside, and you'll be wowed. Featuring 2 spacious bedrooms and 2 full bathrooms, this home offers modern comfort and style. Enjoy plenty of outdoor space for relaxation and entertaining. This is an extra wide lot that offers a 2 car driveway. Shore Acres has a great location and this homesite backs up the recently repaved Manasquan Bike Path. Experience the best of low-maintenance h ome in this sought-after community—schedule your showing today!
Key facts
- Private patio
- Storage shed
- Modern kitchen
Tags
Property features AI
Finance
- HOA & community: Association: Shore Acres Mobile Home Park; Association fee approximately $985.75 per month
Exterior
- Parking: No garage
- Utilities: Public sewer
- Home design: Mobile home; Living area approximately 1248
- Exterior features: Shingle roof
Interior
- Kitchen: Refrigerator included
- Bedrooms: 2 bedrooms
- Bathrooms: 2 full bathrooms
- Heating & cooling: Forced air heating; Central air conditioning
- Interior features: Washer, Dryer, Refrigerator included; No fireplaces; No basement
- Laundry & utility: Washer and Dryer included
Neighborhood map
What this means for you Summary
Snapshot
- This is a 2-bed/2.0-bath single-family listed at $259k. Condition is rated good.
Deal economics
- At list price, monthly cash flow is $1k ($13k/yr) — positive.
- The deal already cash-flows at list — no discount required.
- Meets the 1% rule at list price ($5k rent vs $259k).
- Recommended offer: $251k (3.0% below list) — sets the bar for market timing.
- Cap rate 11.3% vs local median 2.4% in Allenwood — top-decile yield for the area; either an underpriced asset or a hidden risk that comps aren't pricing in. Stress-test before assuming the spread holds.
Location & tenants
- Location reads 69/100 on livability (#286 in NJ) — a middle-class / working-renter tenant base. Strengths: schools A+, crime A+, employment A+; Watch: amenities F, commute F, cost of living F.
- Wall Township Public School District (suburban): math 36% / reading 58% proficiency, ranked #145 of 472 in NJ (top 31%) — families likely to look elsewhere, expect single-tenant / working-renter base with shorter leases; only 9% free/reduced lunch — higher-income household profile.
- Market conditions: 67 active listings in the ZIP; 1 comparable units currently listed for rent nearby; high-income renter base; 2,840 units permitted in Monmouth County in 2024 (484 in 5+ unit buildings).
- This rent runs 34% of the median local income ($174k/yr) — at the standard rent-burdened threshold; future hikes will face affordability resistance.
Forward outlook
- Local home prices are declining (-3.0%/yr); year-one equity from $2k of loan paydown is wiped out by about $8k of value loss. Plan a longer hold.
- Monmouth County population projected at -11% by 2050 — secular population decline; favor cash flow + early exit over multi-decade hold.
- At projected returns (-3.0% appreciation + 3.0% rent growth), your $73k cash investment doubles in ~7 years — after that, you're playing with house money.
Negotiation context
- It's been on market 38 days — a 3% lower offer ($251k) is reasonable based on typical stale-listing flexibility.
- 2 sale attempts since 2y ago with the ask held roughly flat each time — persistent listings suggest the price (not the market) is what's stuck; bring a comps-based counter.
Risks & watch-outs
- Watch-outs: HOA is 20% of rent.
Questions for the listing agent
- It's been on market 38 days. Have you received any prior offers? Is the seller open to a 3% concession, seller financing, or rate buy-down credit?
- What does the HOA fee cover, when was the last increase, and are there any pending special assessments or reserve-fund shortfalls?
- Is there a deadline driving the sale (1031 exchange, divorce, estate, relocation)? That informs how much negotiation room exists.
- Schools are A-rated — typically a magnet for longer-tenancy family renters. What's the average tenant stay here, and is there a school-zone premium baked into asking?
- What's the average days-on-market for RENTAL listings here right now (not sales)? A rising rental-DOM trend means longer vacancies and softer asking-rent achievability than the comps imply.
- What's the recent tenant-quality profile in this submarket — average credit score on applications, eviction rate, late-payment / NSF rate, and stable-employment percentage? A property-management company in the area should have these aggregated.
- How much new for-sale + rental construction is in the pipeline within 1–3 miles? Heavy new supply typically softens prices + rents 12–24 months out; constrained supply supports both.
Investment metrics
- 1% rule
- 1.88% ✓
- Cap rate
- 11.28%
- Cash-on-cash
- 17.80%
- DSCR
- 1.79
- GRM
- 4.4
CMA / ARV
- ARV (median comp)
- $468,928
- List price
- $259,000
- Delta
- -44.77%
- Verdict
- UNDERPRICED
- Comps
- 8 within 1.0 mi
Show comp detail 1 sale within ~0.75 mi
| Address | Dist | Beds/Ba | Sqft | Sold | Price | $/sf | Match |
|---|---|---|---|---|---|---|---|
| 1919 Atlantic Ave #26 | 0.09mi | 2/1.0 | 1,084 (-13%) | 5mo | $160,000 | $148 | 65 |
Match score weights: distance 35% · size 25% · config 20% · recency 20%. Top-matched comps best support the ARV.
Projected returns pro-forma
-3.0% appreciation · 3.0% rent growth · sell at horizon
- IRR
- 9.5%
- Equity multiple
- 1.38×
- Total profit
- $27,212
- Equity at exit
- $38,618
- IRR
- 18.8%
- Equity multiple
- 2.58×
- Total profit
- $114,662
- Equity at exit
- $22,394
Cash invested: $72,520 (down + closing). Projections, not guarantees.
Landlord ↔ Tenant lean methodology
- Overall (STATE)
- 21 Tenant-Leaning
- State New Jersey
- 21 Tenant-Leaning · D+6
- County
- — inherits STATE
- City
- — inherits STATE
ZIP-level market 08736
- Active inventory
- 67
- Price-to-rent
- 4.4×
Monthly cashflow live
- Estimated rent
- $4,874 medium interval (Pro) →
- Mortgage (P&I)
- −$1,358
- Tax est. 1.5%
- −$324 /mo · $3,885/yr
- Insurance
- −$108
- HOA
- −$985
- Vacancy / Maint / Mgmt
- −$1,024
- Net cashflow
- $1,076
Break-even live
UW: 25.0% down · 7.5% · 30yr · 1.5% tax · 5.0% vac · 8.0% maint · 8.0% mgmt
Financing live
Cash to close
- Down payment
- $64,750
- Closing costs
- $7,770
- Reserves months
- —
- Total cash needed
- —
Loan-product check · same deal, 3 products live
Conventional
25% down · 7.5% · 30yr
- Down + closing
- —
- Monthly P&I
- —
- Monthly cashflow
- —
- DSCR
- —
- Eligible?
- —
Personal DTI + credit; lowest rate.
DSCR
20% down · 8.5% · 30yr
- Down + closing
- —
- Monthly P&I
- —
- Monthly cashflow
- —
- DSCR
- —
- Eligible?
- —
No personal income docs; deal must DSCR.
Hard money
10% down · 12.0% · 12mo
- Down + closing
- —
- Monthly P&I
- —
- Monthly cashflow
- —
- DSCR
- —
- Eligible?
- —
Short-term bridge; refi at stabilization.
Rent comps 1 comps
| Address | Beds | Baths | Sqft | Rent | $/sqft | DOM | Units | Dist |
|---|---|---|---|---|---|---|---|---|
| 59 Lakewood Rd Manasquan, NJ | 2.0 | 1.0 | 768 | $23,500 | $30.60 | 18d | 1 | 1.46mi |
HOA detail
- Monthly dues
- $985 · $11,820/yr
Listing history 17 events
-
2026-06-18days on market $259,000 Active 38 DOM
-
2026-06-17days on market $259,000 Active 37 DOM
-
2026-06-16days on market $259,000 Active 36 DOM
-
2026-06-15days on market $259,000 Active 35 DOM
-
2026-06-13days on market $259,000 Active 33 DOM
-
2026-06-09days on market $259,000 Active 29 DOM
-
2026-06-08days on market $259,000 Active 28 DOM
-
2026-06-07days on market $259,000 Active 27 DOM
-
2026-06-04days on market $259,000 Active 24 DOM
-
2026-06-03days on market $259,000 Active 23 DOM
-
2026-06-02days on market $259,000 Active 22 DOM
-
2026-06-01days on market $259,000 Active 21 DOM
-
2026-05-31days on market $259,000 Active 20 DOM
-
2026-05-11$259,000 Active 759-char remark
-
2024-12-09soldstatus $230,000 Closed 560-char remark
Show marketing remark (560 chars)
Welcome to this gorgeous manufactured home, built in 2022, located in a 55+ community, Shore Acres. Step inside, and you'll be wowed. Featuring 2 spacious bedrooms and 2 full bathrooms, this home offers modern comfort and style. Enjoy plenty of outdoor space for relaxation and entertaining. This is an extra wide lot that offers a 2 car driveway. Shore Acres has a great location and this homesite backs up the recently repaved Manasquan Bike Path. Experience the best of low-maintenance h ome in this sought-after community—schedule your showing today!
-
2024-11-01status Pending 560-char remark
Show marketing remark (560 chars)
Welcome to this gorgeous manufactured home, built in 2022, located in a 55+ community, Shore Acres. Step inside, and you'll be wowed. Featuring 2 spacious bedrooms and 2 full bathrooms, this home offers modern comfort and style. Enjoy plenty of outdoor space for relaxation and entertaining. This is an extra wide lot that offers a 2 car driveway. Shore Acres has a great location and this homesite backs up the recently repaved Manasquan Bike Path. Experience the best of low-maintenance h ome in this sought-after community—schedule your showing today!
-
2024-08-10$239,000 Active 560-char remark
Show marketing remark (560 chars)
Welcome to this gorgeous manufactured home, built in 2022, located in a 55+ community, Shore Acres. Step inside, and you'll be wowed. Featuring 2 spacious bedrooms and 2 full bathrooms, this home offers modern comfort and style. Enjoy plenty of outdoor space for relaxation and entertaining. This is an extra wide lot that offers a 2 car driveway. Shore Acres has a great location and this homesite backs up the recently repaved Manasquan Bike Path. Experience the best of low-maintenance h ome in this sought-after community—schedule your showing today!
ⓘ Source: listings_history table (triggers on properties + properties_extension) + one-shot
backfill from property_details.listing_events for pre-trigger history.
Nearby sold comps map
Loading sold comps map…
Walkable amenities ~0.75 mi
Loading nearby amenities…
Taxation est. · year 1
- Rental income
- $58,488
- − Mortgage interest
- −$14,508
- − Property taxes
- −$3,885
- − Insurance
- −$1,295
- − Repairs & maintenance
- −$4,679
- − Management
- −$4,679
- − HOA
- −$11,820
- − Depreciation
- −$7,535
- Taxable income
- $10,087
- Est. tax owed @ 24.0%
- −$2,421
- After-tax cash flow
- $10,486/yr
For passive investors: Depreciation is non-cash, so a rental often shows a tax loss while cash-flowing — sheltering income. Rental losses are passive: they offset passive income freely, and up to $25,000/yr can offset ordinary (W-2) income if you actively participate and your MAGI is under $100k (phasing out to $0 by $150k); unused losses carry forward. On sale, claimed depreciation is recaptured at up to 25%, and gains may owe capital-gains tax (a 1031 exchange can defer both). Figures are a year-1 estimate at your 24.0% rate — not tax advice; consult a CPA.
Condition & rehab AI · 12 photos
This well-maintained manufactured home in Shore Acres offers a good condition with modern finishes and a peaceful setting.
Value-add opportunities
- Resale Paint exterior siding — Enhances curb appeal and value
- Rental Replace outdoor furniture — Improves rental readiness and appeal
Renovation cost estimate screening
Value-add ROI direction
- Resale Paint exterior siding — Enhances curb appeal and value ↑
- Rental Replace outdoor furniture — Improves rental readiness and appeal ↑
ⓘ Cost ranges are severity-bucket heuristics (US national rule-of-thumb). Get contractor quotes + a written scope before underwriting a rehab budget.
Schools (NCES district)
- District
- Wall Township Public School District
- NCES district ID
- 3416890
- Math proficiency
- 36% ▼ -25.00%
- Reading proficiency
- 58% ▼ -10.00%
- Median HH income
- $92,842
- Composite
- 44.31/100
- National rank
- #2831
- State rank
- #145 of 472 in NJ
Livability — Allenwood
- Score
- 69/100
- State rank
- #286
- US rank
- #8465
Category grades
Schools grade is shown separately in the Schools card above.
Census & demographics
- County
- Monmouth County · 505,557 people
- Metro
- New York-Newark-Jersey City, NY-NJ-PA
- Population (ZIP)
- 13,223
- Household income
- $174,097
- Rent vs Own
- Severe rent burden
- 65.0
Population outlook (Monmouth County) Hauer SSP2
- Today (2025)
- 620,308 people
- By 2030
- 612,309 · -1.3%
- By 2040
- 587,297 · -5.3%
- By 2050
- 551,342 · -11.1%
- By 2075
- 472,934 · -23.8%
- By 2100
- 381,534 · -38.5%
Race, ethnicity, and origin ACS 2023
- Neighborhood character
- Predominantly White (90%)
- Race & ethnicity
- White 90% Hispanic / Latino 6% Two or more races 5%
- Hispanic origin (detail)
- Mexican 2%
- Common ancestry
- Romanian 9% Slovak 3% Italian 2%
- Foreign-born
- 4% · Canada, China
- Languages at home
- 96% English-only · Spanish 2% Other Indo-European 1%
Political lean MEDSL · Monmouth
- 2024 margin
- R (+11.4) · D 43.4% · R 54.8% · Other 1.8%
- 2008→2024 swing
- -7.7pp toward R · 2008: -3.7pp · 2024: -11.4pp
- All cycles
- 2024: R+11.4 2020: R+2.8 2016: R+9.5 2012: R+5.5 2008: R+3.7
Not yet ingested
- Civics
- —
Market trends
- HPI YoY
- ▼ -307.96%
- Current HPI
- 371.0208
- Rent YoY
- —
- Metro
- New York-Newark-Jersey City, NY-NJ-PA
- State GDP YoY
- ▲ 2.05%
- F500 in state
- 34
Industry mix (Fortune 500 HQ in NJ)
| Industry | F500 HQs | Revenue |
|---|---|---|
| Consumer Goods | 3 | $31B |
|
||
| Pharmaceuticals | 2 | $153B |
|
||
| Technology | 2 | $21B |
|
||
| Insurance | 2 | $20B |
|
||
| Healthcare | 2 | $19B |
|
||
| Financial Services | 1 | $70B |
|
||
Price history
+8.4% since first listed4 events — show timeline
- 2026-05-11 Listed $259,000 MOMLS
- 2024-12-09 Sold (MLS) $230,000 MOMLS
- 2024-11-01 Pending — MOMLS
- 2024-08-10 Listed $239,000 MOMLS
Cash-flow waterfall
monthlySold comps — $/sqft
last 12 mo · ≤1 miLoading sold comps…