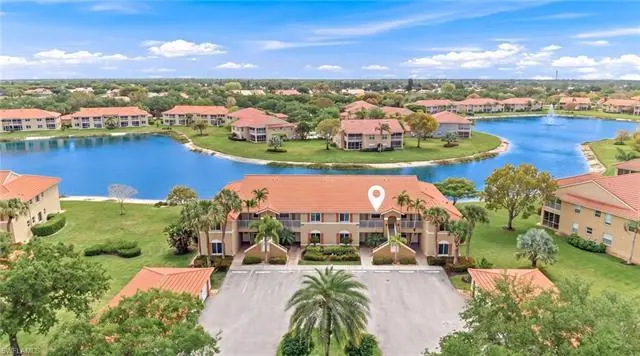
6720 Huntington Lakes Cir #203 · Bonita Springs, FL
Flood risk 1/10 · Minimal
- FEMA flood zone
- X (unshaded)
- Chance of flooding over 30 yrs
- 0.0%
- Est. flood insurance / yr
- $507 – $1,088
Fire risk 1/10 · Minimal
- Est. fire insurance / yr
- $947 – $1,759
Heat risk 10/10 · Severe
- Hot days now (above 108°F)
- 7 days/yr
- Hot days in 30 yrs
- 30 days/yr
Wind risk 10/10 · Severe
- Chance of severe wind over 30 yrs
- 99.0%
Air-quality risk 2/10 · Minimal
- Unhealthy air days now
- 2 days/yr
- Unhealthy air days in 30 yrs
- 2 days/yr
Risk factors via First Street. Map © Google.
Why this score? — see what drove the C- grade
The composite is a weighted blend of 9 inputs, each scored 0–100. Each bar is that input's sub-score; the figure is the points it added to the 100-point composite (weight × sub-score).
- Cash flow +20.0/30.0
- ARV discount +7.5/15.0
- 1% rule +7.0/10.0
- DSCR +6.3/10.0
- Schools +5.0/10.0
- Livability +3.5/5.0
- Condition / age +2.5/5.0
- Rent growth +1.9/5.0
- Appreciation +0.0/10.0
$294,900
🖨 Deal sheet 📄 Offer letter ✓ Due diligence
Listing remarks
PRICE IMPROVEMENT-RARE GARAGE UNIT WITH BEAUTIFUL LAKE VIEWS! Spectacular lake and fountain views set the stage for this home in one of North Naples’ most sought-after communities. Ideally located in a premier North Naples location, this home features 2 bedrooms, 2 baths, and a 1-car detached GARAGE, along with IMPACT WINDOWS AND SLIDERS for added peace of mind. Inside, the home is finished in soft, neutral tones with timeless tile flooring throughout. The kitchen offers a charming breakfast nook/computer area, perfect for casual dining or everyday convenience. The spacious primary suite captures the stunning lake views and features a large walk-in closet and en-suite bath with dual s
Key facts
- $558 HOA
- Garage
- Community pool
Property features AI
Finance
- Other: Community type: gated with tennis
- Financial info: Taxes listed (see listing) — county only
- HOA & community: Mandatory HOA; Master HOA fee $834 quarterly; Condo fee $840 quarterly; Total annual recurring fees $6,696; Total one-time fees $150; Professional management; Maintenance covers cable, internet/WiFi, irrigation water, lawn/land maintenance, legal/accounting, manager, exterior pest control, recreation facilities, reserves, security, street lights, water; Community amenities include clubhouse, community pool and spa/hot tub, exercise room, tennis and bocce courts, bike and jog path, BBQ/picnic, billiards, business center, community room, library, internet access, underground utilities
Exterior
- Parking: 1 assigned deeded parking space; Detached 1-car garage
- Security: Gated community; Entry card and keypad access; Manual shutters; impact resistant doors and windows
- Utilities: Water assessment paid; Sewer assessment paid; Electric service: central electric
- Home design: Residential low-rise (1-3 stories); Concrete block construction; Stucco exterior; Tile roof; Rear exposure East; Built in 2000; Located in Huntington Lakes
- Construction: Concrete block construction; Stucco finish; Tile roof; Impact resistant windows
- Exterior features: Lakefront with water feature and lake view; Water display; Assessment-paid irrigation (reclaimed)
Interior
- Kitchen: Cooktop - Electric; Dishwasher; Garbage disposal; Refrigerator/Freezer; Pantry
- Bedrooms: 2 bedrooms
- Flooring: Carpet; Tile
- Bathrooms: 2 full bathrooms; Master bathroom with dual sinks and shower (no tub)
- Heating & cooling: Central electric heat; Central electric cooling; Cable available
- Interior features: Cable prewire; Cathedral ceiling; High speed internet available; Pantry; Dining in living area and eat-in kitchen; Screened lanai/porch; Turnkey furnished; Split bedroom floor plan
- Laundry & utility: Washer and dryer in residence; Auto garage door opener
Neighborhood map
What this means for you Summary
Snapshot
- This is a 2-bed/2.0-bath condo listed at $295k.
Deal economics
- At list price, monthly cash flow is $359 ($4k/yr) — positive.
- The deal already cash-flows at list — no discount required.
- Meets the 1% rule at list price ($4k rent vs $295k).
- Recommended offer: $277k (6.0% below list) — sets the bar for market timing.
- Cap rate 7.8% vs local median 1.7% in Bonita Springs — top-decile yield for the area; either an underpriced asset or a hidden risk that comps aren't pricing in. Stress-test before assuming the spread holds.
Location & tenants
- Location reads 70/100 on livability (#428 in FL) — a middle-class / working-renter tenant base. Strengths: crime A+, housing A+, employment A; Watch: cost of living C-, health & safety D, amenities F.
- Collier (suburban): math 60% / reading 56% proficiency, ranked #16 of 73 in FL (top 22%) — acceptable for families but not a draw, mixed tenant base, ~2y average lease.
- Zoned schools: Naples Park Elementary School (math 67% / reading 57%, grade B, #608 of 2,144 statewide, top 29%, 395 students, 48% FRL).
- Market conditions: Rents soft (-2.5%/yr); 586 active listings in the ZIP; 40 comparable units currently listed for rent nearby; rentals at typical pace (median 24d on market — plan ~3-4 weeks tenant-placement turnaround); high-income renter base; 3,520 units permitted in Collier County in 2024 (959 in 5+ unit buildings).
- This rent runs 37% of the median local income ($113k/yr) — at the standard rent-burdened threshold; future hikes will face affordability resistance.
Forward outlook
- Local home prices are declining (-3.0%/yr); year-one equity from $2k of loan paydown is wiped out by about $9k of value loss. Plan a longer hold.
- Collier County population projected at +30% by 2050 — long-run rental-demand tailwind backs the buy-and-hold thesis.
Negotiation context
- It's been on market 69 days — a 6% lower offer ($277k) is reasonable based on typical stale-listing flexibility.
- 2 sale attempts since 2y ago with the ask held roughly flat each time — persistent listings suggest the price (not the market) is what's stuck; bring a comps-based counter.
Risks & watch-outs
- Climate carrying-cost: severe wind risk, 99% chance of damaging wind over 30y; extreme-heat days projected 7→30/yr by 2055 (HVAC capex compounding) — expect insurance premiums to compound above CPI over the hold.
Questions for the listing agent
- It's been on market 69 days. Have you received any prior offers? Is the seller open to a 6% concession, seller financing, or rate buy-down credit?
- What does the HOA fee cover, when was the last increase, and are there any pending special assessments or reserve-fund shortfalls?
- Any open or pending special assessments — roof, HVAC, plumbing, elevator, façade? What's the per-unit balance and payoff schedule, and is the seller paying it off at close or rolling it to the buyer?
- Why hasn't it sold? Are there any deal-killer items the seller is aware of (foundation, flood, title, zoning, code violations)?
- Is there a deadline driving the sale (1031 exchange, divorce, estate, relocation)? That informs how much negotiation room exists.
- What's the average days-on-market for RENTAL listings here right now (not sales)? A rising rental-DOM trend means longer vacancies and softer asking-rent achievability than the comps imply.
- What's the recent tenant-quality profile in this submarket — average credit score on applications, eviction rate, late-payment / NSF rate, and stable-employment percentage? A property-management company in the area should have these aggregated.
- How much new apartment / multifamily construction is in the pipeline within 1–3 miles? Heavy new supply (>2% of stock underway) typically softens rents 12–24 months out; light construction supports rent growth.
Investment metrics
- 1% rule
- 1.20% ✓
- Cap rate
- 7.75%
- Cash-on-cash
- 5.22%
- DSCR
- 1.23
- GRM
- 7.0
CMA / ARV
No comps found within radius.
Projected returns pro-forma
-3.0% appreciation · 0.0% rent growth · sell at horizon
- IRR
- -12.1%
- Equity multiple
- 0.58×
- Total profit
- $-34,983
- Equity at exit
- $43,971
- IRR
- -9.3%
- Equity multiple
- 0.52×
- Total profit
- $-39,851
- Equity at exit
- $25,498
Cash invested: $82,572 (down + closing). Projections, not guarantees.
Landlord ↔ Tenant lean methodology
- Overall (STATE)
- 87 Strongly Landlord-Friendly
- State Florida
- 87 Strongly Landlord-Friendly · R+3
- County
- — inherits STATE
- City
- — inherits STATE
ZIP-level market 34119
- Rents YoY
- -2.5%
- Active inventory
- 586
- Price-to-rent
- 7.0×
Monthly cashflow live
- Estimated rent
- $3,535 high interval (Pro) →
- Mortgage (P&I)
- −$1,546
- Tax from tax record
- −$206 /mo · $2,477/yr
- Insurance
- −$123
- HOA
- −$558
- Vacancy / Maint / Mgmt
- −$742
- Net cashflow
- $359
Break-even live
UW: 25.0% down · 7.5% · 30yr · 1.5% tax · 5.0% vac · 8.0% maint · 8.0% mgmt
Financing live
Cash to close
- Down payment
- $73,725
- Closing costs
- $8,847
- Reserves months
- —
- Total cash needed
- —
Loan-product check · same deal, 3 products live
Conventional
25% down · 7.5% · 30yr
- Down + closing
- —
- Monthly P&I
- —
- Monthly cashflow
- —
- DSCR
- —
- Eligible?
- —
Personal DTI + credit; lowest rate.
DSCR
20% down · 8.5% · 30yr
- Down + closing
- —
- Monthly P&I
- —
- Monthly cashflow
- —
- DSCR
- —
- Eligible?
- —
No personal income docs; deal must DSCR.
Hard money
10% down · 12.0% · 12mo
- Down + closing
- —
- Monthly P&I
- —
- Monthly cashflow
- —
- DSCR
- —
- Eligible?
- —
Short-term bridge; refi at stabilization.
Rent comps 40 comps
| Address | Beds | Baths | Sqft | Rent | $/sqft | DOM | Units | Dist |
|---|---|---|---|---|---|---|---|---|
| 6670 Huntington Lakes Cir #103 Naples, FL | 2.0 | 2.0 | 1107 | $4,250 | $3.84 | 23d | 1 | 0.08mi |
| 6670 Huntington Lakes Cir #103 Naples, FL | 2.0 | 2.0 | 1107 | $4,000 | $3.61 | 14d | 1 | 0.08mi |
| 6750 Huntington Lakes Cir #103 Naples, FL | 2.0 | 2.0 | 1185 | $2,300 | $1.94 | 21d | 1 | 0.09mi |
| 6920 Huntington Lakes Cir #103 Naples, FL | 2.0 | 2.0 | 1107 | $2,700 | $2.44 | 23d | 1 | 0.13mi |
| 6880 Huntington Lakes Cir #203 Naples, FL | 2.0 | 2.0 | 1231 | $3,750 | $3.05 | 23d | 1 | 0.13mi |
| 2690 Cypress Trace Cir #3212 Naples, FL | 2.0 | 2.0 | 1232 | $5,300 | $4.30 | 23d | 1 | 0.16mi |
| 2700 Cypress Trace Cir #3112 Naples, FL | 2.0 | 2.0 | 1232 | $2,100 | $1.70 | 23d | 1 | 0.20mi |
| 2925 Cypress Trace Cir #201 Naples, FL | 2.0 | 2.0 | 1094 | $4,500 | $4.11 | 23d | 1 | 0.20mi |
| 6605 Huntington Lakes Cir #203 Naples, FL | 2.0 | 2.0 | 1107 | $2,400 | $2.17 | 23d | 1 | 0.24mi |
| 2710 Cypress Trace Cir Naples, FL | 2.0 | 2.0 | 1213 | $3,425 | $2.82 | 23d | 2 | 0.24mi |
| 2880 Cypress Trace Cir #103 Naples, FL | 2.0 | 2.0 | 1372 | $5,500 | $4.01 | 23d | 1 | 0.26mi |
| 2720 Cypress Trace Cir Naples, FL | 2.0–3.0 | 2.0 | 1283 | $2,100 | $1.64 | 23d | 3 | 0.27mi |
| 2870 Cypress Trace Cir #1713 Naples, FL | 2.0 | 2.0 | 1414 | $2,900 | $2.05 | 23d | 1 | 0.28mi |
| 2895 Cypress Trace Cir #202 Naples, FL | 2.0 | 2.0 | 1232 | $4,500 | $3.65 | 23d | 1 | 0.29mi |
| 2895 Cypress Trace Cir #104 Naples, FL | 2.0 | 2.0 | 1252 | $4,800 | $3.83 | 23d | 1 | 0.29mi |
| 2855 Cypress Trace Cir #102 Naples, FL | 2.0 | 2.0 | 1232 | $2,000 | $1.62 | 14d | 1 | 0.34mi |
| 2855 Cypress Trace Cir #202 Naples, FL | 2.0 | 2.0 | 1232 | $4,800 | $3.90 | 14d | 1 | 0.34mi |
| 2820 Cypress Trace Cir Naples, FL | 2.0 | 2.0 | 1254 | $3,748 | $2.99 | 23d | 3 | 0.36mi |
| 2730 Cypress Trace Cir Unit 1 Naples, FL | 2.0 | 2.0 | 1232 | $5,500 | $4.46 | 23d | 1 | 0.37mi |
| 2730 Cypress Trace Cir Unit 2836S Naples, FL | 2.0 | 2.0 | 1194 | $5,000 | $4.19 | 23d | 1 | 0.37mi |
| 2730 Cypress Trace Cir Unit 2836A Naples, FL | 2.0 | 2.0 | 1194 | $2,000 | $1.68 | 23d | 1 | 0.37mi |
| 2835 Cypress Trace Cir Unit 1049710P Naples, FL | 3.0 | 2.0 | 1248 | $4,110 | $3.29 | 14d | 1 | 0.38mi |
| 2740 Cypress Trace Cir Naples, FL | 2.0 | 2.0 | 1493 | $3,488 | $2.34 | 23d | 3 | 0.40mi |
| 2469 Millcreek Ln #102 Naples, FL | 2.0 | 2.0 | 1107 | $3,495 | $3.16 | 23d | 1 | 0.44mi |
| 2790 Cypress Trace Cir Naples, FL | 2.0 | 2.0 | 1537 | $5,000 | $3.25 | 23d | 2 | 0.46mi |
| 6655 Huntington Lakes Cir #204 Naples, FL | 3.0 | 2.0 | 1315 | $3,500 | $2.66 | 23d | 1 | 0.47mi |
| 2456 Millcreek Ln #102 Naples, FL | 2.0 | 2.0 | 1107 | $2,375 | $2.15 | 23d | 1 | 0.49mi |
| 2408 Millcreek Ln #202 Naples, FL | 2.0 | 2.0 | 1207 | $2,200 | $1.82 | 23d | 1 | 0.51mi |
| 6544 Huntington Lakes Cir Unit 9-204 Naples, FL | 3.0 | 2.0 | 1382 | $4,250 | $3.08 | 23d | 1 | 0.54mi |
| 5693 Heron Ln #502 Naples, FL | 2.0 | 2.0 | 1490 | $6,800 | $4.56 | 23d | 1 | 0.59mi |
| 5455 Worthington Ln #202 Naples, FL | 2.0 | 2.0 | 1427 | $3,900 | $2.73 | 23d | 1 | 1.06mi |
| 5455 Worthington Ln #103 Naples, FL | 2.0 | 2.0 | 1202 | $5,000 | $4.16 | 23d | 1 | 1.06mi |
| 5928 Sand Wedge Ln #1808 Naples, FL | 2.0 | 2.0 | 1478 | $6,000 | $4.06 | 23d | 1 | 1.07mi |
| 5928 Sand Wedge Ln #1805 Naples, FL | 2.0 | 2.0 | 1478 | $6,500 | $4.40 | 23d | 1 | 1.07mi |
| 5025 Cedar Springs Dr #102 Naples, FL | 2.0 | 2.5 | 1202 | $3,510 | $2.92 | 23d | 1 | 1.08mi |
| 5025 Cedar Springs Dr #102 Naples, FL | 2.0 | 2.0 | 1202 | $1,590 | $1.32 | 14d | 1 | 1.08mi |
| 5045 Cedar Springs Dr #203 Naples, FL | 2.0 | 2.0 | 1427 | $4,200 | $2.94 | 23d | 1 | 1.08mi |
| 5045 Cedar Springs Dr #103 Naples, FL | 2.0 | 2.0 | 1202 | $5,000 | $4.16 | 23d | 1 | 1.08mi |
| 4970 Deerfield Way Unit F-203 Naples, FL | 2.0 | 2.0 | 1388 | $1,990 | $1.43 | 14d | 1 | 1.12mi |
| 4910 Deerfield Way #103 Naples, FL | 2.0 | 2.0 | 1200 | $4,800 | $4.00 | 21d | 1 | 1.12mi |
HOA detail condo
- Monthly dues
- $558 · $6,696/yr
- Assessments
- None detected in remarks — confirm with the listing agent.
Listing history 17 events
-
2026-06-18days on market $294,900 Active 69 DOM
-
2026-06-17days on market $294,900 Active 68 DOM
-
2026-06-16days on market $294,900 Active 67 DOM
-
2026-06-15days on market $294,900 Active 66 DOM
-
2026-06-14days on market $294,900 Active 64 DOM
-
2026-06-10days on market $294,900 Active 61 DOM
-
2026-06-09days on market $294,900 Active 60 DOM
-
2026-06-08days on market $294,900 Active 59 DOM
-
2026-06-07days on market $294,900 Active 58 DOM
-
2026-06-03days on market $294,900 Active 54 DOM
-
2026-06-02days on market $294,900 Active 53 DOM
-
2026-06-01days on market $294,900 Active 52 DOM
-
2026-05-31days on market $294,900 Active 51 DOM
-
2026-05-30days on market $294,900 Active 50 DOM
-
2026-04-10$309,000 Active
-
2025-05-01historical $3,400
-
2024-12-06$3,400
ⓘ Source: listings_history table (triggers on properties + properties_extension) + one-shot
backfill from property_details.listing_events for pre-trigger history.
Tax reassessment forecast FL · Resets to sale price
- Current annual tax
- $2,477 · $206/mo
- Projected year-2 tax
- $2,477 · $206/mo
- Expected delta
- $0/yr ($0/mo · 0.0%)
ⓘ Screening estimate from a state-policy table — verify with the county assessor before closing.
Climate risk First Street
- Flood 1/10 Low FEMA zone X (unshaded) · 0% chance over 30 yrs
- Wildfire 1/10 Low
- Heat 10/10 Extreme 7 d/yr ≥108°F today · 30 d/yr by 30 yrs out
- Wind 10/10 Extreme 99% chance of damaging wind over 30 yrs
- Air quality 2/10 Low 2 unhealthy d/yr today · 2 by 30 yrs out
Nearby sold comps map
Loading sold comps map…
Walkable amenities ~0.75 mi
Loading nearby amenities…
Taxation est. · year 1
- Rental income
- $42,422
- − Mortgage interest
- −$16,519
- − Property taxes
- −$2,477
- − Insurance
- −$1,474
- − Repairs & maintenance
- −$3,394
- − Management
- −$3,394
- − HOA
- −$6,696
- − Depreciation
- −$8,579
- Taxable loss
- −$111
- Est. tax savings @ 24.0%
- +$27
- After-tax cash flow
- $4,335/yr
For passive investors: Depreciation is non-cash, so a rental often shows a tax loss while cash-flowing — sheltering income. Rental losses are passive: they offset passive income freely, and up to $25,000/yr can offset ordinary (W-2) income if you actively participate and your MAGI is under $100k (phasing out to $0 by $150k); unused losses carry forward. On sale, claimed depreciation is recaptured at up to 25%, and gains may owe capital-gains tax (a 1031 exchange can defer both). Figures are a year-1 estimate at your 24.0% rate — not tax advice; consult a CPA.
Schools (NCES district)
- District
- Collier
- NCES district ID
- 1200330
- Math proficiency
- 60% ▼ -4.00%
- Reading proficiency
- 56% ▼ -2.00%
- Median HH income
- $58,275
- Composite
- 50.23/100
- National rank
- #1892
- State rank
- #16 of 73 in FL
Livability — Bonita Springs
- Score
- 70/100
- State rank
- #428
- US rank
- #7576
Category grades
Schools grade is shown separately in the Schools card above.
Census & demographics
- County
- Collier County · 396,295 people
- City population
- 64,727
- Metro
- Naples-Marco Island, FL
- Population (ZIP)
- 36,807
- Household income
- $113,391
- Rent vs Own
- Severe rent burden
- 741.0
Population outlook (Collier County) Hauer SSP2
- Today (2025)
- 420,858 people
- By 2030
- 450,054 · +6.9%
- By 2040
- 502,232 · +19.3%
- By 2050
- 544,932 · +29.5%
- By 2075
- 627,203 · +49.0%
- By 2100
- 659,015 · +56.6%
Race, ethnicity, and origin ACS 2023
- Neighborhood character
- Predominantly White (74%)
- Race & ethnicity
- White 74% Hispanic / Latino 20% Two or more races 14% Black 1%
- Hispanic origin (detail)
- Mexican 6% Puerto Rican 2% Cuban 4% Dominican 2%
- Common ancestry
- Romanian 4% Lithuanian 2% Italian 2%
- Foreign-born
- 17% · Canada, Jamaica, Dominican Republic
- Languages at home
- 78% English-only · Spanish 15% Other Indo-European 3% Russian/Polish/Slavic 1%
Political lean MEDSL · Collier
- 2024 margin
- Solid R (+33.1) · D 33.1% · R 66.2%
- 2008→2024 swing
- -10.6pp toward R · 2008: -22.5pp · 2024: -33.1pp
- All cycles
- 2024: R+33.1 2020: R+24.7 2016: R+26.0 2012: R+30.1 2008: R+22.5
Not yet ingested
- Civics
- —
Market trends
- HPI YoY
- ▼ -243.12%
- Current HPI
- 269.3208
- Rent YoY
- ▼ -2.51%
- Metro
- Naples-Marco Island, FL
- State GDP YoY
- ▲ 3.28%
- F500 in state
- 36
Industry mix (Fortune 500 HQ in FL)
| Industry | F500 HQs | Revenue |
|---|---|---|
| Industrial Technology | 2 | $29B |
|
||
| Insurance | 2 | $17B |
|
||
| Retail | 1 | $60B |
|
||
| Technology Distribution | 1 | $58B |
|
||
| Homebuilding | 1 | $35B |
|
||
| Technology Manufacturing | 1 | $35B |
|
||
Price history
+8988.2% since first listed3 events — show timeline
- 2026-04-10 Listed $309,000 NAPLESMLS
- 2025-05-01 Rental Removed $3,400 NAPLESMLS
- 2024-12-06 Listed for Rent $3,400 NAPLESMLS
Property tax history
+5.8%/yrLatest (2025): $2,477 · +4.3% YoY. Source: county tax records.
Cash-flow waterfall
monthlySold comps — $/sqft
last 12 mo · ≤1 miLoading sold comps…