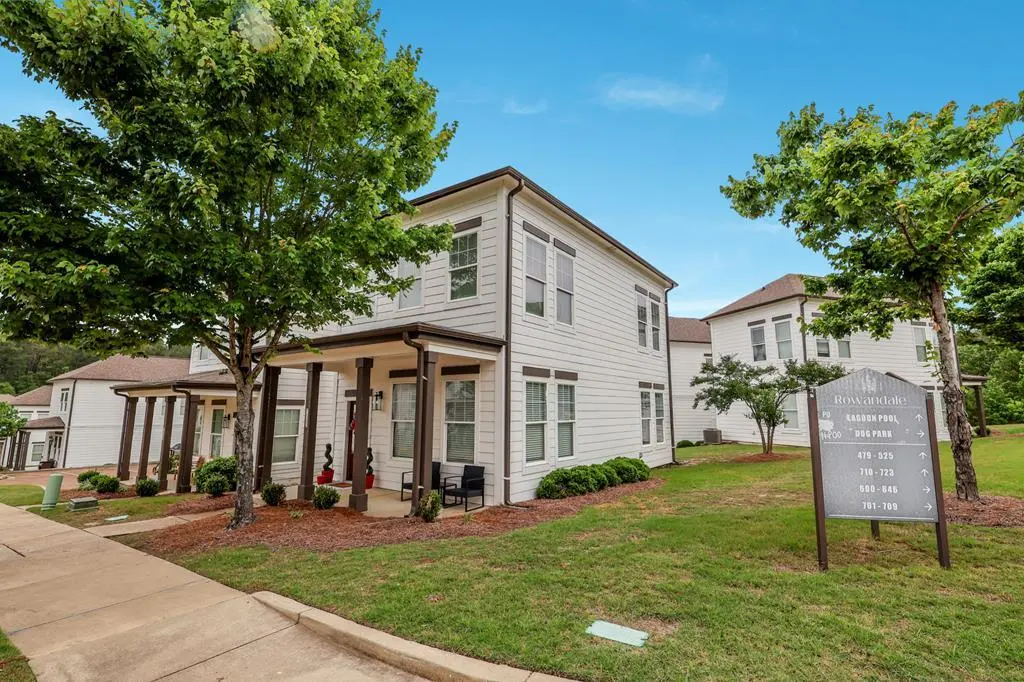
480 Olive Branch Way · Oxford, MS
Flood risk No data
- FEMA flood zone
- —
- Chance of flooding over 30 yrs
- —
- Est. flood insurance / yr
- —
Fire risk No data
- Est. fire insurance / yr
- —
Heat risk No data
- Hot days now (above threshold)
- —
- Hot days in 30 yrs
- —
Wind risk No data
- Chance of severe wind over 30 yrs
- —
Air-quality risk No data
- Unhealthy air days now
- —
- Unhealthy air days in 30 yrs
- —
Risk factors via First Street. Map © Google.
Why this score? — see what drove the D grade
The composite is a weighted blend of 9 inputs, each scored 0–100. Each bar is that input's sub-score; the figure is the points it added to the 100-point composite (weight × sub-score).
- Cash flow +12.6/30.0
- ARV discount +7.5/15.0
- Livability +4.4/5.0
- Schools +4.3/10.0
- DSCR +3.8/10.0
- Rent growth +3.7/5.0
- Condition / age +2.5/5.0
- 1% rule +2.3/10.0
- Appreciation +0.0/10.0
$384,900
🖨 Deal sheet (PDF) 📄 Offer letter ✓ Due diligence
Listing remarks
MOVE IN READY, well kept 3BD/3.5BA corner unit condo in Rowandale! Features a main level bedroom and two additional bedrooms upstairs, each with ensuite baths. The open concept living area has an additional half bathroom for guests, making it perfect for students and weekenders alike! Rowandale amenities include multiple community pools, walking trails, dog parks, pickleball courts and a club house, making it one of the hottest developments in Oxford. Don't let this opportunity pass you by -- schedule your showing TODAY!
Key facts
- Ensuite baths
- Dog parks
- Main level bedroom
Tags
Property features AI
Finance
- HOA & community: Subdivision governed by covenants
Exterior
- Utilities: Public water; Public sewer; Underground utilities
- Home design: Residential condominium (townhouse/condo)
- Construction: Slab foundation
- Exterior features: Porch
Interior
- Kitchen: Microwave; Dishwasher; Disposal; Electric range; Refrigerator
- Flooring: Carpet
- Bathrooms: Three full bathrooms; One half bathroom
- Heating & cooling: Central air; Ceiling fan(s)
- Interior features: Pantry
- Laundry & utility: Electric water heater
Neighborhood map
What this means for you Summary
Snapshot
- This is a 3-bed/1.0-bath condo listed at $385k.
Deal economics
- At list price, monthly cash flow is $-47 ($-567/yr) — negative.
- To cash-flow at today's rent, offer at most $377k (2.2% below list).
- To meet the 1% rule (rent ≥ 1% of price), the offer needs to be $282k (26.7% below list).
- Recommended offer: $282k (26.7% below list) — sets the bar for 1% rule.
- Cap rate 6.1% vs local median 2.8% in Oxford — top-decile yield for the area; either an underpriced asset or a hidden risk that comps aren't pricing in. Stress-test before assuming the spread holds.
Location & tenants
- Location reads 87/100 on livability (#1 in MS, #285 nationally) — a professional / high-income tenant draw. Strengths: amenities A+, commute A+, health & safety A+; Watch: employment C-.
- Oxford School District (town): math 53% / reading 49% proficiency, ranked #12 of 130 in MS (top 9%) — acceptable for families but not a draw, mixed tenant base, ~2y average lease.
- Zoned schools: Bramlett Elementary School (742 students, 100% FRL); Oxford Middle School (math 55% / reading 48%, grade C, #27 of 179 statewide, top 16%, 697 students, 100% FRL); Oxford High School (math 33% / reading 49%, grade F, #49 of 197 statewide, top 25%, 1,345 students, 100% FRL) — zoned schools average 100% FRL vs 42% district-wide (58 pts higher); higher-poverty schools than district average — tighter screening recommended.
- Market conditions: Rents rising fast (+4.8%/yr); 857 active listings in the ZIP; 3 comparable units currently listed for rent nearby; rentals at typical pace (median 26d on market — plan ~3-4 weeks tenant-placement turnaround); 503 units permitted in Lafayette County in 2024 (0 in 5+ unit buildings).
- At $2,823/mo this rent would consume 50% of the median local household income ($68k/yr) (locally 1892% of renters already pay >50% of income on rent) — very limited rent-growth headroom before tenants either downsize or default.
Forward outlook
- Local home prices are declining (-3.0%/yr); year-one equity from $3k of loan paydown is wiped out by about $12k of value loss. Plan a longer hold.
- Lafayette County population projected at +61% by 2050 — long-run rental-demand tailwind backs the buy-and-hold thesis.
Negotiation context
- It's been on market 24 days — a 2% lower offer ($379k) is reasonable based on typical stale-listing flexibility.
Questions for the listing agent
- What do current leases actually rent for vs. the listed asking? Can we see a recent rent roll and the last 12 months of T-12 income?
- Any open or pending special assessments — roof, HVAC, plumbing, elevator, façade? What's the per-unit balance and payoff schedule, and is the seller paying it off at close or rolling it to the buyer?
- Is there a deadline driving the sale (1031 exchange, divorce, estate, relocation)? That informs how much negotiation room exists.
- Schools are B-rated — typically a magnet for longer-tenancy family renters. What's the average tenant stay here, and is there a school-zone premium baked into asking?
- The area grade is low — what's the realistic commute time and amenity access for the typical tenant pool here? Any planned neighborhood developments (good or bad) we should know about?
- What's the average days-on-market for RENTAL listings here right now (not sales)? A rising rental-DOM trend means longer vacancies and softer asking-rent achievability than the comps imply.
- What's the recent tenant-quality profile in this submarket — average credit score on applications, eviction rate, late-payment / NSF rate, and stable-employment percentage? A property-management company in the area should have these aggregated.
- How much new apartment / multifamily construction is in the pipeline within 1–3 miles? Heavy new supply (>2% of stock underway) typically softens rents 12–24 months out; light construction supports rent growth.
Investment metrics
- 1% rule
- 0.73% ✗
- Cap rate
- 6.15%
- Cash-on-cash
- -0.53%
- DSCR
- 0.98
- GRM
- 11.4
CMA / ARV
No comps found within radius.
Projected returns pro-forma
-3.0% appreciation · 4.85% rent growth · sell at horizon
- IRR
- -15.5%
- Equity multiple
- 0.44×
- Total profit
- $-60,219
- Equity at exit
- $57,390
- IRR
- -4.5%
- Equity multiple
- 0.68×
- Total profit
- $-34,287
- Equity at exit
- $33,279
Cash invested: $107,772 (down + closing). Projections, not guarantees.
Landlord ↔ Tenant lean methodology
- Overall (STATE)
- 90 Strongly Landlord-Friendly
- State Mississippi
- 90 Strongly Landlord-Friendly · R+11
- County
- — inherits STATE
- City
- — inherits STATE
ZIP-level market 38655
- Rents YoY
- 4.8%
- Active inventory
- 857
- Price-to-rent
- 11.4×
Monthly cashflow live
- Estimated rent
- $2,823 medium interval (Pro) →
- Mortgage (P&I)
- −$2,018
- Tax from tax record
- −$99 /mo · $1,183/yr
- Insurance
- −$160
- HOA
- −$0
- Vacancy / Maint / Mgmt
- −$593
- Net cashflow
- $-47
Break-even live
Sensitivity live
| Price | -10% $171 | -5% $62 | +0% $-47 | +5% $-156 | +10% $-265 |
|---|---|---|---|---|---|
| Rent | -10% $-270 | -5% $-159 | +0% $-47 | +5% $64 | +10% $176 |
| Rate | -1.0pp $147 | -0.5pp $51 | base $-47 | +0.5pp $-147 | +1.0pp $-248 |
UW: 25.0% down · 7.5% · 30yr · 1.5% tax · 5.0% vac · 8.0% maint · 8.0% mgmt
Financing live
Cash to close
- Down payment
- $96,225
- Closing costs
- $11,547
- Reserves months
- —
- Total cash needed
- —
Loan-product check · same deal, 3 products live
Conventional
25% down · 7.5% · 30yr
- Down + closing
- —
- Monthly P&I
- —
- Monthly cashflow
- —
- DSCR
- —
- Eligible?
- —
Personal DTI + credit; lowest rate.
DSCR
20% down · 8.5% · 30yr
- Down + closing
- —
- Monthly P&I
- —
- Monthly cashflow
- —
- DSCR
- —
- Eligible?
- —
No personal income docs; deal must DSCR.
Hard money
10% down · 12.0% · 12mo
- Down + closing
- —
- Monthly P&I
- —
- Monthly cashflow
- —
- DSCR
- —
- Eligible?
- —
Short-term bridge; refi at stabilization.
Rent comps 3 comps
| Address | Beds | Baths | Sqft | Rent | $/sqft | DOM | Units | Dist |
|---|---|---|---|---|---|---|---|---|
| 301 Baldwin Dr Oxford, MS | 1.0–3.0 | 1.0–3.0 | 935 | $3,075 | $3.29 | 25d | 6 | 0.64mi |
| 814 Claremont Ave Oxford, MS | 1.0–3.0 | 1.0–2.0 | 1108 | $2,655 | $2.40 | 3d | 97 | 0.78mi |
| 1201 Ivy Rd Oxford, MS | 3.0 | 3.0 | 1500 | $2,700 | $1.80 | 25d | 1 | 0.97mi |
HOA detail condo
- Monthly dues
- $0 · $0/yr
- Likely covers
- pool
- Assessments
- None detected in remarks — confirm with the listing agent.
Listing history 17 events
-
2026-06-22days on market $384,900 Active 24 DOM
-
2026-06-21days on market $384,900 Active 23 DOM
-
2026-06-19days on market $384,900 Active 21 DOM
-
2026-06-18days on market $384,900 Active 20 DOM
-
2026-06-17days on market $384,900 Active 19 DOM
-
2026-06-16days on market $384,900 Active 18 DOM
-
2026-06-16price $384,900 Active 17 DOM
-
2026-06-15days on market $399,900 Active 17 DOM
-
2026-06-14days on market $399,900 Active 15 DOM
-
2026-06-12days on market $399,900 Active 14 DOM
-
2026-06-09days on market $399,900 Active 11 DOM
-
2026-06-08days on market $399,900 Active 10 DOM
-
2026-06-07days on market $399,900 Active 9 DOM
-
2026-06-02days on market $399,900 Active 4 DOM
-
2026-06-01days on market $399,900 Active 3 DOM
-
2026-05-31days on market $399,900 Active 2 DOM
-
2026-05-29$399,900 Active
ⓘ Source: listings_history table (triggers on properties + properties_extension) + one-shot
backfill from property_details.listing_events for pre-trigger history.
Tax reassessment forecast MS · Resets to sale price
- Current annual tax
- $1,183 · $99/mo
- Projected year-2 tax
- $3,041 · $253/mo
- Expected delta
- +$1,858/yr (+$155/mo · 157.1%)
ⓘ Screening estimate from a state-policy table — verify with the county assessor before closing.
Nearby sold comps map
Loading sold comps map…
Walkable amenities ~0.75 mi
Loading nearby amenities…
Taxation est. · year 1
- Rental income
- $33,876
- − Mortgage interest
- −$21,560
- − Property taxes
- −$1,183
- − Insurance
- −$1,924
- − Repairs & maintenance
- −$2,710
- − Management
- −$2,710
- − Depreciation
- −$11,197
- Taxable loss
- −$7,409
- Est. tax savings @ 24.0%
- +$1,778
- After-tax cash flow
- $1,211/yr
For passive investors: Depreciation is non-cash, so a rental often shows a tax loss while cash-flowing — sheltering income. Rental losses are passive: they offset passive income freely, and up to $25,000/yr can offset ordinary (W-2) income if you actively participate and your MAGI is under $100k (phasing out to $0 by $150k); unused losses carry forward. On sale, claimed depreciation is recaptured at up to 25%, and gains may owe capital-gains tax (a 1031 exchange can defer both). Figures are a year-1 estimate at your 24.0% rate — not tax advice; consult a CPA.
Schools (NCES district)
- District
- Oxford School District
- NCES district ID
- 2803450
- Math proficiency
- 53% ▼ -17.00%
- Reading proficiency
- 49% ▼ -8.00%
- Median HH income
- $40,878
- Composite
- 42.77/100
- National rank
- #3152
- State rank
- #12 of 130 in MS
Livability — Oxford
- Score
- 87/100
- State rank
- #1
- US rank
- #285
Category grades
Schools grade is shown separately in the Schools card above.
Census & demographics
- Census place
- Oxford, MS
- County
- Lafayette County · 46,156 people
- City population
- 46,156
- Metro
- Oxford, MS
- Population (ZIP)
- 46,156
- Household income
- $68,235
- Rent vs Own
- Severe rent burden
- 1892.0
Population outlook (Lafayette County) Hauer SSP2
- Today (2025)
- 66,984 people
- By 2030
- 74,726 · +11.6%
- By 2040
- 90,806 · +35.6%
- By 2050
- 108,114 · +61.4%
- By 2075
- 151,215 · +125.7%
- By 2100
- 187,997 · +180.7%
Race, ethnicity, and origin ACS 2023
- Neighborhood character
- Predominantly White (68%)
- Race & ethnicity
- White 68% Black 24% Hispanic / Latino 4% Asian 2% Two or more races 2%
- Common ancestry
- Slovak 3% Serbian 2% Lithuanian 1%
- Foreign-born
- 4% · Canada, China, Vietnam
- Languages at home
- 95% English-only · Spanish 2% Other Indo-European 1% Vietnamese 1%
Political lean MEDSL · Lafayette
- 2024 margin
- Strong R (+21.8) · D 38.3% · R 60.0% · Other 1.7%
- 2008→2024 swing
- -9.4pp toward R · 2008: -12.4pp · 2024: -21.8pp
- All cycles
- 2024: R+21.8 2020: R+12.3 2016: R+14.8 2012: R+15.6 2008: R+12.4
Not yet ingested
- Civics
- —
Market trends
- HPI YoY
- ▼ -204.86%
- Current HPI
- 211.5486
- Rent YoY
- ▲ 4.85%
- Metro
- Oxford, MS
- State GDP YoY
- —
- F500 in state
- 0
Price history
1 event — show timeline
- 2026-05-29 Listed $399,900 NCMBR
Property tax history
+12.3%/yrLatest (2025): $1,183 · +19.5% YoY. Source: county tax records.
Cash-flow waterfall
monthlySold comps — $/sqft
last 12 mo · ≤1 miLoading sold comps…