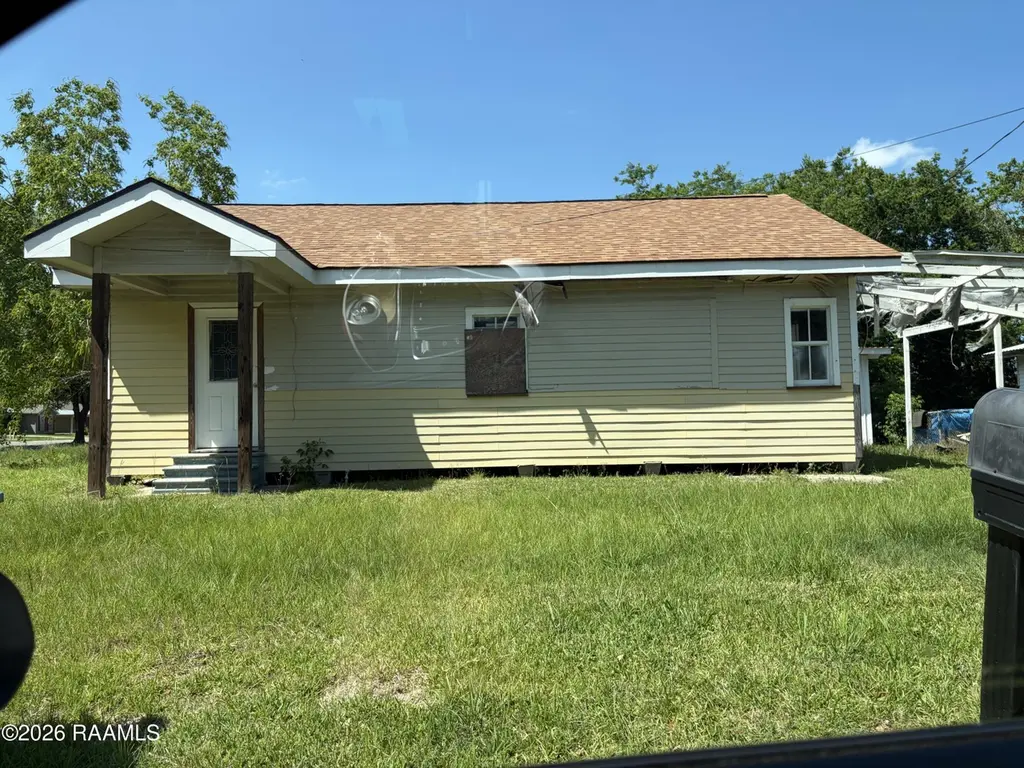
420 Arthur St · Lafayette, LA
Flood risk 8/10 · Major
- FEMA flood zone
- X (unshaded)
- Chance of flooding over 30 yrs
- 0.99%
- Est. flood insurance / yr
- $507 – $1,088
Fire risk 1/10 · Minimal
- Est. fire insurance / yr
- $1,269 – $2,357
Heat risk 8/10 · Major
- Hot days now (above 109°F)
- 7 days/yr
- Hot days in 30 yrs
- 20 days/yr
Wind risk 9/10 · Severe
- Chance of severe wind over 30 yrs
- 99.0%
Air-quality risk 2/10 · Minimal
- Unhealthy air days now
- 0 days/yr
- Unhealthy air days in 30 yrs
- 1 days/yr
Risk factors via First Street. Map © Google.
Why this score? — see what drove the B+ grade
The composite is a weighted blend of 9 inputs, each scored 0–100. Each bar is that input's sub-score; the figure is the points it added to the 100-point composite (weight × sub-score).
- Cash flow +30.0/30.0
- ARV discount +15.0/15.0
- DSCR +10.0/10.0
- 1% rule +8.6/10.0
- Rent growth +4.3/5.0
- Schools +3.6/10.0
- Livability +3.5/5.0
- Condition / age +2.5/5.0
- Appreciation +0.0/10.0
$70,000
🖨 Deal sheet 📄 Offer letter ✓ Due diligence
Listing remarks MLS
Corner and inside lot available to build on. House on propety has no value. Demolition of house to be at buyers expense. Price includes 2 lots (corner 88x126) (Inside Lot 50x123)
Key facts
- 0.25 acre lot
- Parking
- Built 1960
Property features AI
Exterior
- Parking: Carport (1 covered space, total parking for 1 vehicle)
- Utilities: Gas service by Atmos; Public sewer
- Home design: Single family residence; Property listed as a fixer
- Construction: Wood siding and frame construction
- Exterior features: Wood siding/frame construction; Fronts a city street
Interior
- Bathrooms: 1 full bathroom
- Interior features: Central heating and cooling (listed as Other); Has heating; Has cooling
Neighborhood map
What this means for you Summary
Snapshot
- This is a 1-bed/1.0-bath single-family listed at $70k.
Deal economics
- At list price, monthly cash flow is $244 ($3k/yr) — positive.
- The deal already cash-flows at list — no discount required.
- Meets the 1% rule at list price ($950 rent vs $70k).
- Recommended offer: $69k (1.5% below list) — sets the bar for market timing.
- Cap rate 11.6% vs local median 4.7% in Lafayette — top-decile yield for the area; either an underpriced asset or a hidden risk that comps aren't pricing in. Stress-test before assuming the spread holds.
Location & tenants
- Location reads 70/100 on livability (#63 in LA) — a middle-class / working-renter tenant base. Strengths: cost of living A+, housing A+, health & safety A+; Watch: amenities C-, employment C-, crime F.
- Lafayette Parish (urban): math 38% / reading 46% proficiency, ranked #19 of 98 in LA (top 19%) — families likely to look elsewhere, expect single-tenant / working-renter base with shorter leases.
- Zoned schools: Acadian Middle School (math 13% / reading 27%, grade F, #166 of 218 statewide, top 76%, 372 students, 74% FRL); Lafayette High School (math 57% / reading 51%, grade C-, #28 of 265 statewide, top 11%, 1,852 students, 52% FRL).
- Market conditions: Rents rising fast (+7.3%/yr); 246 active listings in the ZIP; 12 comparable units currently listed for rent nearby; rentals at typical pace (median 21d on market — plan ~3-4 weeks tenant-placement turnaround); lower-income renter base — watch delinquency; 1,585 units permitted in Lafayette Parish in 2024 (10 in 5+ unit buildings).
Forward outlook
- Local home prices are declining (-3.0%/yr); year-one equity from $484 of loan paydown is wiped out by about $2k of value loss. Plan a longer hold.
- Lafayette County population projected at +34% by 2050 — long-run rental-demand tailwind backs the buy-and-hold thesis.
- At projected returns (-3.0% appreciation + 7.3% rent growth), your $20k cash investment doubles in ~6 years — after that, you're playing with house money.
Negotiation context
- It's been on market 23 days — a 2% lower offer ($69k) is reasonable based on typical stale-listing flexibility.
- 2 sale attempts since 15y ago; this cycle's ask is 259% above the opening price — seller raised mid-cycle; expect resistance to lowballs.
- Current owner paid $13k; list at $70k implies a 438% gain — meaningful room to come down on a strong offer.
Risks & watch-outs
- Watch-outs: flood insurance adds $66/mo.
- Climate carrying-cost: severe flood risk; severe wind risk, 99% chance of damaging wind over 30y; extreme-heat days projected 7→20/yr by 2055 (HVAC capex compounding) — expect insurance premiums to compound above CPI over the hold.
Questions for the listing agent
- Built in 1960 — when were the roof, HVAC, electrical panel, plumbing, and water heater last replaced?
- What's the actual annual flood-insurance premium (NFIP or private), and is the property in a SFHA with mandatory coverage?
- Is there a deadline driving the sale (1031 exchange, divorce, estate, relocation)? That informs how much negotiation room exists.
- Schools are B-rated — typically a magnet for longer-tenancy family renters. What's the average tenant stay here, and is there a school-zone premium baked into asking?
- Crime grade is F in this area — have there been break-ins, vandalism, or insurance claims at this property in the last 3 years? What carrier currently insures it and at what premium?
- What's the average days-on-market for RENTAL listings here right now (not sales)? A rising rental-DOM trend means longer vacancies and softer asking-rent achievability than the comps imply.
- What's the recent tenant-quality profile in this submarket — average credit score on applications, eviction rate, late-payment / NSF rate, and stable-employment percentage? A property-management company in the area should have these aggregated.
- How much new for-sale + rental construction is in the pipeline within 1–3 miles? Heavy new supply typically softens prices + rents 12–24 months out; constrained supply supports both.
Investment metrics
- 1% rule
- 1.36% ✓
- Cap rate
- 11.62%
- Cash-on-cash
- 19.02%
- DSCR
- 1.85
- GRM
- 6.1
CMA / ARV
- ARV (on-the-fly)
- $88,504
- Comps found
- 10
Show comp detail 10 sales within ~0.75 mi
| Address | Dist | Beds/Ba | Sqft | Sold | Price | $/sf | Match |
|---|---|---|---|---|---|---|---|
| 411 N Saint Antoine St | 0.17mi | 2/1.0 (+1) | 848 (-0%) | 13mo | $55,000 | $65 | 76 |
| 421 N Saint Antoine St | 0.15mi | 2/1.0 (+1) | 791 (-7%) | 8mo | $47,500 | $60 | 69 |
| 800 N St Antoine St | 0.09mi | 2/1.0 (+1) | 742 (-13%) | 14mo | $95,000 | $128 | 58 |
| 403 Railroad St | 0.24mi | 2/1.0 (+1) | 724 (-15%) | 8mo | $75,000 | $104 | 53 |
| 930 Evangeline Dr | 0.53mi | 1/1.0 | 726 (-15%) | 0mo | $52,000 | $72 | 50 |
| 617 Cedar Crest Ct | 0.68mi | 2/1.0 (+1) | 779 (-8%) | 4mo | $125,000 | $160 | 46 |
| 505 Sherman St | 0.63mi | 2/1.0 (+1) | 750 (-12%) | 2mo | $100,000 | $133 | 44 |
| 114 Whitney St | 0.61mi | 2/1.0 (+1) | 972 (+14%) | 15mo | $50,000 | $51 | 30 |
| 1014 N Pierce St | 0.69mi | 2/1.0 (+1) | 750 (-12%) | 17mo | $47,000 | $63 | 29 |
| 116 Lasalle St | 0.74mi | 2/1.0 (+1) | 939 (+10%) | 18mo | $159,000 | $169 | 28 |
Match score weights: distance 35% · size 25% · config 20% · recency 20%. Top-matched comps best support the ARV.
Projected returns pro-forma
-3.0% appreciation · 7.35% rent growth · sell at horizon
- IRR
- 10.5%
- Equity multiple
- 1.44×
- Total profit
- $8,577
- Equity at exit
- $10,437
- IRR
- 23.0%
- Equity multiple
- 3.40×
- Total profit
- $47,102
- Equity at exit
- $6,052
Cash invested: $19,600 (down + closing). Projections, not guarantees.
Landlord ↔ Tenant lean methodology
- Overall (STATE)
- 90 Strongly Landlord-Friendly
- State Louisiana
- 90 Strongly Landlord-Friendly · R+12
- County
- — inherits STATE
- City
- — inherits STATE
ZIP-level market 70501
- Rents YoY
- 7.3%
- Active inventory
- 246
- Price-to-rent
- 6.1×
Monthly cashflow live
- Estimated rent
- $950 high interval (Pro) →
- Mortgage (P&I)
- −$367
- Tax from tax record
- −$44 /mo · $528/yr
- Insurance
- −$29
- Flood insurance flood zone
- −$66 /mo · $798/yr
- HOA
- −$0
- Vacancy / Maint / Mgmt
- −$200
- Net cashflow
- $244
Break-even live
UW: 25.0% down · 7.5% · 30yr · 1.5% tax · 5.0% vac · 8.0% maint · 8.0% mgmt
Financing live
Cash to close
- Down payment
- $17,500
- Closing costs
- $2,100
- Reserves months
- —
- Total cash needed
- —
Loan-product check · same deal, 3 products live
Conventional
25% down · 7.5% · 30yr
- Down + closing
- —
- Monthly P&I
- —
- Monthly cashflow
- —
- DSCR
- —
- Eligible?
- —
Personal DTI + credit; lowest rate.
DSCR
20% down · 8.5% · 30yr
- Down + closing
- —
- Monthly P&I
- —
- Monthly cashflow
- —
- DSCR
- —
- Eligible?
- —
No personal income docs; deal must DSCR.
Hard money
10% down · 12.0% · 12mo
- Down + closing
- —
- Monthly P&I
- —
- Monthly cashflow
- —
- DSCR
- —
- Eligible?
- —
Short-term bridge; refi at stabilization.
Rent comps 12 comps
| Address | Beds | Baths | Sqft | Rent | $/sqft | DOM | Units | Dist |
|---|---|---|---|---|---|---|---|---|
| 815 Martin Luther King Junior Dr Apt 29 Lafayette, LA | 2.0 | 1.0 | 873 | $800 | $0.92 | 20d | 1 | 0.69mi |
| 815 Martin Luther King Junior Dr Unit 40 Lafayette, LA | 2.0 | 1.0 | 873 | $800 | $0.92 | 43d | 1 | 0.69mi |
| 1901 W University Ave Lafayette, LA | 2.0 | 1.0 | 600 | $800 | $1.33 | 13d | 1 | 0.74mi |
| 406 Silkwood St Unit D Lafayette, LA | 2.0 | 1.0 | 800 | $850 | $1.06 | 43d | 1 | 0.75mi |
| 301 Sampson St Lafayette, LA | 1.0 | 1.0 | 545 | $750 | $1.38 | 13d | 1 | 0.75mi |
| 406 Voorhies St Unit B Lafayette, LA | 1.0 | 1.0 | 575 | $825 | $1.43 | 20d | 1 | 0.87mi |
| 319 Tissington St Lafayette, LA | 2.0 | 1.0 | 956 | $775 | $0.81 | 43d | 1 | 0.98mi |
| 1501 W Saint Mary Blvd Unit B Lafayette, LA | 2.0 | 1.0 | 832 | $1,000 | $1.20 | 13d | 1 | 1.15mi |
| 124 E Main St Lafayette, LA | 1.0 | 1.0 | 789 | $1,380 | $1.75 | 13d | 7 | 1.29mi |
| 1120 S Washington St Unit A Lafayette, LA | 2.0 | 2.0 | 892 | $2,200 | $2.47 | 13d | 1 | 1.33mi |
| 617 E Vermilion St Unit C Lafayette, LA | 2.0 | 1.0 | 625 | $1,199 | $1.92 | 13d | 1 | 1.48mi |
| 317 W University Ave Apt 4 Lafayette, LA | 1.0 | 1.0 | 1000 | $1,100 | $1.10 | 43d | 1 | 1.49mi |
Listing history 21 events
-
2026-06-18days on market $70,000 Coming Soon 23 DOM
-
2026-06-17days on market $70,000 Coming Soon 22 DOM
-
2026-06-16days on market $70,000 Coming Soon 21 DOM
-
2026-06-15days on market $70,000 Coming Soon 20 DOM
-
2026-06-14days on market $70,000 Coming Soon 18 DOM
-
2026-06-13days on market $70,000 Coming Soon 17 DOM
-
2026-06-10days on market $70,000 Coming Soon 15 DOM
-
2026-06-09days on market $70,000 Coming Soon 14 DOM
-
2026-06-08days on market $70,000 Coming Soon 13 DOM
-
2026-06-07days on market $70,000 Coming Soon 12 DOM
-
2026-06-05days on market $70,000 Coming Soon 9 DOM
-
2026-06-03days on market $70,000 Coming Soon 8 DOM
-
2026-06-02days on market $70,000 Coming Soon 7 DOM
-
2026-06-01days on market $70,000 Coming Soon 6 DOM
-
2026-05-31days on market $70,000 Coming Soon 5 DOM
-
2026-05-30days on market $70,000 Coming Soon 4 DOM
-
2026-05-26historical $70,000
-
2013-03-26soldstatus $13,000 178-char remark
Show marketing remark (178 chars)
Corner and inside lot available to build on. House on propety has no value. Demolition of house to be at buyers expense. Price includes 2 lots (corner 88x126) (Inside Lot 50x123)
-
2013-03-26soldstatus $13,000
Show marketing remark (178 chars)
Corner and inside lot available to build on. House on propety has no value. Demolition of house to be at buyers expense. Price includes 2 lots (corner 88x126) (Inside Lot 50x123)
-
2012-07-19$19,500 178-char remark
Show marketing remark (178 chars)
Corner and inside lot available to build on. House on propety has no value. Demolition of house to be at buyers expense. Price includes 2 lots (corner 88x126) (Inside Lot 50x123)
-
2011-05-19$39,000
ⓘ Source: listings_history table (triggers on properties + properties_extension) + one-shot
backfill from property_details.listing_events for pre-trigger history.
Tax reassessment forecast LA · Resets to sale price
- Current annual tax
- $528 · $44/mo
- Projected year-2 tax
- $528 · $44/mo
- Expected delta
- $0/yr ($0/mo · 0.0%)
ⓘ Screening estimate from a state-policy table — verify with the county assessor before closing.
Climate risk First Street
- Flood 8/10 Severe FEMA zone X (unshaded) · 99% chance over 30 yrs
- Wildfire 1/10 Low
- Heat 8/10 Severe 7 d/yr ≥109°F today · 20 d/yr by 30 yrs out
- Wind 9/10 Extreme 99% chance of damaging wind over 30 yrs
- Air quality 2/10 Low 0 unhealthy d/yr today · 1 by 30 yrs out
Nearby sold comps map
Loading sold comps map…
Walkable amenities ~0.75 mi
Loading nearby amenities…
Taxation est. · year 1
- Rental income
- $11,406
- − Mortgage interest
- −$3,921
- − Property taxes
- −$528
- − Insurance
- −$1,148
- − Repairs & maintenance
- −$912
- − Management
- −$912
- − Depreciation
- −$2,036
- Taxable income
- $1,948
- Est. tax owed @ 24.0%
- −$467
- After-tax cash flow
- $2,462/yr
For passive investors: Depreciation is non-cash, so a rental often shows a tax loss while cash-flowing — sheltering income. Rental losses are passive: they offset passive income freely, and up to $25,000/yr can offset ordinary (W-2) income if you actively participate and your MAGI is under $100k (phasing out to $0 by $150k); unused losses carry forward. On sale, claimed depreciation is recaptured at up to 25%, and gains may owe capital-gains tax (a 1031 exchange can defer both). Figures are a year-1 estimate at your 24.0% rate — not tax advice; consult a CPA.
Schools (NCES district)
- District
- Lafayette Parish
- NCES district ID
- 2200870
- Math proficiency
- 38% ▼ -32.00%
- Reading proficiency
- 46% ▼ -24.00%
- Median HH income
- $50,238
- Composite
- 36.15/100
- National rank
- #4741
- State rank
- #19 of 98 in LA
Livability — Lafayette
- Score
- 70/100
- State rank
- #63
- US rank
- #8133
Category grades
Schools grade is shown separately in the Schools card above.
Census & demographics
- Census place
- Lafayette, LA
- County
- Lafayette Parish · 207,544 people
- City population
- 158,114
- Metro
- Lafayette, LA
- Population (ZIP)
- 26,465
- Household income
- $33,365
- Rent vs Own
- Severe rent burden
- 2089.0
Population outlook (Lafayette County) Hauer SSP2
- Today (2025)
- 280,930 people
- By 2030
- 301,092 · +7.2%
- By 2040
- 339,456 · +20.8%
- By 2050
- 375,156 · +33.5%
- By 2075
- 451,672 · +60.8%
- By 2100
- 497,203 · +77.0%
Race, ethnicity, and origin ACS 2023
- Neighborhood character
- Predominantly Black (73%)
- Race & ethnicity
- Black 73% White 18% Two or more races 6% Hispanic / Latino 4%
- Common ancestry
- Lithuanian 4%
- Foreign-born
- 2% · Canada
- Languages at home
- 95% English-only · Spanish 3% French/Haitian/Cajun 2%
Political lean MEDSL · Lafayette
- 2024 margin
- Solid R (+31.4) · D 33.5% · R 64.8% · Other 1.7%
- 2008→2024 swing
- -0.1pp no change · 2008: -31.3pp · 2024: -31.4pp
- All cycles
- 2024: R+31.4 2020: R+28.7 2016: R+33.6 2012: R+33.7 2008: R+31.3
Not yet ingested
- Civics
- —
Market trends
- HPI YoY
- ▼ -108.63%
- Current HPI
- 81.2963
- Rent YoY
- ▲ 7.35%
- Metro
- Lafayette, LA
- State GDP YoY
- ▲ 3.29%
- F500 in state
- 10
Industry mix (Fortune 500 HQ in LA)
| Industry | F500 HQs | Revenue |
|---|---|---|
| Telecommunications | 2 | $23B |
|
||
| Utilities | 1 | $12B |
|
||
| Wholesale / Distribution | 1 | $5B |
|
||
| Advertising | 1 | $2B |
|
||
Price history
+79.5% since first listed5 events — show timeline
- 2026-05-26 Coming Soon $70,000 AcadianaMLS
- 2013-03-26 Sold (Public Records) $13,000 Public Records
- 2013-03-26 Sold (MLS) $13,000 AcadianaMLS
- 2012-07-19 Listed $19,500 AcadianaMLS
- 2011-05-19 Listed $39,000 AcadianaMLS
Property tax history
+1.0%/yrLatest (2025): $528 · -1.1% YoY. Source: county tax records.
Cash-flow waterfall
monthlySold comps — $/sqft
last 12 mo · ≤1 miLoading sold comps…