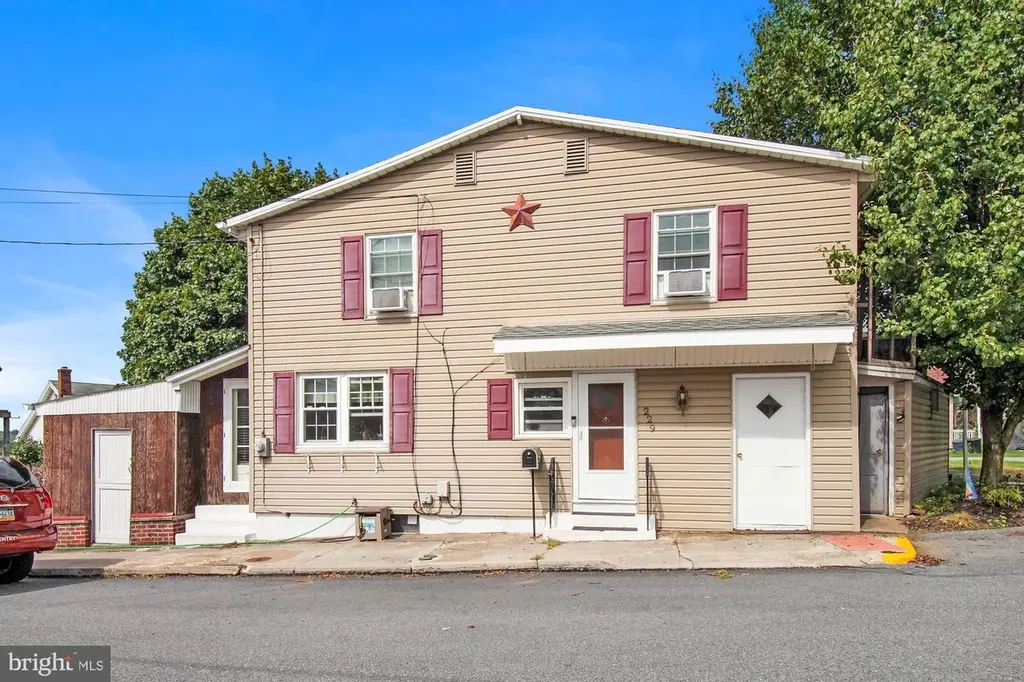
229 Northmont Ave · Hamburg, PA
Flood risk 1/10 · Minimal
- FEMA flood zone
- X (unshaded)
- Chance of flooding over 30 yrs
- 0.0%
- Est. flood insurance / yr
- $473 – $860
Fire risk 1/10 · Minimal
- Est. fire insurance / yr
- $511 – $949
Heat risk 5/10 · Moderate
- Hot days now (above 100°F)
- 8 days/yr
- Hot days in 30 yrs
- 17 days/yr
Wind risk 4/10 · Minor
- Chance of severe wind over 30 yrs
- 10.0%
Air-quality risk 2/10 · Minimal
- Unhealthy air days now
- 0 days/yr
- Unhealthy air days in 30 yrs
- 1 days/yr
Risk factors via First Street. Map © Google.
Why this score? — see what drove the C+ grade
The composite is a weighted blend of 9 inputs, each scored 0–100. Each bar is that input's sub-score; the figure is the points it added to the 100-point composite (weight × sub-score).
- Cash flow +16.2/30.0
- ARV discount +15.0/15.0
- Appreciation +10.0/10.0
- DSCR +5.0/10.0
- 1% rule +4.1/10.0
- Livability +3.7/5.0
- Schools +3.2/10.0
- Rent growth +2.5/5.0
- Condition / age +2.5/5.0
$199,000
🖨 Deal sheet 📄 Offer letter ✓ Due diligence
Listing remarks
Charming single home in the north end of Hamburg has something for everyone. This cozy 2- story features 3 bedrooms, a first-floor powder room, spacious living room, and an updated kitchen. There is also a unique flex-space, perfect for a home office or additional storage. The fully-fenced yard with patio is a perfect oasis for relaxing, grilling, and gardening. Close proximity to 78 and Route 61 and walkable to dining, shopping, the library, and public park/pool. Don?t miss out on making this house your home!
Key facts
- 3,920 sq ft lot
- Built 1935
- Listed 38 days
Property features AI
Finance
- Other: Not located in a federal flood zone; Accessibility features listed as 'Other'
Exterior
- Parking: On-street parking
- Utilities: Public water; Public sewer; Electric service with circuit breakers; Electric hot water; Internet: Cable and other
- Home design: Detached single-family home; Architectural shingle roof; Vinyl siding; Fee simple ownership
- Construction: Vinyl siding construction; Architectural shingle roof; Other foundation type
- Exterior features: Patio(s); Awnings; Fully fenced yard; Paved road access (borough/township maintained)
Interior
- Kitchen: Electric oven/range; Refrigerator
- Bedrooms: 3 bedrooms on the first upper level
- Flooring: Carpet; Ceramic tile; Laminate plank; Vinyl
- Bathrooms: 1 full bathroom on the upper level; 1 half bathroom on the main level; Total: 1 full, 1 half
- Heating & cooling: Hot water heating (oil-fired); Window air conditioning units
- Interior features: Drywall walls and ceilings; Daylight full unfinished basement; 6 total rooms (Living Room, Dining Room, Kitchen, Master Bedroom, 2 additional bedrooms, Full Bath, Half Bath)
- Laundry & utility: Laundry located in the basement
Neighborhood map
What this means for you Summary
Snapshot
- This is a 3-bed/1.0-bath single-family listed at $199k.
Deal economics
- At list price, monthly cash flow is $106 ($1k/yr) — positive.
- The deal already cash-flows at list — no discount required.
- To meet the 1% rule (rent ≥ 1% of price), the offer needs to be $182k (8.7% below list).
- Recommended offer: $182k (8.7% below list) — sets the bar for 1% rule.
Location & tenants
- Location reads 74/100 on livability (#529 in PA, #4,893 nationally) — a middle-class / working-renter tenant base. Strengths: cost of living A+, housing A+, health & safety A+; Watch: schools C-, amenities D+, commute F.
- Hamburg Area SD (other): math 31% / reading 43% proficiency, ranked #377 of 539 in PA (top 70%) — families likely to look elsewhere, expect single-tenant / working-renter base with shorter leases.
- Market conditions: 46 active listings in the ZIP; 258 units permitted in Berks County in 2024 (27 in 5+ unit buildings).
Forward outlook
- In year one you build about $21k of equity ($1k loan paydown + $20k appreciation (10.0% local appreciation)).
- Berks County population projected at +3% by 2050 — modest demand growth; plan on rents tracking national, not racing it.
- At projected returns (10.0% appreciation + 3.0% rent growth), your $56k cash investment doubles in ~3 years — after that, you're playing with house money.
- By year 2, paydown + projected appreciation supports a ~$34k cash-out refi (75% LTV) — recoverable capital for the next deal without selling this one.
Negotiation context
- It's been on market 39 days — a 3% lower offer ($193k) is reasonable based on typical stale-listing flexibility.
- 5 sale attempts since 8y ago; this cycle's ask has dropped $20k (9%) from the opening price — seller is motivated, your offer sets the floor, not the list.
- Current owner paid $124k; list at $199k implies a 61% gain — meaningful room to come down on a strong offer.
Risks & watch-outs
- Watch-outs: built in 1935 — expect roof / HVAC / electrical / plumbing capex.
- Climate carrying-cost: extreme-heat days projected 8→17/yr by 2055 (HVAC capex compounding) — expect insurance premiums to compound above CPI over the hold.
Questions for the listing agent
- It's been on market 39 days. Have you received any prior offers? Is the seller open to a 9% concession, seller financing, or rate buy-down credit?
- Built in 1935 — when were the roof, HVAC, electrical panel, plumbing, and water heater last replaced?
- Is there a deadline driving the sale (1031 exchange, divorce, estate, relocation)? That informs how much negotiation room exists.
- What's the average days-on-market for RENTAL listings here right now (not sales)? A rising rental-DOM trend means longer vacancies and softer asking-rent achievability than the comps imply.
- What's the recent tenant-quality profile in this submarket — average credit score on applications, eviction rate, late-payment / NSF rate, and stable-employment percentage? A property-management company in the area should have these aggregated.
- How much new for-sale + rental construction is in the pipeline within 1–3 miles? Heavy new supply typically softens prices + rents 12–24 months out; constrained supply supports both.
Investment metrics
- 1% rule
- 0.91% ✗
- Cap rate
- 6.93%
- Cash-on-cash
- 2.29%
- DSCR
- 1.10
- GRM
- 9.1
CMA / ARV
- ARV (median comp)
- $263,310
- List price
- $199,000
- Delta
- -19.90%
- Verdict
- UNDERPRICED
- Comps
- 20 within 1.0 mi
Show comp detail 10 sales within ~0.75 mi
| Address | Dist | Beds/Ba | Sqft | Sold | Price | $/sf | Match |
|---|---|---|---|---|---|---|---|
| 250 N 3rd St | 0.07mi | 3/2.0 | 1,316 (+3%) | 9mo | $250,000 | $190 | 80 |
| 305 N 5th St | 0.20mi | 3/1.5 | 1,262 (-1%) | 8mo | $235,000 | $186 | 80 |
| 303 Port Clinton Ave | 0.08mi | 3/1.0 | 1,344 (+5%) | 9mo | $205,500 | $153 | 80 |
| 227 N 4th St | 0.06mi | 3/1.5 | 1,440 (+13%) | 13mo | $241,000 | $167 | 63 |
| 728 Girard Ave | 0.43mi | 3/2.0 | 1,288 (+1%) | 19mo | $260,000 | $202 | 58 |
| 709 N 4th St | 0.53mi | 4/1.0 (+1) | 1,332 (+4%) | 7mo | $281,000 | $211 | 57 |
| 707 N Crescent Ave | 0.52mi | 3/1.0 | 1,120 (-12%) | 6mo | $280,000 | $250 | 51 |
| 522 N Turner St | 0.41mi | 3/1.0 | 1,120 (-12%) | 18mo | $265,000 | $237 | 46 |
| 769 Saint Johns Rd | 0.56mi | 4/2.0 (+1) | 1,196 (-6%) | 12mo | $360,000 | $301 | 45 |
| 23 S 4th St | 0.35mi | 4/1.0 (+1) | 1,454 (+14%) | 15mo | $164,900 | $113 | 42 |
Match score weights: distance 35% · size 25% · config 20% · recency 20%. Top-matched comps best support the ARV.
Projected returns pro-forma
10.0% appreciation · 3.0% rent growth · sell at horizon
- IRR
- 25.9%
- Equity multiple
- 3.07×
- Total profit
- $115,143
- Equity at exit
- $179,275
- IRR
- 22.8%
- Equity multiple
- 6.99×
- Total profit
- $333,756
- Equity at exit
- $386,613
Cash invested: $55,720 (down + closing). Projections, not guarantees.
Landlord ↔ Tenant lean methodology
- Overall (STATE)
- 62 Landlord-Friendly
- State Pennsylvania
- 62 Landlord-Friendly · EVEN
- County
- — inherits STATE
- City
- — inherits STATE
ZIP-level market 19526
- Home prices YoY
- 4.6%
- Active inventory
- 46
- Price-to-rent
- 9.1×
Monthly cashflow live
- Estimated rent
- $1,816 medium interval (Pro) →
- Mortgage (P&I)
- −$1,044
- Tax from tax record
- −$202 /mo · $2,428/yr
- Insurance
- −$83
- HOA
- −$0
- Vacancy / Maint / Mgmt
- −$381
- Net cashflow
- $106
Break-even live
UW: 25.0% down · 7.5% · 30yr · 1.5% tax · 5.0% vac · 8.0% maint · 8.0% mgmt
Financing live
Cash to close
- Down payment
- $49,750
- Closing costs
- $5,970
- Reserves months
- —
- Total cash needed
- —
Loan-product check · same deal, 3 products live
Conventional
25% down · 7.5% · 30yr
- Down + closing
- —
- Monthly P&I
- —
- Monthly cashflow
- —
- DSCR
- —
- Eligible?
- —
Personal DTI + credit; lowest rate.
DSCR
20% down · 8.5% · 30yr
- Down + closing
- —
- Monthly P&I
- —
- Monthly cashflow
- —
- DSCR
- —
- Eligible?
- —
No personal income docs; deal must DSCR.
Hard money
10% down · 12.0% · 12mo
- Down + closing
- —
- Monthly P&I
- —
- Monthly cashflow
- —
- DSCR
- —
- Eligible?
- —
Short-term bridge; refi at stabilization.
Listing history 37 events
-
2026-06-18days on market $199,000 Active 39 DOM
-
2026-06-17price $199,000 Active 38 DOM
-
2026-06-17days on market $210,900 Active 38 DOM
-
2026-06-16days on market $210,900 Active 37 DOM
-
2026-06-15days on market $210,900 Active 36 DOM
-
2026-06-13days on market $210,900 Active 34 DOM
-
2026-06-12days on market $210,900 Active 33 DOM
-
2026-06-09days on market $210,900 Active 30 DOM
-
2026-06-08days on market $210,900 Active 29 DOM
-
2026-06-08days on market $210,900 Active 28 DOM
-
2026-06-07days on market $210,900 Active 27 DOM
-
2026-06-04days on market $210,900 Active 24 DOM
-
2026-06-03price $210,900 Active 23 DOM
-
2026-06-02days on market $219,000 Active 23 DOM
-
2026-06-01days on market $219,000 Active 22 DOM
-
2026-05-31days on market $219,000 Active 21 DOM
-
2026-05-11$219,000 Active 515-char remark
-
2026-05-08historical $219,000 515-char remark
-
2022-05-11historical
-
2022-04-29status Pending
-
2022-04-28status Pending
-
2022-04-28historical
-
2022-03-23price $169,000
-
2022-03-23price $169,000
-
2022-03-09$175,000 Active
-
2022-03-09$175,000 Active
-
2019-06-18soldstatus $123,900
-
2019-06-17soldstatus $123,900 Closed
-
2019-05-13status Pending
-
2019-05-12historical
-
2019-05-06$119,900 Active
-
2018-12-22historical
-
2018-10-31price $114,900
-
2018-10-15price $119,900
-
2018-08-23price $129,900
-
2018-06-05$139,900 Active
-
1994-07-29soldstatus $50,000
ⓘ Source: listings_history table (triggers on properties + properties_extension) + one-shot
backfill from property_details.listing_events for pre-trigger history.
Tax reassessment forecast PA · Partial reset (capped growth)
- Current annual tax
- $2,428 · $202/mo
- Projected year-2 tax
- $2,786 · $232/mo
- Expected delta
- +$358/yr (+$30/mo · 14.7%)
ⓘ Screening estimate from a state-policy table — verify with the county assessor before closing.
Climate risk First Street
- Flood 1/10 Low FEMA zone X (unshaded) · 0% chance over 30 yrs
- Wildfire 1/10 Low
- Heat 5/10 Major 8 d/yr ≥100°F today · 17 d/yr by 30 yrs out
- Wind 4/10 Moderate 10% chance of damaging wind over 30 yrs
- Air quality 2/10 Low 0 unhealthy d/yr today · 1 by 30 yrs out
Nearby sold comps map
Loading sold comps map…
Walkable amenities ~0.75 mi
Loading nearby amenities…
Taxation est. · year 1
- Rental income
- $21,798
- − Mortgage interest
- −$11,147
- − Property taxes
- −$2,428
- − Insurance
- −$995
- − Repairs & maintenance
- −$1,744
- − Management
- −$1,744
- − Depreciation
- −$5,789
- Taxable loss
- −$2,049
- Est. tax savings @ 24.0%
- +$492
- After-tax cash flow
- $1,766/yr
For passive investors: Depreciation is non-cash, so a rental often shows a tax loss while cash-flowing — sheltering income. Rental losses are passive: they offset passive income freely, and up to $25,000/yr can offset ordinary (W-2) income if you actively participate and your MAGI is under $100k (phasing out to $0 by $150k); unused losses carry forward. On sale, claimed depreciation is recaptured at up to 25%, and gains may owe capital-gains tax (a 1031 exchange can defer both). Figures are a year-1 estimate at your 24.0% rate — not tax advice; consult a CPA.
Schools (NCES district)
- District
- Hamburg Area SD
- NCES district ID
- 4211340
- Math proficiency
- 31% ▼ -12.00%
- Reading proficiency
- 43% ▼ -15.00%
- Median HH income
- $55,589
- Composite
- 32.5/100
- National rank
- #5705
- State rank
- #377 of 539 in PA
Livability — Hamburg
- Score
- 74/100
- State rank
- #529
- US rank
- #4893
Category grades
Schools grade is shown separately in the Schools card above.
Census & demographics
- Census place
- Hamburg, PA
- Population (ZIP)
- 11,412
Population outlook (Berks County) Hauer SSP2
- Today (2025)
- 425,767 people
- By 2030
- 428,814 · +0.7%
- By 2040
- 433,463 · +1.8%
- By 2050
- 439,426 · +3.2%
- By 2075
- 478,647 · +12.4%
- By 2100
- 518,507 · +21.8%
Race, ethnicity, and origin ACS 2023
- Neighborhood character
- Predominantly White (90%)
- Race & ethnicity
- White 90% Hispanic / Latino 6% Two or more races 3% Black 1%
- Hispanic origin (detail)
- Puerto Rican 4%
- Common ancestry
- Polish 7% Romanian 4% Iranian 2%
- Foreign-born
- 1% · Canada
- Languages at home
- 97% English-only · Spanish 2% German/W. Germanic 1%
Political lean MEDSL · Berks
- 2024 margin
- R (+12.2) · D 43.4% · R 55.6%
- 2008→2024 swing
- -21.4pp toward R · 2008: 9.2pp · 2024: -12.2pp
- All cycles
- 2024: R+12.2 2020: R+8.2 2016: R+10.2 2012: R+0.6 2008: D+9.2
Not yet ingested
- Civics
- —
Market trends
- HPI YoY
- ▲ 13.13%
- Current HPI
- 299.1168
- Rent YoY
- —
- Metro
- —
- State GDP YoY
- ▲ 1.68%
- F500 in state
- 34
Industry mix (Fortune 500 HQ in PA)
| Industry | F500 HQs | Revenue |
|---|---|---|
| Healthcare | 2 | $309B |
|
||
| Insurance | 2 | $27B |
|
||
| Telecommunications / Media | 1 | $124B |
|
||
| Industrial Distribution | 1 | $22B |
|
||
| Financial Services | 1 | $20B |
|
||
| Chemicals / Materials | 1 | $18B |
|
||
Price history
+298.0% since first listed23 events — show timeline
- 2026-06-17 Price Changed $199,000 BRIGHT MLS
- 2026-06-02 Price Changed $210,900 BRIGHT MLS
- 2026-05-11 Listed $219,000 BRIGHT MLS
- 2026-05-08 Coming Soon $219,000 BRIGHT MLS
- 2022-05-11 Listing Removed — GLVRMLS
- 2022-04-29 Pending — GLVRMLS
- 2022-04-28 Pending — BRIGHT MLS
- 2022-04-28 Listing Removed — BRIGHT MLS
- 2022-03-23 Price Changed $169,000 GLVRMLS
- 2022-03-23 Price Changed $169,000 BRIGHT MLS
- 2022-03-09 Listed $175,000 BRIGHT MLS
- 2022-03-09 Listed $175,000 GLVRMLS
- 2019-06-18 Sold (Public Records) $123,900 Public Records
- 2019-06-17 Sold (MLS) $123,900 BRIGHT MLS
- 2019-05-13 Pending — BRIGHT MLS
- 2019-05-12 Listing Removed — BRIGHT MLS
- 2019-05-06 Listed $119,900 BRIGHT MLS
- 2018-12-22 Listing Removed — BRIGHT MLS
- 2018-10-31 Price Changed $114,900 BRIGHT MLS
- 2018-10-15 Price Changed $119,900 BRIGHT MLS
- 2018-08-23 Price Changed $129,900 BRIGHT MLS
- 2018-06-05 Listed $139,900 BRIGHT MLS
- 1994-07-29 Sold (Public Records) $50,000 Public Records
Property tax history
+1.1%/yrLatest (2026): $2,428 · +0.0% YoY. Source: county tax records.
Cash-flow waterfall
monthlySold comps — $/sqft
last 12 mo · ≤1 miLoading sold comps…