230 Greene St SE · Fairburn, GA
Flood risk 1/10 · Minimal
- FEMA flood zone
- X (unshaded)
- Chance of flooding over 30 yrs
- 0.0%
- Est. flood insurance / yr
- $473 – $860
Fire risk 3/10 · Minor
- Est. fire insurance / yr
- $963 – $1,789
Heat risk 5/10 · Moderate
- Hot days now (above 104°F)
- 7 days/yr
- Hot days in 30 yrs
- 19 days/yr
Wind risk 6/10 · Moderate
- Chance of severe wind over 30 yrs
- 27.0%
Air-quality risk 3/10 · Minor
- Unhealthy air days now
- 3 days/yr
- Unhealthy air days in 30 yrs
- 4 days/yr
Risk factors via First Street. Map © Google.
Why this score? — see what drove the B grade
The composite is a weighted blend of 9 inputs, each scored 0–100. Each bar is that input's sub-score; the figure is the points it added to the 100-point composite (weight × sub-score).
- Cash flow +30.0/30.0
- 1% rule +10.0/10.0
- DSCR +10.0/10.0
- ARV discount +7.5/15.0
- Schools +4.5/10.0
- Livability +3.2/5.0
- Rent growth +3.1/5.0
- Condition / age +2.5/5.0
- Appreciation +0.0/10.0
$90,000
🖨 Deal sheet 📄 Offer letter ✓ Due diligence
Listing remarks MLS
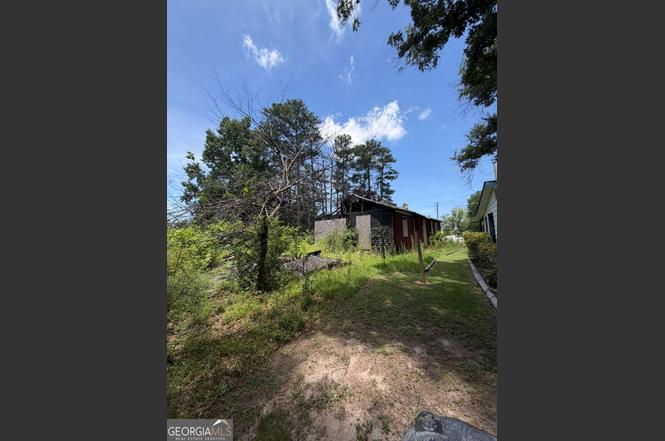
Rare opportunity to create your vision from the ground up! This fire-damaged property offers incredible potential for homeowners looking to build their dream home or investors seeking their next new construction project. Situated on a desirable lot, this property presents the chance to design and construct a custom residence tailored to today's market demands. Ideal for builders, developers, or owner-occupants with renovation or rebuilding experience. Conveniently located near local amenities, schools, and major roadways. **Sold as-is. Buyer to conduct their own due diligence regarding rebuilding requirements, permits, and zoning
Key facts
- Custom residence
- Major roadways
- Local amenities
Tags
Property features AI
Finance
- HOA & community: Community features: Other
Exterior
- Parking: Driveway parking; Open parking available
- Utilities: Public water; Public sewer; Electric: Other; Utilities: Other
- Home design: One level; Fixer condition; Composition roof
- Construction: Construction materials: Other; Foundation: See remarks
- Exterior features: Other exterior features; Other structures
Interior
- Kitchen: No kitchen features listed
- Bedrooms: 2 bedrooms on the main level
- Bathrooms: 1 full bathroom on the main level
- Heating & cooling: Heating: Other; Cooling: Other
- Interior features: One fireplace; No shared/common walls; Attic
- Laundry & utility: No laundry or utility appliances listed
Neighborhood map
What this means for you Summary
Snapshot
- This is a 2-bed/1.0-bath single-family listed at $90k.
Deal economics
- At list price, monthly cash flow is $765 ($9k/yr) — positive.
- The deal already cash-flows at list — no discount required.
- Meets the 1% rule at list price ($2k rent vs $90k).
- Cap rate 16.5% vs local median 4.0% in Fairburn — top-decile yield for the area; either an underpriced asset or a hidden risk that comps aren't pricing in. Stress-test before assuming the spread holds.
Location & tenants
- Location reads 63/100 on livability (#291 in GA) — a middle-class / working-renter tenant base. Strengths: crime A+, cost of living A+, housing A+; Watch: employment C-, amenities F, commute F.
- Fulton County (suburban): math 49% / reading 53% proficiency, ranked #12 of 174 in GA (top 7%) — acceptable for families but not a draw, mixed tenant base, ~2y average lease.
- Zoned schools: Campbell Elementary School (math 27% / reading 22%, grade F, #753 of 1,228 statewide, top 64%, 568 students, 100% FRL); Creekside High School (math 30% / reading 24%, grade F, #160 of 424 statewide, top 38%, 1,768 students, 100% FRL) — zoned schools average 100% FRL vs 41% district-wide (59 pts higher); higher-poverty schools than district average — tighter screening recommended.
- Zoned-school proficiency averages 26% at this address vs 51% district-wide (-25 pts) — the specific schools serving this property underperform the Fulton County average; the district grade overstates school quality for this exact location.
- Market conditions: Rents rising (+2.5%/yr); 531 active listings in the ZIP; 19 comparable units currently listed for rent nearby; rentals at typical pace (median 22d on market — plan ~3-4 weeks tenant-placement turnaround); solid renter incomes; 11,565 units permitted in Fulton County in 2024 (8,159 in 5+ unit buildings).
Forward outlook
- Local home prices are declining (-3.0%/yr); year-one equity from $622 of loan paydown is wiped out by about $3k of value loss. Plan a longer hold.
- Fulton County population projected at +38% by 2050 — long-run rental-demand tailwind backs the buy-and-hold thesis.
- At projected returns (-3.0% appreciation + 2.5% rent growth), your $25k cash investment doubles in ~4 years — after that, you're playing with house money.
Negotiation context
- Only 3 days on market — expect competitive offers; lowballing is unlikely to land.
- 2 sale attempts with the ask held roughly flat each time — persistent listings suggest the price (not the market) is what's stuck; bring a comps-based counter.
Risks & watch-outs
- Watch-outs: built in 1940 — expect roof / HVAC / electrical / plumbing capex.
- Climate carrying-cost: major wind risk, 27% chance of damaging wind over 30y; extreme-heat days projected 7→19/yr by 2055 (HVAC capex compounding) — expect insurance premiums to compound above CPI over the hold.
Questions for the listing agent
- Built in 1940 — when were the roof, HVAC, electrical panel, plumbing, and water heater last replaced?
- Is there a deadline driving the sale (1031 exchange, divorce, estate, relocation)? That informs how much negotiation room exists.
- Schools are F-rated, which usually means shorter tenancies and higher turnover. Who's the typical renter profile here, and what's been the actual vacancy rate?
- What's the average days-on-market for RENTAL listings here right now (not sales)? A rising rental-DOM trend means longer vacancies and softer asking-rent achievability than the comps imply.
- What's the recent tenant-quality profile in this submarket — average credit score on applications, eviction rate, late-payment / NSF rate, and stable-employment percentage? A property-management company in the area should have these aggregated.
- How much new for-sale + rental construction is in the pipeline within 1–3 miles? Heavy new supply typically softens prices + rents 12–24 months out; constrained supply supports both.
Investment metrics
- 1% rule
- 1.82% ✓
- Cap rate
- 16.50%
- Cash-on-cash
- 36.44%
- DSCR
- 2.62
- GRM
- 4.6
CMA / ARV
- ARV (on-the-fly)
- $221,312
- Comps found
- 2
Show comp detail 2 sales within ~0.75 mi
| Address | Dist | Beds/Ba | Sqft | Sold | Price | $/sf | Match |
|---|---|---|---|---|---|---|---|
| 116 Poplar St | 0.66mi | 2/1.0 | 1,080 (+2%) | 13mo | $225,000 | $208 | 56 |
| 96 Greene St NE | 0.62mi | 3/1.5 (+1) | 1,222 (+15%) | 1mo | $219,000 | $179 | 38 |
Match score weights: distance 35% · size 25% · config 20% · recency 20%. Top-matched comps best support the ARV.
Projected returns pro-forma
-3.0% appreciation · 2.53% rent growth · sell at horizon
- IRR
- 31.7%
- Equity multiple
- 2.32×
- Total profit
- $33,354
- Equity at exit
- $13,419
- IRR
- 38.6%
- Equity multiple
- 4.51×
- Total profit
- $88,541
- Equity at exit
- $7,782
Cash invested: $25,200 (down + closing). Projections, not guarantees.
Landlord ↔ Tenant lean methodology
- Overall (STATE)
- 90 Strongly Landlord-Friendly
- State Georgia
- 90 Strongly Landlord-Friendly · R+3
- County
- — inherits STATE
- City
- — inherits STATE
ZIP-level market 30213
- Home prices YoY
- -17.7%
- Rents YoY
- 2.5%
- Active inventory
- 531
- Price-to-rent
- 4.6×
Monthly cashflow live
- Estimated rent
- $1,636 high interval (Pro) →
- Mortgage (P&I)
- −$472
- Tax from tax record
- −$18 /mo · $216/yr
- Insurance
- −$38
- HOA
- −$0
- Vacancy / Maint / Mgmt
- −$344
- Net cashflow
- $765
Break-even live
UW: 25.0% down · 7.5% · 30yr · 1.5% tax · 5.0% vac · 8.0% maint · 8.0% mgmt
Financing live
Cash to close
- Down payment
- $22,500
- Closing costs
- $2,700
- Reserves months
- —
- Total cash needed
- —
Loan-product check · same deal, 3 products live
Conventional
25% down · 7.5% · 30yr
- Down + closing
- —
- Monthly P&I
- —
- Monthly cashflow
- —
- DSCR
- —
- Eligible?
- —
Personal DTI + credit; lowest rate.
DSCR
20% down · 8.5% · 30yr
- Down + closing
- —
- Monthly P&I
- —
- Monthly cashflow
- —
- DSCR
- —
- Eligible?
- —
No personal income docs; deal must DSCR.
Hard money
10% down · 12.0% · 12mo
- Down + closing
- —
- Monthly P&I
- —
- Monthly cashflow
- —
- DSCR
- —
- Eligible?
- —
Short-term bridge; refi at stabilization.
Rent comps 19 comps
| Address | Beds | Baths | Sqft | Rent | $/sqft | DOM | Units | Dist |
|---|---|---|---|---|---|---|---|---|
| 156 SW Malone St Fairburn, GA | 2.0 | 1.0 | 788 | $1,100 | $1.40 | 43d | 1 | 0.58mi |
| 200 Dodd St Fairburn, GA | 3.0 | 2.0 | 1300 | $1,685 | $1.30 | 43d | 1 | 0.84mi |
| 50 Clay St Fairburn, GA | 2.0 | 1.5 | 1138 | $1,473 | $1.29 | 1d | 11 | 0.89mi |
| 227 Bay St SE Unit 227 Fairburn, GA | 2.0 | 1.0 | 1034 | $1,250 | $1.21 | 1d | 1 | 0.89mi |
| 227 Bay St SE Unit 227 Fairburn, GA | 2.0 | 1.0 | 1034 | $1,250 | $1.21 | 22d | 1 | 0.89mi |
| 116 Spring Ct Unit 1 Fairburn, GA | 2.0 | 1.0 | 944 | $1,095 | $1.16 | 43d | 1 | 0.93mi |
| 7305 Village Center Blvd Fairburn, GA | 1.0–3.0 | 1.0–2.0 | 1119 | $1,602 | $1.43 | 1d | 24 | 1.00mi |
| 119 Elder St Unit D Fairburn, GA | 1.0 | 1.0 | 1000 | $1,250 | $1.25 | 22d | 1 | 1.06mi |
| 365 Elder St Fairburn, GA | 3.0 | 2.5 | 1084 | $1,625 | $1.50 | 24d | 1 | 1.20mi |
| 1065 Maple Valley Ct Union City, GA | 3.0 | 2.5 | 1456 | $1,600 | $1.10 | 43d | 1 | 1.25mi |
| 5617 Oakley Industrial Blvd Fairburn, GA | 1.0–3.0 | 1.0–2.5 | 1558 | $3,051 | $1.96 | 1d | 52 | 1.31mi |
| 340 Parkway Rd #340 Union City, GA | 3.0 | 2.5 | 1456 | $1,750 | $1.20 | 3d | 1 | 1.32mi |
| 6045 Capitol Knl Fairburn, GA | 3.0 | 2.5 | 1366 | $1,600 | $1.17 | 43d | 1 | 1.37mi |
| 6540 Capitol Knl Fairburn, GA | 3.0 | 3.5 | 1458 | $1,920 | $1.32 | 5d | 1 | 1.39mi |
| 220 Splitwood Ln Fairburn, GA | 3.0 | 2.0 | 1424 | $1,850 | $1.30 | 20d | 1 | 1.41mi |
| 220 Splitwood Ln Fairburn, GA | 3.0 | 2.0 | 1424 | $1,850 | $1.30 | 43d | 1 | 1.41mi |
| 220 Splitwood Ln Fairburn, GA | 3.0 | 2.0 | 1424 | $1,850 | $1.30 | 5d | 1 | 1.41mi |
| 220 Splitwood Ln Fairburn, GA | 3.0 | 2.0 | 1424 | $1,850 | $1.30 | 24d | 1 | 1.41mi |
| 5300 Highway 138 Union City, GA | 1.0–2.0 | 1.0–2.0 | 990 | $1,350 | $1.36 | 17d | 19 | 1.47mi |
Listing history 4 events
-
2026-06-18days on market $90,000 Active 3 DOM
-
2026-06-17days on market $90,000 Active 2 DOM
-
2026-06-15remarks 640-char remark
Show marketing remark (637 chars)
Rare opportunity to create your vision from the ground up! This fire-damaged property offers incredible potential for homeowners looking to build their dream home or investors seeking their next new construction project. Situated on a desirable lot, this property presents the chance to design and construct a custom residence tailored to today's market demands. Ideal for builders, developers, or owner-occupants with renovation or rebuilding experience. Conveniently located near local amenities, schools, and major roadways. **Sold as-is. Buyer to conduct their own due diligence regarding rebuilding requirements, permits, and zoning
-
2026-06-15$90,000 Active 1 DOM
Show marketing remark (637 chars)
Rare opportunity to create your vision from the ground up! This fire-damaged property offers incredible potential for homeowners looking to build their dream home or investors seeking their next new construction project. Situated on a desirable lot, this property presents the chance to design and construct a custom residence tailored to today's market demands. Ideal for builders, developers, or owner-occupants with renovation or rebuilding experience. Conveniently located near local amenities, schools, and major roadways. **Sold as-is. Buyer to conduct their own due diligence regarding rebuilding requirements, permits, and zoning
ⓘ Source: listings_history table (triggers on properties + properties_extension) + one-shot
backfill from property_details.listing_events for pre-trigger history.
Tax reassessment forecast GA · Resets to sale price
- Current annual tax
- $216 · $18/mo
- Projected year-2 tax
- $828 · $69/mo
- Expected delta
- +$612/yr (+$51/mo · 284.0%)
ⓘ Screening estimate from a state-policy table — verify with the county assessor before closing.
Climate risk First Street
- Flood 1/10 Low FEMA zone X (unshaded) · 0% chance over 30 yrs
- Wildfire 3/10 Moderate
- Heat 5/10 Major 7 d/yr ≥104°F today · 19 d/yr by 30 yrs out
- Wind 6/10 Major 27% chance of damaging wind over 30 yrs
- Air quality 3/10 Moderate 3 unhealthy d/yr today · 4 by 30 yrs out
Nearby sold comps map
Loading sold comps map…
Walkable amenities ~0.75 mi
Loading nearby amenities…
Taxation est. · year 1
- Rental income
- $19,636
- − Mortgage interest
- −$5,041
- − Property taxes
- −$216
- − Insurance
- −$450
- − Repairs & maintenance
- −$1,571
- − Management
- −$1,571
- − Depreciation
- −$2,618
- Taxable income
- $8,169
- Est. tax owed @ 24.0%
- −$1,961
- After-tax cash flow
- $7,223/yr
For passive investors: Depreciation is non-cash, so a rental often shows a tax loss while cash-flowing — sheltering income. Rental losses are passive: they offset passive income freely, and up to $25,000/yr can offset ordinary (W-2) income if you actively participate and your MAGI is under $100k (phasing out to $0 by $150k); unused losses carry forward. On sale, claimed depreciation is recaptured at up to 25%, and gains may owe capital-gains tax (a 1031 exchange can defer both). Figures are a year-1 estimate at your 24.0% rate — not tax advice; consult a CPA.
Schools (NCES district)
- District
- Fulton County
- NCES district ID
- 1302280
- Math proficiency
- 49% ▼ -2.00%
- Reading proficiency
- 53% ▬ 0.00%
- Median HH income
- $68,035
- Composite
- 45.33/100
- National rank
- #2640
- State rank
- #12 of 174 in GA
Livability — Fairburn
- Score
- 63/100
- State rank
- #291
- US rank
- #15939
Category grades
Schools grade is shown separately in the Schools card above.
Census & demographics
- Census place
- Fairburn, GA
- County
- Fulton County · 1,094,430 people
- City population
- 50,621
- Metro
- Atlanta-Sandy Springs-Alpharetta, GA
- Population (ZIP)
- 50,621
- Household income
- $94,125
- Rent vs Own
- Severe rent burden
- 1025.0
Population outlook (Fulton County) Hauer SSP2
- Today (2025)
- 1,203,707 people
- By 2030
- 1,299,706 · +8.0%
- By 2040
- 1,488,256 · +23.6%
- By 2050
- 1,664,580 · +38.3%
- By 2075
- 2,036,072 · +69.2%
- By 2100
- 2,222,402 · +84.6%
Race, ethnicity, and origin ACS 2023
- Neighborhood character
- Predominantly Black (86%)
- Race & ethnicity
- Black 86% White 8% Hispanic / Latino 4% Two or more races 3%
- Common ancestry
- Hispanic 1% Arab 1% Lithuanian 0%
- Foreign-born
- 7% · Canada
- Languages at home
- 91% English-only · Spanish 4% French/Haitian/Cajun 2% Arabic 1%
Political lean MEDSL · Fulton
- 2024 margin
- Solid D (+44.9) · D 71.9% · R 27.0% · Other 1.1%
- 2008→2024 swing
- +9.8pp toward D · 2008: 35.0pp · 2024: 44.9pp
- All cycles
- 2024: D+44.9 2020: D+46.4 2016: D+42.1 2012: D+29.6 2008: D+35.0
Not yet ingested
- Civics
- —
Market trends
- HPI YoY
- ▼ -50.66%
- Current HPI
- 235.9372
- Rent YoY
- ▲ 2.53%
- Metro
- Atlanta-Sandy Springs-Alpharetta, GA
- State GDP YoY
- ▲ 2.66%
- F500 in state
- 28
Industry mix (Fortune 500 HQ in GA)
| Industry | F500 HQs | Revenue |
|---|---|---|
| Paper / Packaging | 2 | $29B |
|
||
| Retail | 1 | $160B |
|
||
| Transportation / Logistics | 1 | $91B |
|
||
| Airlines | 1 | $62B |
|
||
| Consumer Goods | 1 | $47B |
|
||
| Utilities | 1 | $25B |
|
||
Price history
+0.0% since first listed2 events — show timeline
- 2026-06-15 Listed $90,000 GAMLS
- 2026-06-15 Listed $90,000 FMLS
Property tax history
-4.5%/yrLatest (2025): $216 · +3.4% YoY. Source: county tax records.
Cash-flow waterfall
monthlySold comps — $/sqft
last 12 mo · ≤1 miLoading sold comps…