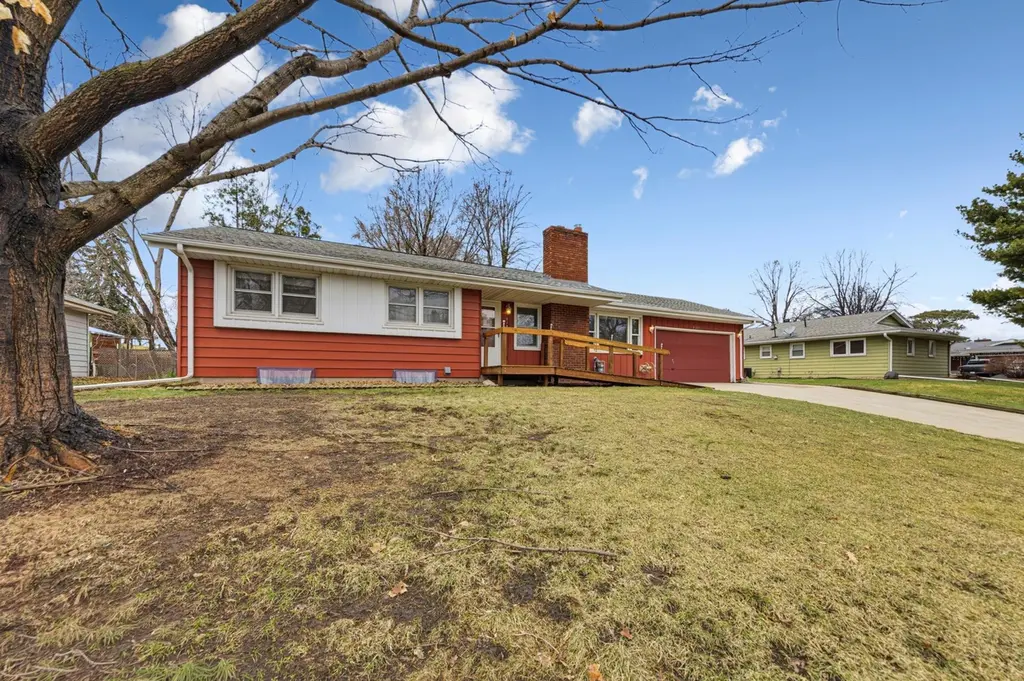
2123 Fox Pl · Mendota Heights, MN
Flood risk 1/10 · Minimal
- FEMA flood zone
- X (unshaded)
- Chance of flooding over 30 yrs
- 0.0%
- Est. flood insurance / yr
- $507 – $1,088
Fire risk 1/10 · Minimal
- Est. fire insurance / yr
- $888 – $1,650
Heat risk 2/10 · Minimal
- Hot days now (above 98°F)
- 7 days/yr
- Hot days in 30 yrs
- 14 days/yr
Wind risk 2/10 · Minimal
- Chance of severe wind over 30 yrs
- —
Air-quality risk 2/10 · Minimal
- Unhealthy air days now
- 1 days/yr
- Unhealthy air days in 30 yrs
- 1 days/yr
Risk factors via First Street. Map © Google.
Why this score? — see what drove the C grade
The composite is a weighted blend of 9 inputs, each scored 0–100. Each bar is that input's sub-score; the figure is the points it added to the 100-point composite (weight × sub-score).
- Cash flow +24.4/30.0
- DSCR +7.9/10.0
- ARV discount +7.5/15.0
- 1% rule +5.8/10.0
- Schools +4.2/10.0
- Livability +4.2/5.0
- Rent growth +2.5/5.0
- Condition / age +2.5/5.0
- Appreciation +0.0/10.0
$325,000
🖨 Deal sheet 📄 Offer letter ✓ Due diligence
Listing remarks
Three bedroom rambler featuring all bedrooms on one level, a primary 3/4 bath, and main level laundry. New HVAC both AC and furnace in 2019, new oven in 2021.
Key facts
- 1,001 sq ft lot
- 2 garage spots
- Built 1956
Property features AI
Finance
- Other: No pool
- Financial info: Mortgages: Other
Exterior
- Parking: Attached 2-car garage
- Utilities: City water connected; City sewer connected; Natural gas; Electric service with circuit breakers (Xcel Energy)
- Home design: Residential property; One story; Main-level primary bedroom; Above- and below-grade finished living areas present
- Construction: Block foundation; Block and steel siding construction; Asphalt roof (age over 8 years)
- Exterior features: Enclosed front and rear porches; Screened porch; Front porch; Rear porch; No fencing; Medium tree coverage on the lot; City street frontage; Publicly maintained road
Interior
- Kitchen: Dishwasher; Garbage disposal; Kitchen window
- Bedrooms: 3 bedrooms (all on the main level)
- Flooring: Hardwood floors
- Bathrooms: Main floor full bathroom; Main floor three-quarter bathroom
- Heating & cooling: Forced air heating; Central air conditioning
- Interior features: Hardwood floors; Kitchen window; Main-floor primary bedroom; Porch; Washer/dryer hookup; Separate/formal dining room; Screened porch; Brick wood-burning fireplace in the living room
- Laundry & utility: Laundry in basement; Laundry in hall; Washer/dryer hookup
Neighborhood map
What this means for you Summary
Snapshot
- This is a 3-bed/2.0-bath single-family listed at $325k.
Deal economics
- At list price, monthly cash flow is $660 ($8k/yr) — positive.
- The deal already cash-flows at list — no discount required.
- Meets the 1% rule at list price ($3k rent vs $325k).
- Recommended offer: $315k (3.0% below list) — sets the bar for market timing.
- Cap rate 8.7% vs local median 1.3% in Mendota Heights — top-decile yield for the area; either an underpriced asset or a hidden risk that comps aren't pricing in. Stress-test before assuming the spread holds.
Location & tenants
- Location reads 84/100 on livability (#26 in MN, #828 nationally) — a professional / high-income tenant draw. Strengths: commute A+, employment A+, housing A+; Watch: amenities F, cost of living F.
- West St. Paul-Mendota Hts.-Eagan (suburban): math 42% / reading 54% proficiency, ranked #125 of 301 in MN (top 42%) — families likely to look elsewhere, expect single-tenant / working-renter base with shorter leases.
- Market conditions: 16 active listings in the ZIP; 3 comparable units currently listed for rent nearby; rentals leasing fast (median 3d on market — plan ~1-2 weeks tenant-placement turnaround); 2,134 units permitted in Dakota County in 2024 (898 in 5+ unit buildings).
Forward outlook
- Local home prices are declining (-3.0%/yr); year-one equity from $2k of loan paydown is wiped out by about $10k of value loss. Plan a longer hold.
- Dakota County population projected at +11% by 2050 — modest demand growth; plan on rents tracking national, not racing it.
Negotiation context
- It's been on market 38 days — a 3% lower offer ($315k) is reasonable based on typical stale-listing flexibility.
Risks & watch-outs
- Watch-outs: built in 1956 — expect roof / HVAC / electrical / plumbing capex.
Questions for the listing agent
- It's been on market 38 days. Have you received any prior offers? Is the seller open to a 3% concession, seller financing, or rate buy-down credit?
- Built in 1956 — when were the roof, HVAC, electrical panel, plumbing, and water heater last replaced?
- Is there a deadline driving the sale (1031 exchange, divorce, estate, relocation)? That informs how much negotiation room exists.
- Schools are A-rated — typically a magnet for longer-tenancy family renters. What's the average tenant stay here, and is there a school-zone premium baked into asking?
- What's the average days-on-market for RENTAL listings here right now (not sales)? A rising rental-DOM trend means longer vacancies and softer asking-rent achievability than the comps imply.
- What's the recent tenant-quality profile in this submarket — average credit score on applications, eviction rate, late-payment / NSF rate, and stable-employment percentage? A property-management company in the area should have these aggregated.
- How much new for-sale + rental construction is in the pipeline within 1–3 miles? Heavy new supply typically softens prices + rents 12–24 months out; constrained supply supports both.
Investment metrics
- 1% rule
- 1.08% ✓
- Cap rate
- 8.73%
- Cash-on-cash
- 8.70%
- DSCR
- 1.39
- GRM
- 7.7
CMA / ARV
No comps found within radius.
Projected returns pro-forma
-3.0% appreciation · 3.0% rent growth · sell at horizon
- IRR
- -3.1%
- Equity multiple
- 0.88×
- Total profit
- $-10,688
- Equity at exit
- $48,459
- IRR
- 6.6%
- Equity multiple
- 1.49×
- Total profit
- $44,649
- Equity at exit
- $28,100
Cash invested: $91,000 (down + closing). Projections, not guarantees.
Landlord ↔ Tenant lean methodology
- Overall (STATE)
- 46 Balanced
- State Minnesota
- 46 Balanced · D+2
- County
- — inherits STATE
- City
- — inherits STATE
ZIP-level market 55120
- Home prices YoY
- -22.3%
- Active inventory
- 16
- Price-to-rent
- 7.7×
Monthly cashflow live
- Estimated rent
- $3,499 medium interval (Pro) →
- Mortgage (P&I)
- −$1,704
- Tax from tax record
- −$265 /mo · $3,176/yr
- Insurance
- −$135
- HOA
- −$0
- Vacancy / Maint / Mgmt
- −$735
- Net cashflow
- $660
Break-even live
UW: 25.0% down · 7.5% · 30yr · 1.5% tax · 5.0% vac · 8.0% maint · 8.0% mgmt
Financing live
Cash to close
- Down payment
- $81,250
- Closing costs
- $9,750
- Reserves months
- —
- Total cash needed
- —
Loan-product check · same deal, 3 products live
Conventional
25% down · 7.5% · 30yr
- Down + closing
- —
- Monthly P&I
- —
- Monthly cashflow
- —
- DSCR
- —
- Eligible?
- —
Personal DTI + credit; lowest rate.
DSCR
20% down · 8.5% · 30yr
- Down + closing
- —
- Monthly P&I
- —
- Monthly cashflow
- —
- DSCR
- —
- Eligible?
- —
No personal income docs; deal must DSCR.
Hard money
10% down · 12.0% · 12mo
- Down + closing
- —
- Monthly P&I
- —
- Monthly cashflow
- —
- DSCR
- —
- Eligible?
- —
Short-term bridge; refi at stabilization.
Rent comps 3 comps
| Address | Beds | Baths | Sqft | Rent | $/sqft | DOM | Units | Dist |
|---|---|---|---|---|---|---|---|---|
| 720 S Plaza Way Saint Paul, MN | 1.0–2.0 | 2.0 | 1102 | $3,795 | $3.44 | 3d | 5 | 0.28mi |
| 725 S Plaza Way Saint Paul, MN | 1.0–2.0 | 2.0 | 1128 | $3,295 | $2.92 | 3d | 5 | 0.31mi |
| 710 Vikings Pkwy Eagan, MN | 1.0–3.0 | 1.0–2.0 | 1259 | $2,995 | $2.38 | 1d | 6 | 1.42mi |
Listing history 6 events
-
2026-05-18status Pending
-
2026-05-05historical Contingent - Inspection
-
2026-05-03price $325,000
-
2026-04-11$349,900 Active
-
2026-03-28price $349,900
-
2026-03-27historical $249,900
ⓘ Source: listings_history table (triggers on properties + properties_extension) + one-shot
backfill from property_details.listing_events for pre-trigger history.
Tax reassessment forecast MN · Partial reset (capped growth)
- Current annual tax
- $3,176 · $265/mo
- Projected year-2 tax
- $3,408 · $284/mo
- Expected delta
- +$232/yr (+$19/mo · 7.3%)
ⓘ Screening estimate from a state-policy table — verify with the county assessor before closing.
Climate risk First Street
- Flood 1/10 Low FEMA zone X (unshaded) · 0% chance over 30 yrs
- Wildfire 1/10 Low
- Heat 2/10 Low 7 d/yr ≥98°F today · 14 d/yr by 30 yrs out
- Wind 2/10 Low
- Air quality 2/10 Low 1 unhealthy d/yr today · 1 by 30 yrs out
Nearby sold comps map
Loading sold comps map…
Walkable amenities ~0.75 mi
Loading nearby amenities…
Taxation est. · year 1
- Rental income
- $41,985
- − Mortgage interest
- −$18,205
- − Property taxes
- −$3,176
- − Insurance
- −$1,625
- − Repairs & maintenance
- −$3,359
- − Management
- −$3,359
- − Depreciation
- −$9,455
- Taxable income
- $2,807
- Est. tax owed @ 24.0%
- −$674
- After-tax cash flow
- $7,242/yr
For passive investors: Depreciation is non-cash, so a rental often shows a tax loss while cash-flowing — sheltering income. Rental losses are passive: they offset passive income freely, and up to $25,000/yr can offset ordinary (W-2) income if you actively participate and your MAGI is under $100k (phasing out to $0 by $150k); unused losses carry forward. On sale, claimed depreciation is recaptured at up to 25%, and gains may owe capital-gains tax (a 1031 exchange can defer both). Figures are a year-1 estimate at your 24.0% rate — not tax advice; consult a CPA.
Schools (NCES district)
- District
- West St. Paul-Mendota Hts.-Eagan
- NCES district ID
- 2742270
- Math proficiency
- 42% ▼ -13.00%
- Reading proficiency
- 54% ▼ -6.00%
- Median HH income
- $63,769
- Composite
- 42.4/100
- National rank
- #3234
- State rank
- #125 of 301 in MN
Livability — Mendota Heights
- Score
- 84/100
- State rank
- #26
- US rank
- #828
Category grades
Schools grade is shown separately in the Schools card above.
Census & demographics
- Census place
- Mendota Heights, MN
- City population
- 5,080
- Population (ZIP)
- 5,080
Population outlook (Dakota County) Hauer SSP2
- Today (2025)
- 450,671 people
- By 2030
- 465,068 · +3.2%
- By 2040
- 486,770 · +8.0%
- By 2050
- 498,743 · +10.7%
- By 2075
- 533,865 · +18.5%
- By 2100
- 550,133 · +22.1%
Race, ethnicity, and origin ACS 2023
- Neighborhood character
- Predominantly White (70%)
- Race & ethnicity
- White 70% Two or more races 18% Asian 7% Hispanic / Latino 5% Black 1%
- Common ancestry
- Portuguese 9% Romanian 4% Scottish 2%
- Foreign-born
- 8% · Vietnam, Canada
- Languages at home
- 89% English-only · Spanish 2% Tagalog/Filipino 2% Vietnamese 1%
Political lean MEDSL · Dakota
- 2024 margin
- D (+12.9) · D 55.4% · R 42.5% · Other 2.1%
- 2008→2024 swing
- +7.4pp toward D · 2008: 5.5pp · 2024: 12.9pp
- All cycles
- 2024: D+12.9 2020: D+13.9 2016: D+4.7 2012: D+2.9 2008: D+5.5
Not yet ingested
- Civics
- —
Market trends
- HPI YoY
- ▼ -64.00%
- Current HPI
- 222.5557
- Rent YoY
- —
- Metro
- —
- State GDP YoY
- ▲ 2.41%
- F500 in state
- 34
Industry mix (Fortune 500 HQ in MN)
| Industry | F500 HQs | Revenue |
|---|---|---|
| Healthcare | 2 | $407B |
|
||
| Retail | 2 | $150B |
|
||
| Consumer Goods | 2 | $32B |
|
||
| Industrial Machinery | 2 | $6B |
|
||
| Agriculture | 1 | $40B |
|
||
| Healthcare / Medical Devices | 1 | $32B |
|
||
Price history
+30.1% since first listed6 events — show timeline
- 2026-05-18 Pending — NORTHSTARMLS as Distributed by MLS Grid
- 2026-05-05 Contingent — NORTHSTARMLS as Distributed by MLS Grid
- 2026-05-03 Price Changed $325,000 NORTHSTARMLS as Distributed by MLS Grid
- 2026-04-11 Listed $349,900 NORTHSTARMLS as Distributed by MLS Grid
- 2026-03-28 Price Changed $349,900 NORTHSTARMLS as Distributed by MLS Grid
- 2026-03-27 Coming Soon $249,900 NORTHSTARMLS as Distributed by MLS Grid
Property tax history
+3.9%/yrLatest (2025): $3,176 · +8.2% YoY. Source: county tax records.
Cash-flow waterfall
monthlySold comps — $/sqft
last 12 mo · ≤1 miLoading sold comps…