5 Kielwasser Rd · New Preston, CT
Flood risk No data
- FEMA flood zone
- —
- Chance of flooding over 30 yrs
- —
- Est. flood insurance / yr
- —
Fire risk No data
- Est. fire insurance / yr
- —
Heat risk No data
- Hot days now (above threshold)
- —
- Hot days in 30 yrs
- —
Wind risk No data
- Chance of severe wind over 30 yrs
- —
Air-quality risk No data
- Unhealthy air days now
- —
- Unhealthy air days in 30 yrs
- —
Risk factors via First Street. Map © Google.
Why this score? — see what drove the B grade
The composite is a weighted blend of 9 inputs, each scored 0–100. Each bar is that input's sub-score; the figure is the points it added to the 100-point composite (weight × sub-score).
- Cash flow +28.6/30.0
- DSCR +10.0/10.0
- ARV discount +7.5/15.0
- 1% rule +6.8/10.0
- Schools +6.3/10.0
- Appreciation +5.1/10.0
- Livability +3.5/5.0
- Rent growth +2.5/5.0
- Condition / age +2.5/5.0
$3,195,000
🖨 Deal sheet 📄 Offer letter ✓ Due diligence
Listing remarks
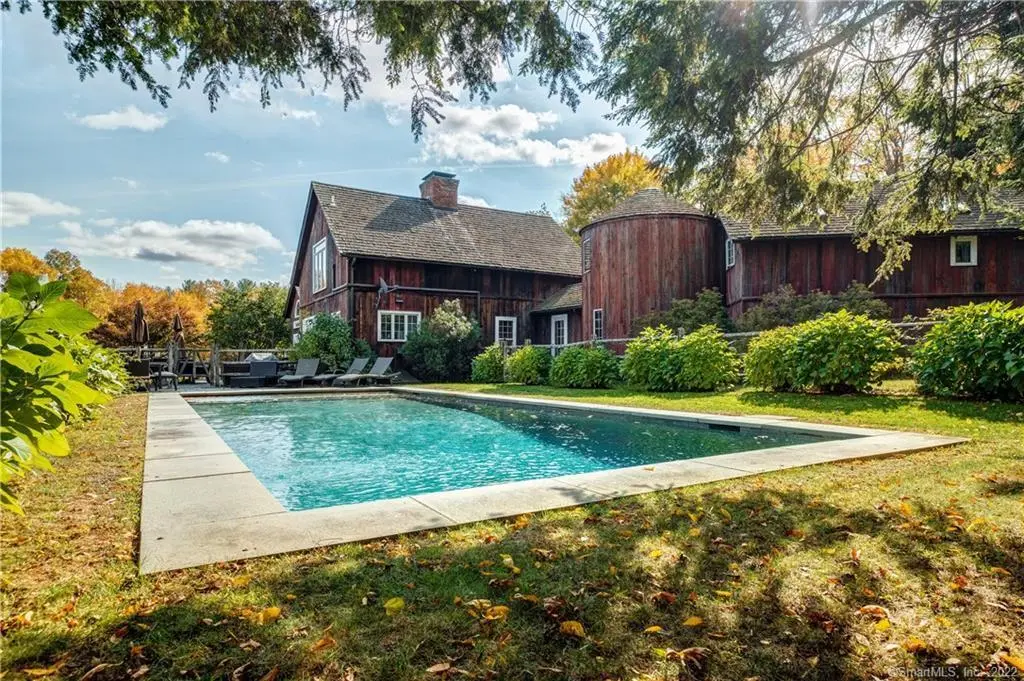
Magical Barn-Style Home composed of 3 Barns and a Silo set on a manicured lawn and apple orchard. The 6-acre hilltop setting with views is fully enclosed by a gated deer fence and is in the heart of the Calhoun Street Historic District adjacent to Averill Farms Orchard. Flagstone Terraces, In-Ground Heated Pool, 60 Apple Trees, Blue Hydrangeas and Nantucket New Dawn Roses. Vaulted Cathedral Barn Ceilings, Exposed Posts and Beams, 5 Woodburning Fireplaces, Chef's Kitchen with Viking Gas Range, Sub-Zero Refrigerator. Currently functions as 5 Bedrooms. Hardwood Floors, Central Air Conditioning, 3-Car Garage. The perfect sophisticated country estate!
Key facts
- 60 apple trees
- Gated deer fence
- Chef's kitchen
Tags
Property features AI
Exterior
- Parking: Attached garage with space for three cars
- Utilities: Private well water; Septic sewage system; Domestic hot water
- Home design: Single-family home
- Construction: Frame construction; Vertical wood siding; Wood siding; Wood shingle roof; Block and concrete foundation
- Exterior features: Open lot; In-ground heated swimming pool
Interior
- Kitchen: Gas cooktop; Gas range; Sub-Zero refrigerator; Icemaker; Dishwasher
- Bedrooms: Three bedrooms
- Bathrooms: Three full bathrooms; One half bathroom
- Heating & cooling: Hot air heating (oil-fired); Above-ground fuel tank; Central air conditioning
- Interior features: Eight total rooms; Full walk-out basement; Five fireplaces; Central air conditioning
- Laundry & utility: Washer and dryer included; Laundry located on lower level
Neighborhood map
What this means for you Summary
Snapshot
- This is a 3-bed/3.5-bath single-family listed at $3.19M.
Deal economics
- At list price, monthly cash flow is $11k ($127k/yr) — positive.
- The deal already cash-flows at list — no discount required.
- Meets the 1% rule at list price ($38k rent vs $3.19M).
- Recommended offer: $3.15M (1.5% below list) — sets the bar for market timing.
- Cap rate 10.3% vs local median 4.0% in New Preston — top-decile yield for the area; either an underpriced asset or a hidden risk that comps aren't pricing in. Stress-test before assuming the spread holds.
Location & tenants
- Location reads 69/100 on livability (#105 in CT) — a middle-class / working-renter tenant base. Strengths: crime A+, employment A+, housing A+; Watch: amenities F, commute F, cost of living F.
- Regional School District 12 (rural): math 64% / reading 77% proficiency, ranked #20 of 153 in CT (top 13%) — strong family-tenant draw, lease renewals of 3-5y typical; only 8% free/reduced lunch — higher-income household profile.
- Market conditions: 15 active listings in the ZIP; 2 comparable units currently listed for rent nearby; 154 units permitted in Northwest Hills Planning Region in 2024 (6 in 5+ unit buildings).
Forward outlook
- In year one you build about $28k of equity ($22k loan paydown + $5k appreciation (0.2% local appreciation)).
- At projected returns (0.2% appreciation + 3.0% rent growth), your $895k cash investment doubles in ~6 years — after that, you're playing with house money.
- By year 6, paydown + projected appreciation supports a ~$186k cash-out refi (75% LTV) — recoverable capital for the next deal without selling this one.
Negotiation context
- It's been on market 19 days — a 2% lower offer ($3.15M) is reasonable based on typical stale-listing flexibility.
- 14 sale attempts since 20y ago with the ask held roughly flat each time — persistent listings suggest the price (not the market) is what's stuck; bring a comps-based counter.
- Current owner paid $1.69M; list at $3.19M implies a 89% gain — meaningful room to come down on a strong offer.
Questions for the listing agent
- Is there a deadline driving the sale (1031 exchange, divorce, estate, relocation)? That informs how much negotiation room exists.
- What's the average days-on-market for RENTAL listings here right now (not sales)? A rising rental-DOM trend means longer vacancies and softer asking-rent achievability than the comps imply.
- What's the recent tenant-quality profile in this submarket — average credit score on applications, eviction rate, late-payment / NSF rate, and stable-employment percentage? A property-management company in the area should have these aggregated.
- How much new for-sale + rental construction is in the pipeline within 1–3 miles? Heavy new supply typically softens prices + rents 12–24 months out; constrained supply supports both.
Investment metrics
- 1% rule
- 1.18% ✓
- Cap rate
- 10.25%
- Cash-on-cash
- 14.14%
- DSCR
- 1.63
- GRM
- 7.1
CMA / ARV
No comps found within radius.
Projected returns pro-forma
0.17% appreciation · 3.0% rent growth · sell at horizon
- IRR
- 13.9%
- Equity multiple
- 1.67×
- Total profit
- $602,470
- Equity at exit
- $954,931
- IRR
- 18.3%
- Equity multiple
- 3.05×
- Total profit
- $1,832,701
- Equity at exit
- $1,169,810
Cash invested: $894,600 (down + closing). Projections, not guarantees.
Landlord ↔ Tenant lean methodology
- Overall (STATE)
- 27 Tenant-Leaning
- State Connecticut
- 27 Tenant-Leaning · D+7
- County
- — inherits STATE
- City
- — inherits STATE
ZIP-level market 06794
- Home prices YoY
- 0.1%
- Active inventory
- 15
- Price-to-rent
- 7.1×
Monthly cashflow live
- Estimated rent
- $37,630 medium interval (Pro) →
- Mortgage (P&I)
- −$16,755
- Tax from tax record
- −$1,097 /mo · $13,167/yr
- Insurance
- −$1,331
- HOA
- −$0
- Vacancy / Maint / Mgmt
- −$7,902
- Net cashflow
- $10,544
Break-even live
UW: 25.0% down · 7.5% · 30yr · 1.5% tax · 5.0% vac · 8.0% maint · 8.0% mgmt
Financing live
Cash to close
- Down payment
- $798,750
- Closing costs
- $95,850
- Reserves months
- —
- Total cash needed
- —
Loan-product check · same deal, 3 products live
Conventional
25% down · 7.5% · 30yr
- Down + closing
- —
- Monthly P&I
- —
- Monthly cashflow
- —
- DSCR
- —
- Eligible?
- —
Personal DTI + credit; lowest rate.
DSCR
20% down · 8.5% · 30yr
- Down + closing
- —
- Monthly P&I
- —
- Monthly cashflow
- —
- DSCR
- —
- Eligible?
- —
No personal income docs; deal must DSCR.
Hard money
10% down · 12.0% · 12mo
- Down + closing
- —
- Monthly P&I
- —
- Monthly cashflow
- —
- DSCR
- —
- Eligible?
- —
Short-term bridge; refi at stabilization.
Rent comps 2 comps
| Address | Beds | Baths | Sqft | Rent | $/sqft | DOM | Units | Dist |
|---|---|---|---|---|---|---|---|---|
| 45 Calhoun St Washington Depot, CT | 3.0 | 3.5 | 4166 | $34,900 | $8.38 | 44d | 1 | 1.21mi |
| 49 Christian St New Preston Marble Dale, CT | 4.0 | 4.0 | 3382 | $40,000 | $11.83 | 44d | 1 | 1.30mi |
Listing history 16 events
-
2026-06-19days on market $3,195,000 Active 19 DOM
-
2026-06-18days on market $3,195,000 Active 18 DOM
-
2026-06-17days on market $3,195,000 Active 17 DOM
-
2026-06-16days on market $3,195,000 Active 16 DOM
-
2026-06-15days on market $3,195,000 Active 15 DOM
-
2026-06-14days on market $3,195,000 Active 13 DOM
-
2026-06-13days on market $3,195,000 Active 12 DOM
-
2026-06-10days on market $3,195,000 Active 10 DOM
-
2026-06-09days on market $3,195,000 Active 9 DOM
-
2026-06-08days on market $3,195,000 Active 8 DOM
-
2026-06-07days on market $3,195,000 Active 7 DOM
-
2026-06-05days on market $3,195,000 Active 4 DOM
-
2026-06-03days on market $3,195,000 Active 3 DOM
-
2026-06-02days on market $3,195,000 Active 2 DOM
-
2026-05-31remarks 654-char remark
-
2026-05-31$3,195,000 Active 1 DOM
ⓘ Source: listings_history table (triggers on properties + properties_extension) + one-shot
backfill from property_details.listing_events for pre-trigger history.
Tax reassessment forecast CT · Partial reset (capped growth)
- Current annual tax
- $13,167 · $1,097/mo
- Projected year-2 tax
- $40,770 · $3,398/mo
- Expected delta
- +$27,603/yr (+$2,300/mo · 209.6%)
ⓘ Screening estimate from a state-policy table — verify with the county assessor before closing.
Nearby sold comps map
Loading sold comps map…
Walkable amenities ~0.75 mi
Loading nearby amenities…
Taxation est. · year 1
- Rental income
- $451,561
- − Mortgage interest
- −$178,970
- − Property taxes
- −$13,167
- − Insurance
- −$15,975
- − Repairs & maintenance
- −$36,125
- − Management
- −$36,125
- − Depreciation
- −$92,945
- Taxable income
- $78,254
- Est. tax owed @ 24.0%
- −$18,781
- After-tax cash flow
- $107,751/yr
For passive investors: Depreciation is non-cash, so a rental often shows a tax loss while cash-flowing — sheltering income. Rental losses are passive: they offset passive income freely, and up to $25,000/yr can offset ordinary (W-2) income if you actively participate and your MAGI is under $100k (phasing out to $0 by $150k); unused losses carry forward. On sale, claimed depreciation is recaptured at up to 25%, and gains may owe capital-gains tax (a 1031 exchange can defer both). Figures are a year-1 estimate at your 24.0% rate — not tax advice; consult a CPA.
Schools (NCES district)
- District
- Regional School District 12
- NCES district ID
- 0903530
- Math proficiency
- 64% ▼ -9.00%
- Reading proficiency
- 77% ▬ 0.00%
- Median HH income
- $86,065
- Composite
- 63.18/100
- National rank
- #638
- State rank
- #20 of 153 in CT
Livability — New Preston
- Score
- 69/100
- State rank
- #105
- US rank
- #9031
Category grades
Schools grade is shown separately in the Schools card above.
Census & demographics
- Census place
- New Preston, CT
- City population
- 1,802
- Population (ZIP)
- 953
Population outlook (Northwest Hills County) Hauer SSP2
- By 2040
- 118,998
Race, ethnicity, and origin ACS 2023
- Neighborhood character
- Predominantly White (75%)
- Race & ethnicity
- White 75% Hispanic / Latino 23% Two or more races 14%
- Hispanic origin (detail)
- Dominican 10%
- Common ancestry
- Lithuanian 7% Romanian 6% Iranian 3%
- Foreign-born
- 20% · Canada
- Languages at home
- 69% English-only · Spanish 26% French/Haitian/Cajun 2% German/W. Germanic 2%
Political lean MEDSL · Northwest Hills
- 2024 margin
- Toss-up / Even · D 48.6% · R 49.9% · Other 1.6%
- All cycles
- 2024: R+1.3
Not yet ingested
- Civics
- —
Market trends
- HPI YoY
- ▲ 0.17%
- Current HPI
- 215.191
- Rent YoY
- —
- Metro
- —
- State GDP YoY
- ▲ 1.06%
- F500 in state
- 38
Industry mix (Fortune 500 HQ in CT)
| Industry | F500 HQs | Revenue |
|---|---|---|
| Industrial Machinery | 4 | $38B |
|
||
| Insurance | 3 | $71B |
|
||
| Financial Services | 2 | $25B |
|
||
| Transportation / Logistics | 2 | $18B |
|
||
| Healthcare | 1 | $247B |
|
||
| Telecommunications | 1 | $55B |
|
||
Price history
+77.5% since first listed30 events — show timeline
- 2026-05-31 Listed $3,195,000 Smart MLS
- 2026-01-03 Listing Removed — Smart MLS
- 2025-11-19 Listed $3,195,000 Smart MLS
- 2024-09-11 Rental Removed $11,900 SMARTMLS
- 2024-09-11 Listing Removed — Smart MLS
- 2024-09-09 Listed $3,195,000 Smart MLS
- 2024-08-19 Price Changed $11,900 SMARTMLS
- 2024-05-31 Listed for Rent $36,900 SMARTMLS
- 2024-03-20 Rental Removed $36,900 SMARTMLS
- 2024-03-20 Listing Removed — Smart MLS
- 2024-02-22 Relisted — Smart MLS
- 2024-01-01 Listed for Rent $36,900 SMARTMLS
- 2024-01-01 Listing Removed — Smart MLS
- 2023-10-15 Relisted — Smart MLS
- 2023-08-30 Rental Removed $36,900 SMARTMLS
- 2023-07-21 Listed for Rent $36,900 SMARTMLS
- 2023-06-02 Listing Removed — Smart MLS
- 2023-01-18 Price Changed $3,295,000 Smart MLS
- 2022-12-07 Relisted — Smart MLS
- 2022-12-07 Listing Removed — Smart MLS
- 2022-10-31 Listed $3,595,000 Smart MLS
- 2012-08-28 Listing Removed — Smart MLS
- 2011-08-02 Listing Removed — Smart MLS
- 2011-03-01 Listed $1,995,000 Smart MLS
- 2011-03-01 Listed $1,995,000 Smart MLS
- 2010-12-01 Listing Removed — Smart MLS
- 2010-02-18 Listed $2,395,000 Smart MLS
- 2007-01-02 Sold (MLS) $1,687,500 Smart MLS
- 2006-12-28 Sold (Public Records) $1,678,500 Public Records
- 2006-05-07 Listed $1,800,000 Smart MLS
Property tax history
+0.6%/yrLatest (2023): $13,167 · +0.6% YoY. Source: county tax records.
Cash-flow waterfall
monthlySold comps — $/sqft
last 12 mo · ≤1 miLoading sold comps…