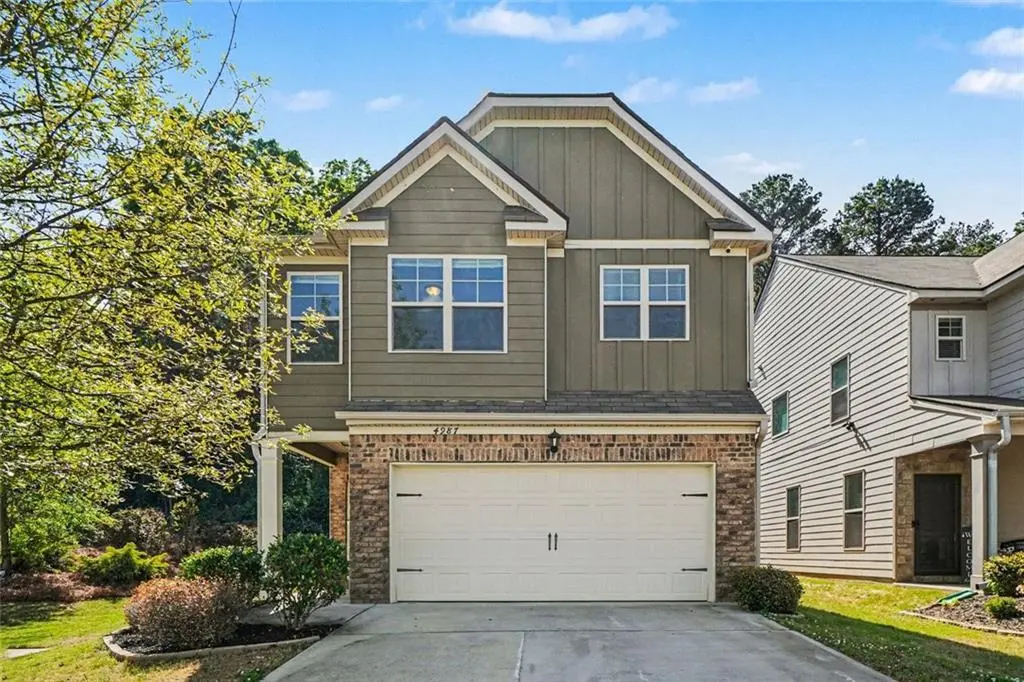
4987 Rapahoe · Union City, GA
Flood risk 1/10 · Minimal
- FEMA flood zone
- X (unshaded)
- Chance of flooding over 30 yrs
- 0.0%
- Est. flood insurance / yr
- $507 – $1,088
Fire risk 3/10 · Minor
- Est. fire insurance / yr
- $963 – $1,789
Heat risk 6/10 · Moderate
- Hot days now (above 104°F)
- 7 days/yr
- Hot days in 30 yrs
- 19 days/yr
Wind risk 6/10 · Moderate
- Chance of severe wind over 30 yrs
- 27.0%
Air-quality risk 3/10 · Minor
- Unhealthy air days now
- 3 days/yr
- Unhealthy air days in 30 yrs
- 4 days/yr
Risk factors via First Street. Map © Google.
Why this score? — see what drove the D grade
The composite is a weighted blend of 9 inputs, each scored 0–100. Each bar is that input's sub-score; the figure is the points it added to the 100-point composite (weight × sub-score).
- Appreciation +10.0/10.0
- Cash flow +7.2/30.0
- ARV discount +6.9/15.0
- Schools +4.5/10.0
- Livability +2.9/5.0
- Rent growth +2.7/5.0
- Condition / age +2.5/5.0
- 1% rule +2.0/10.0
- DSCR +1.4/10.0
$365,000
🖨 Deal sheet (PDF) 📄 Offer letter ✓ Due diligence
Listing remarks MLS
Amazing home with an open concept in Union City. Kitchen features granite counters and stainless appliances and breakfast bar. The very spacious family area has a fireplace and hardwood floors. There is a covered patio and private backyard it is a perfect place for morning coffee or unwinding after a long day. The large primary suite has an ensuite bath with a soaking tub and separate shower and large walk-in closet. Nestled in a quiet neighborhood this home offers all of the comforts and is close to the Atlanta Airport and all other convivences. This is a must see
Key facts
- Spacious family area
- Open concept
- Stainless appliances
Tags
Neighborhood map
What this means for you Summary
Snapshot
- This is a 4-bed/3.5-bath single-family listed at $365k.
Deal economics
- At list price, monthly cash flow is $-498 ($-6k/yr) — negative.
- To cash-flow at today's rent, offer at most $277k (24.1% below list).
- To meet the 1% rule (rent ≥ 1% of price), the offer needs to be $254k (30.5% below list).
- Recommended offer: $254k (30.5% below list) — sets the bar for 1% rule.
Location & tenants
- Location reads 58/100 on livability (#443 in GA) — a working-class tenant base; expect higher turnover. Strengths: cost of living A+, housing A+; Watch: crime D+, amenities F, commute F.
- Fulton County (suburban): math 49% / reading 53% proficiency, ranked #12 of 174 in GA (top 7%) — acceptable for families but not a draw, mixed tenant base, ~2y average lease.
- Zoned schools: Amana Academy School (math 47% / reading 52%, grade D, #264 of 1,228 statewide, top 23%, 731 students, 30% FRL, charter); Camp Creek Middle School (math 17% / reading 32%, grade F, #301 of 470 statewide, top 66%, 644 students, 100% FRL); Westlake High School (math 27% / reading 5%, grade F, #287 of 424 statewide, top 68%, 2,461 students, 43% FRL) — zoned schools average 58% FRL vs 41% district-wide (17 pts higher); higher-poverty schools than district average — tighter screening recommended.
- Zoned-school proficiency averages 30% at this address vs 51% district-wide (-21 pts) — the specific schools serving this property underperform the Fulton County average; the district grade overstates school quality for this exact location.
- Market conditions: Rents flat; 655 active listings in the ZIP; 14 comparable units currently listed for rent nearby; rentals at typical pace (median 26d on market — plan ~3-4 weeks tenant-placement turnaround); 11,565 units permitted in Fulton County in 2024 (8,159 in 5+ unit buildings).
- At $2,538/mo this rent would consume 45% of the median local household income ($67k/yr) (locally 4258% of renters already pay >50% of income on rent) — very limited rent-growth headroom before tenants either downsize or default.
Forward outlook
- In year one you build about $39k of equity ($3k loan paydown + $36k appreciation (10.0% local appreciation)).
- Fulton County population projected at +38% by 2050 — long-run rental-demand tailwind backs the buy-and-hold thesis.
- By year 2, paydown + projected appreciation supports a ~$63k cash-out refi (75% LTV) — recoverable capital for the next deal without selling this one.
Negotiation context
- It's been on market 66 days — a 6% lower offer ($343k) is reasonable based on typical stale-listing flexibility.
- 8 sale attempts since 7y ago with the ask held roughly flat each time — persistent listings suggest the price (not the market) is what's stuck; bring a comps-based counter.
Risks & watch-outs
- Climate carrying-cost: major wind risk, 27% chance of damaging wind over 30y; extreme-heat days projected 7→19/yr by 2055 (HVAC capex compounding) — expect insurance premiums to compound above CPI over the hold.
Questions for the listing agent
- What do current leases actually rent for vs. the listed asking? Can we see a recent rent roll and the last 12 months of T-12 income?
- It's been on market 66 days. Have you received any prior offers? Is the seller open to a 30% concession, seller financing, or rate buy-down credit?
- Why hasn't it sold? Are there any deal-killer items the seller is aware of (foundation, flood, title, zoning, code violations)?
- Is there a deadline driving the sale (1031 exchange, divorce, estate, relocation)? That informs how much negotiation room exists.
- Schools are F-rated, which usually means shorter tenancies and higher turnover. Who's the typical renter profile here, and what's been the actual vacancy rate?
- Crime grade is D in this area — have there been break-ins, vandalism, or insurance claims at this property in the last 3 years? What carrier currently insures it and at what premium?
- The area grade is low — what's the realistic commute time and amenity access for the typical tenant pool here? Any planned neighborhood developments (good or bad) we should know about?
- What's the average days-on-market for RENTAL listings here right now (not sales)? A rising rental-DOM trend means longer vacancies and softer asking-rent achievability than the comps imply.
- What's the recent tenant-quality profile in this submarket — average credit score on applications, eviction rate, late-payment / NSF rate, and stable-employment percentage? A property-management company in the area should have these aggregated.
- How much new for-sale + rental construction is in the pipeline within 1–3 miles? Heavy new supply typically softens prices + rents 12–24 months out; constrained supply supports both.
Investment metrics
- 1% rule
- 0.70% ✗
- Cap rate
- 4.65%
- Cash-on-cash
- -5.85%
- DSCR
- 0.74
- GRM
- 12.0
CMA / ARV
- ARV (median comp)
- $360,075
- List price
- $365,000
- Delta
- 1.37%
- Verdict
- FAIR
- Comps
- 20 within 1.0 mi
Show comp detail 10 sales within ~0.75 mi
| Address | Dist | Beds/Ba | Sqft | Sold | Price | $/sf | Match |
|---|---|---|---|---|---|---|---|
| 564 Dasheill Ln | 0.08mi | 4/2.5 | 2,010 (-2%) | 1mo | $330,000 | $164 | 89 |
| 517 Dasheill Ln | 0.18mi | 4/2.5 | 2,050 (0%) | 10mo | $299,900 | $146 | 79 |
| 5056 Rapahoe Trl | 0.20mi | 3/3.0 (-1) | 2,010 (-2%) | 8mo | $306,000 | $152 | 73 |
| 5113 Rapahoe Trl | 0.24mi | 3/2.5 (-1) | 1,990 (-3%) | 4mo | $300,000 | $151 | 72 |
| 529 Dasheill Ln | 0.16mi | 3/2.5 (-1) | 1,970 (-4%) | 10mo | $325,000 | $165 | 68 |
| 5025 Rapahoe Trl | 0.11mi | 3/2.5 (-1) | 2,027 (-1%) | 20mo | $335,000 | $165 | 68 |
| 4985 Rapahoe Trl | 0.01mi | 3/2.5 (-1) | 1,950 (-5%) | 19mo | $330,000 | $169 | 67 |
| 593 Dasheill Ln | 0.04mi | 3/2.5 (-1) | 1,970 (-4%) | 20mo | $315,000 | $160 | 66 |
| 4947 Rapahoe Trl | 0.17mi | 5/3.0 (+1) | 2,306 (+12%) | 3mo | $320,000 | $139 | 61 |
| 5265 Forest Downs Cir | 0.67mi | 4/2.5 | 2,114 (+3%) | 14mo | $257,000 | $122 | 48 |
Match score weights: distance 35% · size 25% · config 20% · recency 20%. Top-matched comps best support the ARV.
Projected returns pro-forma
10.0% appreciation · 0.95% rent growth · sell at horizon
- IRR
- 19.6%
- Equity multiple
- 2.58×
- Total profit
- $161,954
- Equity at exit
- $328,821
- IRR
- 17.6%
- Equity multiple
- 5.82×
- Total profit
- $492,372
- Equity at exit
- $709,115
Cash invested: $102,200 (down + closing). Projections, not guarantees.
Landlord ↔ Tenant lean methodology
- Overall (STATE)
- 90 Strongly Landlord-Friendly
- State Georgia
- 90 Strongly Landlord-Friendly · R+3
- County
- — inherits STATE
- City
- — inherits STATE
ZIP-level market 30349
- Home prices YoY
- 4.6%
- Rents YoY
- 0.9%
- Active inventory
- 655
- Price-to-rent
- 12.0×
Monthly cashflow live
- Estimated rent
- $2,538 high interval (Pro) →
- Mortgage (P&I)
- −$1,914
- Tax from tax record
- −$437 /mo · $5,240/yr
- Insurance
- −$152
- HOA
- −$0
- Vacancy / Maint / Mgmt
- −$533
- Net cashflow
- $-498
Break-even live
Sensitivity live
| Price | -10% $-292 | -5% $-395 | +0% $-498 | +5% $-602 | +10% $-705 |
|---|---|---|---|---|---|
| Rent | -10% $-699 | -5% $-598 | +0% $-498 | +5% $-398 | +10% $-298 |
| Rate | -1.0pp $-314 | -0.5pp $-405 | base $-498 | +0.5pp $-593 | +1.0pp $-689 |
UW: 25.0% down · 7.5% · 30yr · 1.5% tax · 5.0% vac · 8.0% maint · 8.0% mgmt
Financing live
Cash to close
- Down payment
- $91,250
- Closing costs
- $10,950
- Reserves months
- —
- Total cash needed
- —
Loan-product check · same deal, 3 products live
Conventional
25% down · 7.5% · 30yr
- Down + closing
- —
- Monthly P&I
- —
- Monthly cashflow
- —
- DSCR
- —
- Eligible?
- —
Personal DTI + credit; lowest rate.
DSCR
20% down · 8.5% · 30yr
- Down + closing
- —
- Monthly P&I
- —
- Monthly cashflow
- —
- DSCR
- —
- Eligible?
- —
No personal income docs; deal must DSCR.
Hard money
10% down · 12.0% · 12mo
- Down + closing
- —
- Monthly P&I
- —
- Monthly cashflow
- —
- DSCR
- —
- Eligible?
- —
Short-term bridge; refi at stabilization.
Rent comps 14 comps
| Address | Beds | Baths | Sqft | Rent | $/sqft | DOM | Units | Dist |
|---|---|---|---|---|---|---|---|---|
| 5163 Rapahoe Trl Atlanta, GA | 4.0 | 2.5 | 2060 | $2,525 | $1.23 | 1d | 1 | 0.09mi |
| 4980 Stonewall Tell Rd Atlanta, GA | 3.0 | 2.0 | 1573 | $3,612 | $2.30 | 26d | 1 | 0.13mi |
| 520 Dasheill Ln Atlanta, GA | 4.0 | 2.5 | 2045 | $2,410 | $1.18 | 45d | 1 | 0.15mi |
| 5259 Cantbury Way Atlanta, GA | 4.0 | 2.5 | 2578 | $2,445 | $0.95 | 24d | 1 | 0.21mi |
| 4813 Brookwood Pl Atlanta, GA | 3.0 | 2.5 | 1624 | $2,075 | $1.28 | 45d | 1 | 0.41mi |
| 5131 Forest Downs Ln Atlanta, GA | 4.0 | 2.0 | 2112 | $1,580 | $0.75 | 5d | 1 | 0.50mi |
| 479 Thistle Cv Atlanta, GA | 3.0 | 2.0 | 1694 | $1,785 | $1.05 | 45d | 1 | 0.70mi |
| 5051 Larkspur Ln Atlanta, GA | 3.0 | 2.0 | 1403 | $1,885 | $1.34 | 7d | 1 | 0.79mi |
| 3416 Stonewall Ct Atlanta, GA | 3.0 | 2.5 | 1690 | $2,450 | $1.45 | 26d | 1 | 0.88mi |
| 4812 Station Ln Atlanta, GA | 3.0 | 2.5 | 1695 | $2,100 | $1.24 | 3d | 1 | 0.94mi |
| 5573 Rock Lake Dr Atlanta, GA | 4.0 | 2.5 | 2690 | $2,350 | $0.87 | 26d | 1 | 1.02mi |
| 4595 Blazing Trl Atlanta, GA | 4.0 | 2.5 | 2248 | $2,650 | $1.18 | 45d | 1 | 1.09mi |
| 5480 Sierra Trl Atlanta, GA | 3.0 | 2.5 | 1400 | $1,845 | $1.32 | 45d | 1 | 1.09mi |
| 538 Jadetree Ln Atlanta, GA | 5.0 | 3.0 | 2576 | $2,900 | $1.13 | 3d | 1 | 1.39mi |
Listing history 30 events
-
2026-06-21days on market $365,000 Active 66 DOM
-
2026-06-18days on market $365,000 Active 63 DOM
-
2026-06-17days on market $365,000 Active 62 DOM
-
2026-06-16days on market $365,000 Active 61 DOM
-
2026-06-15days on market $365,000 Active 60 DOM
-
2026-06-13pricedays on market $365,000 Active 58 DOM
-
2026-06-09days on market $369,000 Active 54 DOM
-
2026-06-08days on market $369,000 Active 53 DOM
-
2026-06-07days on market $369,000 Active 52 DOM
-
2026-06-04days on market $369,000 Active 49 DOM
-
2026-06-03days on market $369,000 Active 48 DOM
-
2026-06-01days on market $369,000 Active 46 DOM
-
2026-05-31days on market $369,000 Active 45 DOM
-
2026-04-16$369,000 New 572-char remark
Show marketing remark (572 chars)
Amazing home with an open concept in Union City. Kitchen features granite counters and stainless appliances and breakfast bar. The very spacious family area has a fireplace and hardwood floors. There is a covered patio and private backyard it is a perfect place for morning coffee or unwinding after a long day. The large primary suite has an ensuite bath with a soaking tub and separate shower and large walk-in closet. Nestled in a quiet neighborhood this home offers all of the comforts and is close to the Atlanta Airport and all other convivences. This is a must see
-
2026-04-16$369,000 Active 572-char remark
Show marketing remark (572 chars)
Amazing home with an open concept in Union City. Kitchen features granite counters and stainless appliances and breakfast bar. The very spacious family area has a fireplace and hardwood floors. There is a covered patio and private backyard it is a perfect place for morning coffee or unwinding after a long day. The large primary suite has an ensuite bath with a soaking tub and separate shower and large walk-in closet. Nestled in a quiet neighborhood this home offers all of the comforts and is close to the Atlanta Airport and all other convivences. This is a must see
-
2023-07-24soldstatus $359,900
-
2023-07-14soldstatus $359,900 Sold
-
2023-07-14soldstatus $359,900 Closed
-
2023-06-16status Under Contract
-
2023-06-16status Pending
-
2023-06-07$359,900 New
-
2023-06-07$359,900 Active
-
2019-06-24historical
-
2019-05-21status Back on Market
-
2019-05-16status Active
-
2019-05-16historical
-
2019-04-22status Under Contract
-
2019-04-22status Pending
-
2019-03-25$226,000 Active
-
2019-03-25$226,000 New
ⓘ Source: listings_history table (triggers on properties + properties_extension) + one-shot
backfill from property_details.listing_events for pre-trigger history.
Tax reassessment forecast GA · Resets to sale price
- Current annual tax
- $5,240 · $437/mo
- Projected year-2 tax
- $5,240 · $437/mo
- Expected delta
- $0/yr ($0/mo · 0.0%)
ⓘ Screening estimate from a state-policy table — verify with the county assessor before closing.
Climate risk First Street
- Flood 1/10 Low FEMA zone X (unshaded) · 0% chance over 30 yrs
- Wildfire 3/10 Moderate
- Heat 6/10 Major 7 d/yr ≥104°F today · 19 d/yr by 30 yrs out
- Wind 6/10 Major 27% chance of damaging wind over 30 yrs
- Air quality 3/10 Moderate 3 unhealthy d/yr today · 4 by 30 yrs out
Nearby sold comps map
Loading sold comps map…
Walkable amenities ~0.75 mi
Loading nearby amenities…
Taxation est. · year 1
- Rental income
- $30,450
- − Mortgage interest
- −$20,446
- − Property taxes
- −$5,240
- − Insurance
- −$1,825
- − Repairs & maintenance
- −$2,436
- − Management
- −$2,436
- − Depreciation
- −$10,618
- Taxable loss
- −$12,551
- Est. tax savings @ 24.0%
- +$3,012
- After-tax cash flow
- $-2,966/yr
For passive investors: Depreciation is non-cash, so a rental often shows a tax loss while cash-flowing — sheltering income. Rental losses are passive: they offset passive income freely, and up to $25,000/yr can offset ordinary (W-2) income if you actively participate and your MAGI is under $100k (phasing out to $0 by $150k); unused losses carry forward. On sale, claimed depreciation is recaptured at up to 25%, and gains may owe capital-gains tax (a 1031 exchange can defer both). Figures are a year-1 estimate at your 24.0% rate — not tax advice; consult a CPA.
Schools (NCES district)
- District
- Fulton County
- NCES district ID
- 1302280
- Math proficiency
- 49% ▼ -2.00%
- Reading proficiency
- 53% ▬ 0.00%
- Median HH income
- $68,035
- Composite
- 45.33/100
- National rank
- #2640
- State rank
- #12 of 174 in GA
Livability — Union City
- Score
- 58/100
- State rank
- #443
- US rank
- #21281
Category grades
Schools grade is shown separately in the Schools card above.
Census & demographics
- Census place
- Union City, GA
- County
- Fulton County · 1,094,430 people
- City population
- 25,130
- Metro
- Atlanta-Sandy Springs-Alpharetta, GA
- Population (ZIP)
- 79,872
- Household income
- $67,023
- Rent vs Own
- Severe rent burden
- 4258.0
Population outlook (Fulton County) Hauer SSP2
- Today (2025)
- 1,203,707 people
- By 2030
- 1,299,706 · +8.0%
- By 2040
- 1,488,256 · +23.6%
- By 2050
- 1,664,580 · +38.3%
- By 2075
- 2,036,072 · +69.2%
- By 2100
- 2,222,402 · +84.6%
Race, ethnicity, and origin ACS 2023
- Neighborhood character
- Predominantly Black (89%)
- Race & ethnicity
- Black 89% Hispanic / Latino 5% Two or more races 4% White 3%
- Foreign-born
- 9% · Canada
- Languages at home
- 88% English-only · Spanish 6% French/Haitian/Cajun 1%
Political lean MEDSL · Fulton
- 2024 margin
- Solid D (+44.9) · D 71.9% · R 27.0% · Other 1.1%
- 2008→2024 swing
- +9.8pp toward D · 2008: 35.0pp · 2024: 44.9pp
- All cycles
- 2024: D+44.9 2020: D+46.4 2016: D+42.1 2012: D+29.6 2008: D+35.0
Not yet ingested
- Civics
- —
Market trends
- HPI YoY
- ▲ 18.01%
- Current HPI
- 407.99
- Rent YoY
- ▲ 0.95%
- Metro
- Atlanta-Sandy Springs-Alpharetta, GA
- State GDP YoY
- ▲ 2.66%
- F500 in state
- 28
Industry mix (Fortune 500 HQ in GA)
| Industry | F500 HQs | Revenue |
|---|---|---|
| Paper / Packaging | 2 | $29B |
|
||
| Retail | 1 | $160B |
|
||
| Transportation / Logistics | 1 | $91B |
|
||
| Airlines | 1 | $62B |
|
||
| Consumer Goods | 1 | $47B |
|
||
| Utilities | 1 | $25B |
|
||
Price history
+63.3% since first listed17 events — show timeline
- 2026-04-16 Listed $369,000 FMLS
- 2026-04-16 Listed $369,000 GAMLS
- 2023-07-24 Sold (Public Records) $359,900 Public Records
- 2023-07-14 Sold (MLS) $359,900 FMLS
- 2023-07-14 Sold (MLS) $359,900 GAMLS
- 2023-06-16 Pending — GAMLS
- 2023-06-16 Pending — FMLS
- 2023-06-07 Listed $359,900 FMLS
- 2023-06-07 Listed $359,900 GAMLS
- 2019-06-24 Listing Removed — GAMLS
- 2019-05-21 Relisted — GAMLS
- 2019-05-16 Relisted — FMLS
- 2019-05-16 Listing Removed — FMLS
- 2019-04-22 Pending — GAMLS
- 2019-04-22 Pending — FMLS
- 2019-03-25 Listed $226,000 GAMLS
- 2019-03-25 Listed $226,000 FMLS
Property tax history
+46.9%/yrLatest (2025): $5,240 · +39.4% YoY. Source: county tax records.
Cash-flow waterfall
monthlySold comps — $/sqft
last 12 mo · ≤1 miLoading sold comps…