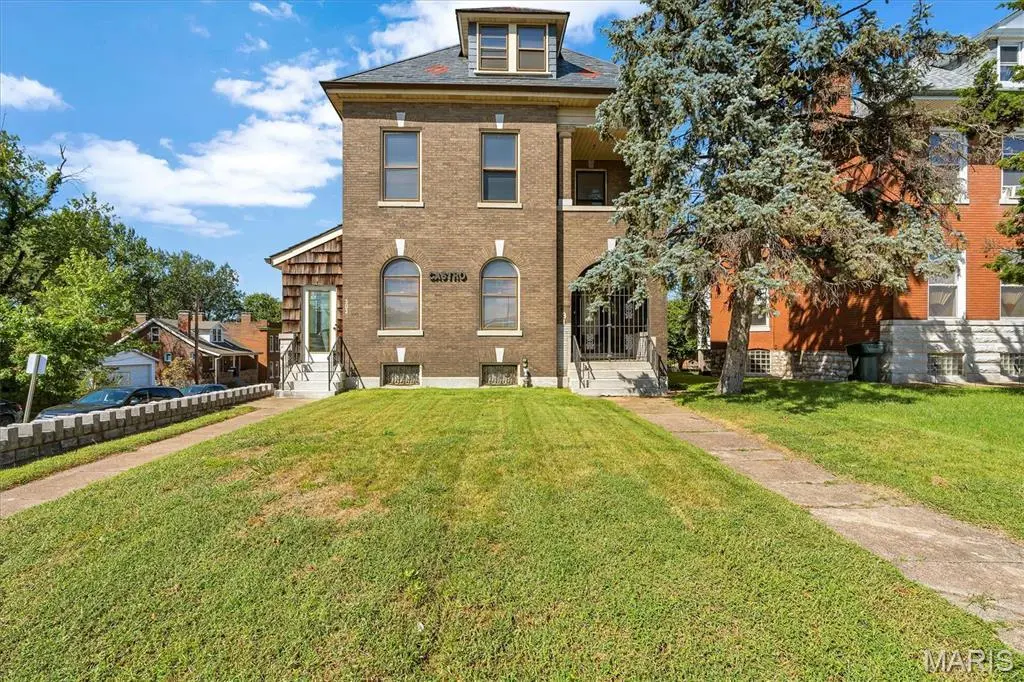
3831 S Grand Blvd · St. Louis, MO
Flood risk No data
- FEMA flood zone
- —
- Chance of flooding over 30 yrs
- —
- Est. flood insurance / yr
- —
Fire risk No data
- Est. fire insurance / yr
- —
Heat risk No data
- Hot days now (above threshold)
- —
- Hot days in 30 yrs
- —
Wind risk No data
- Chance of severe wind over 30 yrs
- —
Air-quality risk No data
- Unhealthy air days now
- —
- Unhealthy air days in 30 yrs
- —
Risk factors via First Street. Map © Google.
Why this score? — see what drove the C grade
The composite is a weighted blend of 9 inputs, each scored 0–100. Each bar is that input's sub-score; the figure is the points it added to the 100-point composite (weight × sub-score).
- Cash flow +22.8/30.0
- ARV discount +13.6/15.0
- DSCR +7.3/10.0
- 1% rule +6.0/10.0
- Rent growth +3.7/5.0
- Livability +2.5/5.0
- Schools +1.2/10.0
- Condition / age +1.0/5.0
- Appreciation +0.0/10.0
$195,000
🖨 Deal sheet 📄 Offer letter ✓ Due diligence
Listing remarks MLS
Duplicate listing of #26005501. Mixed use investment property with Gorgeous Slate Roof! Located on South Grand with high visibility traffic. There are four levels each with separate HVAC system. The first floor has two street front entrances. Live and work in the same place or make it into an investment property. The exterior is in wonderful shape and the slate roof is beautiful and less than 15 years old. Lots of original character, trim work, stained glass, working pocket door and staircase. The interior will need a rehab to fit your needs. Lots of potential just minutes to highways, restaurants and downtown. Motivated Seller! Property to be sold as is, seller to do no inspections, repairs or warranties. Inspections for information purposes, please use Special Sale Contract. Zoned Multi-use.
Key facts
- 5,314 sq ft lot
- Built 1909
- Listed 137 days
Neighborhood map
What this means for you Summary
Snapshot
- This is a 4-bed/2.0-bath single-family listed at $195k. Condition is rated poor.
Deal economics
- At list price, monthly cash flow is $341 ($4k/yr) — positive.
- The deal already cash-flows at list — no discount required.
- Meets the 1% rule at list price ($2k rent vs $195k).
- Recommended offer: $172k (12.0% below list) — sets the bar for market timing.
- Cap rate 8.4% vs local median 5.0% in St. Louis — top-decile yield for the area; either an underpriced asset or a hidden risk that comps aren't pricing in. Stress-test before assuming the spread holds.
Location & tenants
- Location reads: area grade C — affects rentability + tenant quality, not the cash-flow math above.
- St. Louis City (urban): math 10% / reading 18% proficiency, ranked #312 of 324 in MO (top 96%) — low school quality limits family demand, transient renter base, plan for 1-2y turnover; 80% free/reduced lunch — lower-income household profile, screen leases tightly.
- Market conditions: Rents rising fast (+4.9%/yr); 240 active listings in the ZIP; 14 comparable units currently listed for rent nearby; rentals at typical pace (median 16d on market — plan ~3-4 weeks tenant-placement turnaround); 294 units permitted in St. Louis city in 2024 (227 in 5+ unit buildings).
- This rent runs 44% of the median local income ($58k/yr) — at the standard rent-burdened threshold; future hikes will face affordability resistance.
Forward outlook
- Local home prices are declining (-3.0%/yr); year-one equity from $1k of loan paydown is wiped out by about $6k of value loss. Plan a longer hold.
- St. Louis County population projected to shrink 6% by 2050 — rents likely to lag national; underwrite the cash flow, not the appreciation.
- At projected returns (-3.0% appreciation + 4.9% rent growth), your $55k cash investment doubles in ~10 years — after that, you're playing with house money.
Negotiation context
- It's been on market 137 days — a 12% lower offer ($172k) is reasonable based on typical stale-listing flexibility.
- 7 sale attempts since 4y ago with the ask held roughly flat each time — persistent listings suggest the price (not the market) is what's stuck; bring a comps-based counter.
Risks & watch-outs
- Watch-outs: built in 1909 — expect roof / HVAC / electrical / plumbing capex.
Questions for the listing agent
- It's been on market 137 days. Have you received any prior offers? Is the seller open to a 12% concession, seller financing, or rate buy-down credit?
- Have any recent inspections been done? Can we get a copy of the seller's disclosures and any deferred-maintenance estimates?
- Built in 1909 — when were the roof, HVAC, electrical panel, plumbing, and water heater last replaced?
- Why hasn't it sold? Are there any deal-killer items the seller is aware of (foundation, flood, title, zoning, code violations)?
- Is there a deadline driving the sale (1031 exchange, divorce, estate, relocation)? That informs how much negotiation room exists.
- What's the average days-on-market for RENTAL listings here right now (not sales)? A rising rental-DOM trend means longer vacancies and softer asking-rent achievability than the comps imply.
- What's the recent tenant-quality profile in this submarket — average credit score on applications, eviction rate, late-payment / NSF rate, and stable-employment percentage? A property-management company in the area should have these aggregated.
- How much new for-sale + rental construction is in the pipeline within 1–3 miles? Heavy new supply typically softens prices + rents 12–24 months out; constrained supply supports both.
Investment metrics
- 1% rule
- 1.10% ✓
- Cap rate
- 8.39%
- Cash-on-cash
- 7.49%
- DSCR
- 1.33
- GRM
- 7.6
CMA / ARV
- ARV (median comp)
- $225,849
- List price
- $195,000
- Delta
- -13.66%
- Verdict
- UNDERPRICED
- Comps
- 20 within 1.0 mi
Show comp detail 12 sales within ~0.75 mi
| Address | Dist | Beds/Ba | Sqft | Sold | Price | $/sf | Match |
|---|---|---|---|---|---|---|---|
| 3447 Dunnica | 0.14mi | 4/2.5 | 2,232 (-15%) | 1mo | $249,900 | $112 | 66 |
| 3407 Giles | 0.59mi | 5/3.5 (+1) | 2,596 (-1%) | 2mo | $489,900 | $189 | 58 |
| 4118 S Compton Ave | 0.52mi | 4/3.5 | 2,731 (+4%) | 12mo | $99,900 | $37 | 53 |
| 4135 Nebraska Ave | 0.71mi | 4/3.0 | 2,582 (-2%) | 9mo | $224,900 | $87 | 52 |
| 3701 Mcdonald Ave | 0.62mi | 3/2.5 (-1) | 2,586 (-1%) | 11mo | $450,000 | $174 | 52 |
| 3824 Michigan Ave | 0.43mi | 3/2.0 (-1) | 2,340 (-11%) | 6mo | $209,000 | $89 | 52 |
| 2915 Meramec St | 0.71mi | 4/2.0 | 2,538 (-3%) | 11mo | $269,000 | $106 | 52 |
| 3449 Tennessee Ave | 0.49mi | 3/1.5 (-1) | 2,328 (-11%) | 2mo | $280,000 | $120 | 50 |
| 3461 Utah St | 0.71mi | 3/2.5 (-1) | 2,650 (+1%) | 11mo | $527,499 | $199 | 49 |
| 3865 Mcdonald Ave | 0.69mi | 4/2.5 | 2,391 (-9%) | 3mo | $570,000 | $238 | 48 |
| 3547 Nebraska Ave | 0.68mi | 3/2.5 (-1) | 2,396 (-9%) | 4mo | $280,000 | $117 | 43 |
| 3522 S Compton Ave | 0.53mi | 3/2.0 (-1) | 2,306 (-12%) | 10mo | $159,900 | $69 | 42 |
Match score weights: distance 35% · size 25% · config 20% · recency 20%. Top-matched comps best support the ARV.
Projected returns pro-forma
-3.0% appreciation · 4.89% rent growth · sell at horizon
- IRR
- -2.7%
- Equity multiple
- 0.89×
- Total profit
- $-5,734
- Equity at exit
- $29,075
- IRR
- 9.0%
- Equity multiple
- 1.75×
- Total profit
- $40,729
- Equity at exit
- $16,860
Cash invested: $54,600 (down + closing). Projections, not guarantees.
Landlord ↔ Tenant lean methodology
- Overall (STATE)
- 81 Strongly Landlord-Friendly
- State Missouri
- 81 Strongly Landlord-Friendly · R+10
- County
- — inherits STATE
- City
- — inherits STATE
ZIP-level market 63118
- Rents YoY
- 4.9%
- Active inventory
- 240
- Price-to-rent
- 7.6×
Monthly cashflow live
- Estimated rent
- $2,137 high interval (Pro) →
- Mortgage (P&I)
- −$1,023
- Tax est. 1.5%
- −$244 /mo · $2,925/yr
- Insurance
- −$81
- HOA
- −$0
- Vacancy / Maint / Mgmt
- −$449
- Net cashflow
- $341
Break-even live
UW: 25.0% down · 7.5% · 30yr · 1.5% tax · 5.0% vac · 8.0% maint · 8.0% mgmt
Financing live
Cash to close
- Down payment
- $48,750
- Closing costs
- $5,850
- Reserves months
- —
- Total cash needed
- —
Loan-product check · same deal, 3 products live
Conventional
25% down · 7.5% · 30yr
- Down + closing
- —
- Monthly P&I
- —
- Monthly cashflow
- —
- DSCR
- —
- Eligible?
- —
Personal DTI + credit; lowest rate.
DSCR
20% down · 8.5% · 30yr
- Down + closing
- —
- Monthly P&I
- —
- Monthly cashflow
- —
- DSCR
- —
- Eligible?
- —
No personal income docs; deal must DSCR.
Hard money
10% down · 12.0% · 12mo
- Down + closing
- —
- Monthly P&I
- —
- Monthly cashflow
- —
- DSCR
- —
- Eligible?
- —
Short-term bridge; refi at stabilization.
Rent comps 14 comps
| Address | Beds | Baths | Sqft | Rent | $/sqft | DOM | Units | Dist |
|---|---|---|---|---|---|---|---|---|
| 3526 S Spring Ave Saint Louis, MO | 4.0 | 2.0 | 2244 | $2,877 | $1.28 | 43d | 1 | 0.39mi |
| 4222 S 38th St Unit 4222 St. Louis, MO | 3.0 | 2.0 | 1836 | $1,400 | $0.76 | 20d | 1 | 0.45mi |
| 3458 Giles Ave Saint Louis, MO | 3.0 | 2.5 | 2204 | $2,400 | $1.09 | 7d | 1 | 0.46mi |
| 3807 Potomac St Saint Louis, MO | 3.0 | 1.0 | 2588 | $1,300 | $0.50 | 7d | 1 | 0.51mi |
| 3807 Potomac St Saint Louis, MO | 3.0 | 1.0 | 2588 | $1,100 | $0.43 | 43d | 1 | 0.51mi |
| 3540 Michigan Ave Saint Louis, MO | 4.0 | 2.0 | 1758 | $1,800 | $1.02 | 1d | 1 | 0.54mi |
| 4135 S Compton Ave Saint Louis, MO | 3.0 | 2.0 | 2104 | $1,600 | $0.76 | 43d | 1 | 0.54mi |
| 3908 McDonald Ave Saint Louis, MO | 3.0 | 2.0 | 1927 | $2,500 | $1.30 | 4d | 1 | 0.68mi |
| 3510 California Ave Saint Louis, MO | 3.0 | 2.0 | 1800 | $1,200 | $0.67 | 43d | 1 | 0.84mi |
| 4312 Oregon Ave Saint Louis, MO | 4.0 | 2.0 | 2032 | $2,000 | $0.98 | 1d | 1 | 0.93mi |
| 3429 Ohio Ave Saint Louis, MO | 3.0 | 3.0 | 1938 | $2,250 | $1.16 | 16d | 1 | 0.97mi |
| 2643 Wyoming St Saint Louis, MO | 3.0 | 2.5 | 2592 | $2,600 | $1.00 | 43d | 1 | 1.18mi |
| 4145-4147 Hartford St St. Louis, MO | 4.0 | 3.5 | 2400 | $3,800 | $1.58 | 12d | 1 | 1.25mi |
| 3450 Wisconsin Ave Saint Louis, MO | 1.0–3.0 | 1.0–2.0 | 1219 | $2,300 | $1.89 | 1d | 15 | 1.34mi |
Listing history 28 events
-
2026-06-18days on market $195,000 Active 137 DOM
-
2026-06-17days on market $195,000 Active 136 DOM
-
2026-06-16days on market $195,000 Active 135 DOM
-
2026-06-15days on market $195,000 Active 134 DOM
-
2026-06-13days on market $195,000 Active 132 DOM
-
2026-06-09days on market $195,000 Active 128 DOM
-
2026-06-08days on market $195,000 Active 127 DOM
-
2026-06-08days on market $195,000 Active 126 DOM
-
2026-06-05days on market $195,000 Active 123 DOM
-
2026-06-03days on market $195,000 Active 122 DOM
-
2026-06-02days on market $195,000 Active 121 DOM
-
2026-06-01days on market $195,000 Active 120 DOM
-
2026-05-31days on market $195,000 Active 119 DOM
-
2026-05-01status Active 807-char remark
Show marketing remark (807 chars)
Duplicate listing of #26005501. Mixed use investment property with Gorgeous Slate Roof! Located on South Grand with high visibility traffic. There are four levels each with separate HVAC system. The first floor has two street front entrances. Live and work in the same place or make it into an investment property. The exterior is in wonderful shape and the slate roof is beautiful and less than 15 years old. Lots of original character, trim work, stained glass, working pocket door and staircase. The interior will need a rehab to fit your needs. Lots of potential just minutes to highways, restaurants and downtown. Motivated Seller! Property to be sold as is, seller to do no inspections, repairs or warranties. Inspections for information purposes, please use Special Sale Contract. Zoned Multi-use.
-
2026-02-01$195,000 Active 807-char remark
Show marketing remark (807 chars)
Duplicate listing of #26005501. Mixed use investment property with Gorgeous Slate Roof! Located on South Grand with high visibility traffic. There are four levels each with separate HVAC system. The first floor has two street front entrances. Live and work in the same place or make it into an investment property. The exterior is in wonderful shape and the slate roof is beautiful and less than 15 years old. Lots of original character, trim work, stained glass, working pocket door and staircase. The interior will need a rehab to fit your needs. Lots of potential just minutes to highways, restaurants and downtown. Motivated Seller! Property to be sold as is, seller to do no inspections, repairs or warranties. Inspections for information purposes, please use Special Sale Contract. Zoned Multi-use.
-
2026-02-01historical $195,000 807-char remark
Show marketing remark (807 chars)
Duplicate listing of #26005501. Mixed use investment property with Gorgeous Slate Roof! Located on South Grand with high visibility traffic. There are four levels each with separate HVAC system. The first floor has two street front entrances. Live and work in the same place or make it into an investment property. The exterior is in wonderful shape and the slate roof is beautiful and less than 15 years old. Lots of original character, trim work, stained glass, working pocket door and staircase. The interior will need a rehab to fit your needs. Lots of potential just minutes to highways, restaurants and downtown. Motivated Seller! Property to be sold as is, seller to do no inspections, repairs or warranties. Inspections for information purposes, please use Special Sale Contract. Zoned Multi-use.
-
2025-10-18price $200,000
-
2025-08-09price $210,000
-
2024-06-04price $220,500
-
2023-04-13status Active
-
2023-01-11historical Active Under Contract
-
2023-01-11status Active
-
2023-01-11historical
-
2022-05-02status Active
-
2022-05-01historical
-
2022-04-21status Active
-
2022-04-02historical Active Under Contract
-
2022-03-08$245,000 Active
ⓘ Source: listings_history table (triggers on properties + properties_extension) + one-shot
backfill from property_details.listing_events for pre-trigger history.
Nearby sold comps map
Loading sold comps map…
Walkable amenities ~0.75 mi
Loading nearby amenities…
Taxation est. · year 1
- Rental income
- $25,643
- − Mortgage interest
- −$10,923
- − Property taxes
- −$2,925
- − Insurance
- −$975
- − Repairs & maintenance
- −$2,051
- − Management
- −$2,051
- − Depreciation
- −$5,673
- Taxable income
- $1,045
- Est. tax owed @ 24.0%
- −$251
- After-tax cash flow
- $3,836/yr
For passive investors: Depreciation is non-cash, so a rental often shows a tax loss while cash-flowing — sheltering income. Rental losses are passive: they offset passive income freely, and up to $25,000/yr can offset ordinary (W-2) income if you actively participate and your MAGI is under $100k (phasing out to $0 by $150k); unused losses carry forward. On sale, claimed depreciation is recaptured at up to 25%, and gains may owe capital-gains tax (a 1031 exchange can defer both). Figures are a year-1 estimate at your 24.0% rate — not tax advice; consult a CPA.
Condition & rehab AI · 12 photos
This property requires extensive renovations to bring it up to modern standards, but it has a good slate roof and a prime location with high visibility traffic.
Repairs flagged
- Major Exposed plumbing in kitchen — Needs full kitchen renovation
- Major Exposed plumbing in bathroom — Needs full bathroom renovation
- Major Exposed subfloor in kitchen — Needs full kitchen renovation
- Major Exposed subfloor in bathroom — Needs full bathroom renovation
- Major Peeling wallpaper — Needs full interior renovation
Value-add opportunities
- Resale New kitchen and bathroom fixtures — Modernizes the home and improves functionality
- Resale New flooring and cabinets in kitchen — Enhances the home's appeal and functionality
- Resale New paint and wallpaper in interior — Refreshes the home's appearance and creates a more inviting atmosphere
- Both Landscaping and curb appeal improvements — Enhances the home's curb appeal and adds value to the property
Renovation cost estimate screening
| Repair item | Severity | Est. cost |
|---|---|---|
| Exposed plumbing in kitchen · Needs full kitchen renovation | Major | $15,000–50,000 |
| Exposed plumbing in bathroom · Needs full bathroom renovation | Major | $15,000–50,000 |
| Exposed subfloor in kitchen · Needs full kitchen renovation | Major | $15,000–50,000 |
| Exposed subfloor in bathroom · Needs full bathroom renovation | Major | $15,000–50,000 |
| Peeling wallpaper · Needs full interior renovation | Major | $15,000–50,000 |
| Total estimated repair cost · 5 items | $75,000–250,000 |
Value-add ROI direction
- Resale New kitchen and bathroom fixtures — Modernizes the home and improves functionality ↑
- Resale New flooring and cabinets in kitchen — Enhances the home's appeal and functionality ↑
- Resale New paint and wallpaper in interior — Refreshes the home's appearance and creates a more inviting atmosphere ↑
- Both Landscaping and curb appeal improvements — Enhances the home's curb appeal and adds value to the property ↑
ⓘ Cost ranges are severity-bucket heuristics (US national rule-of-thumb). Get contractor quotes + a written scope before underwriting a rehab budget.
Schools (NCES district)
- District
- St. Louis City
- NCES district ID
- 2929280
- Math proficiency
- 10% ▼ -6.00%
- Reading proficiency
- 18% ▼ -3.00%
- Median HH income
- $35,685
- Composite
- 11.54/100
- National rank
- #9699
- State rank
- #312 of 324 in MO
Livability — St. Louis
No livability data for this city. (Only ~50 U.S. cities are tracked.)
Census & demographics
- Census place
- St. Louis, MO
- County
- Saint Louis City · 254,015 people
- City population
- 283,259
- Metro
- St. Louis, MO-IL
- Population (ZIP)
- 25,913
- Household income
- $57,762
- Rent vs Own
- Severe rent burden
- 1495.0
Population outlook (St. Louis County) Hauer SSP2
- Today (2025)
- 315,737 people
- By 2030
- 313,865 · -0.6%
- By 2040
- 305,439 · -3.3%
- By 2050
- 296,529 · -6.1%
- By 2075
- 271,028 · -14.2%
- By 2100
- 255,359 · -19.1%
Race, ethnicity, and origin ACS 2023
- Neighborhood character
- Diverse neighborhood (Simpson 0.63)
- Race & ethnicity
- White 44% Black 41% Two or more races 8% Hispanic / Latino 8% Asian 2%
- Hispanic origin (detail)
- Mexican 6%
- Common ancestry
- Slovak 2% Lithuanian 2% Romanian 2%
- Foreign-born
- 6% · Canada, Vietnam
- Languages at home
- 90% English-only · Spanish 5% Vietnamese 1% French/Haitian/Cajun 1%
Political lean MEDSL · St. Louis
- 2024 margin
- Solid D (+64.7) · D 81.4% · R 16.7% · Other 2.0%
- 2008→2024 swing
- -3.5pp toward R · 2008: 68.2pp · 2024: 64.7pp
- All cycles
- 2024: D+64.7 2020: D+66.2 2016: D+63.7 2012: D+66.6 2008: D+68.2
Not yet ingested
- Civics
- —
Market trends
- HPI YoY
- ▼ -347.51%
- Current HPI
- 171.5963
- Rent YoY
- ▲ 4.89%
- Metro
- St. Louis, MO-IL
- State GDP YoY
- ▲ 1.84%
- F500 in state
- 20
Industry mix (Fortune 500 HQ in MO)
| Industry | F500 HQs | Revenue |
|---|---|---|
| Healthcare | 1 | $163B |
|
||
| Insurance | 1 | $21B |
|
||
| Industrial Technology | 1 | $17B |
|
||
| Retail | 1 | $16B |
|
||
| Industrial Distribution | 1 | $10B |
|
||
| Utilities | 1 | $9B |
|
||
Price history
-20.4% since first listed15 events — show timeline
- 2026-05-01 Relisted — MARIS as Distributed by MLS Grid
- 2026-02-01 Listed $195,000 MARIS as Distributed by MLS Grid
- 2026-02-01 Coming Soon $195,000 MARIS as Distributed by MLS Grid
- 2025-10-18 Price Changed $200,000 MARIS as Distributed by MLS Grid
- 2025-08-09 Price Changed $210,000 MARIS as Distributed by MLS Grid
- 2024-06-04 Price Changed $220,500 MARIS as Distributed by MLS Grid
- 2023-04-13 Relisted — MARIS as Distributed by MLS Grid
- 2023-01-11 Contingent — MARIS as Distributed by MLS Grid
- 2023-01-11 Relisted — MARIS as Distributed by MLS Grid
- 2023-01-11 Delisted — MARIS as Distributed by MLS Grid
- 2022-05-02 Relisted — MARIS as Distributed by MLS Grid
- 2022-05-01 Delisted — MARIS as Distributed by MLS Grid
- 2022-04-21 Relisted — MARIS as Distributed by MLS Grid
- 2022-04-02 Contingent — MARIS as Distributed by MLS Grid
- 2022-03-08 Listed $245,000 MARIS as Distributed by MLS Grid
Cash-flow waterfall
monthlySold comps — $/sqft
last 12 mo · ≤1 miLoading sold comps…