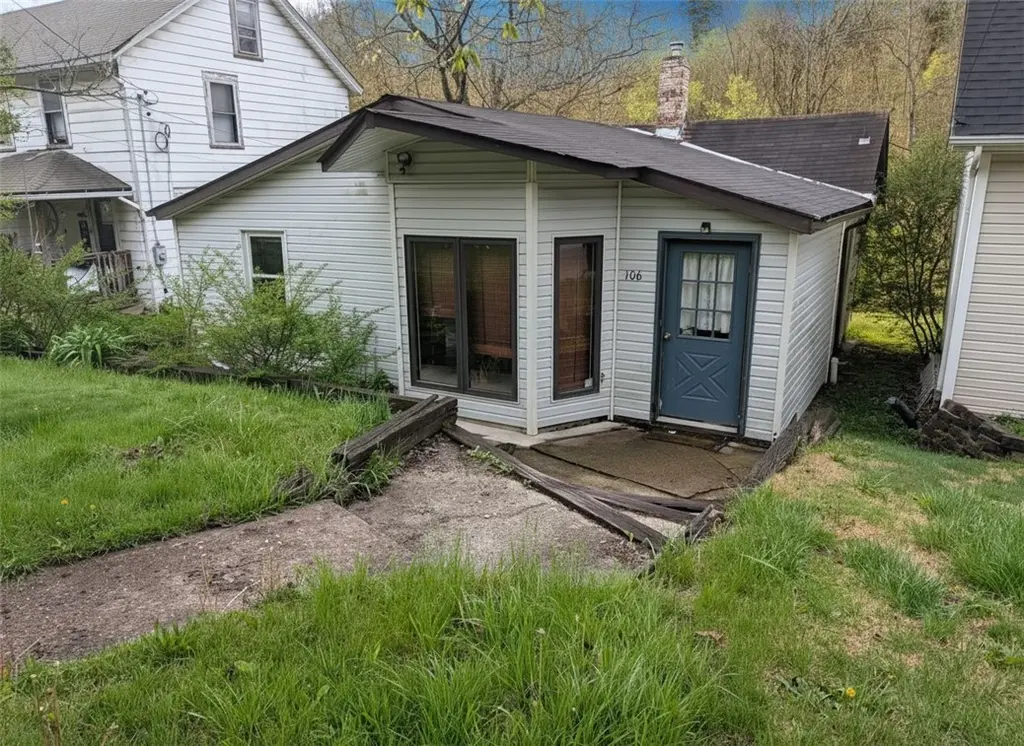
106 Sullivan St · Butler, PA
Flood risk 1/10 · Minimal
- FEMA flood zone
- X (unshaded)
- Chance of flooding over 30 yrs
- 0.0%
- Est. flood insurance / yr
- $473 – $860
Fire risk 1/10 · Minimal
- Est. fire insurance / yr
- $511 – $949
Heat risk 3/10 · Minor
- Hot days now (above 95°F)
- 7 days/yr
- Hot days in 30 yrs
- 16 days/yr
Wind risk 1/10 · Minimal
- Chance of severe wind over 30 yrs
- 0.0%
Air-quality risk 3/10 · Minor
- Unhealthy air days now
- 2 days/yr
- Unhealthy air days in 30 yrs
- 4 days/yr
Risk factors via First Street. Map © Google.
Why this score? — see what drove the A- grade
The composite is a weighted blend of 9 inputs, each scored 0–100. Each bar is that input's sub-score; the figure is the points it added to the 100-point composite (weight × sub-score).
- Cash flow +30.0/30.0
- ARV discount +15.0/15.0
- 1% rule +10.0/10.0
- DSCR +10.0/10.0
- Rent growth +5.0/5.0
- Schools +4.3/10.0
- Livability +3.6/5.0
- Condition / age +2.5/5.0
- Appreciation +0.0/10.0
$50,000
🖨 Deal sheet 📄 Offer letter ✓ Due diligence
Listing remarks MLS
Charming and efficient 2 bed, 1 bath home—perfect for first-time buyers, downsizers, or investors seeking a turnkey rental. Thoughtfully compact layout maximizes space and livability, offering cozy common area and two comfortable bedrooms. Enjoy the convenience of two off-street parking spots and a private backyard ideal for morning coffee, small gatherings, or container gardening. Low-maintenance yard and straightforward floorplan make upkeep easy. Located in a friendly neighborhood with quick access to shops and transit, this home blends affordability and practicality for those ready to own or add to their portfolio.
Key facts
- Low-maintenance yard
- Private backyard
- Off-street parking
Tags
Neighborhood map
What this means for you Summary
Snapshot
- This is a 3-bed/1.0-bath single-family listed at $50k.
Deal economics
- At list price, monthly cash flow is $452 ($5k/yr) — positive.
- The deal already cash-flows at list — no discount required.
- Meets the 1% rule at list price ($1k rent vs $50k).
- Recommended offer: $47k (6.0% below list) — sets the bar for market timing.
- Cap rate 17.1% vs local median 3.8% in Butler — top-decile yield for the area; either an underpriced asset or a hidden risk that comps aren't pricing in. Stress-test before assuming the spread holds.
Location & tenants
- Location reads 71/100 on livability (#705 in PA) — a middle-class / working-renter tenant base. Strengths: cost of living A+, health & safety A+, schools A-; Watch: crime D-, amenities F, commute F.
- Butler Area SD (town): math 41% / reading 59% proficiency, ranked #181 of 539 in PA (top 34%) — acceptable for families but not a draw, mixed tenant base, ~2y average lease.
- Market conditions: Rents rising fast (+20.4%/yr); 206 active listings in the ZIP; 8 comparable units currently listed for rent nearby; rentals at typical pace (median 21d on market — plan ~3-4 weeks tenant-placement turnaround); 987 units permitted in Butler County in 2024 (0 in 5+ unit buildings).
Forward outlook
- Local home prices are declining (-3.0%/yr); year-one equity from $346 of loan paydown is wiped out by about $2k of value loss. Plan a longer hold.
- Butler County population projected to shrink 5% by 2050 — rents likely to lag national; underwrite the cash flow, not the appreciation.
- At projected returns (-3.0% appreciation + 8.0% rent growth), your $14k cash investment doubles in ~3 years — after that, you're playing with house money.
Negotiation context
- It's been on market 62 days — a 6% lower offer ($47k) is reasonable based on typical stale-listing flexibility.
- 2 sale attempts since 25y ago; this cycle's ask has dropped $9k (15%) from the opening price — seller is motivated, your offer sets the floor, not the list.
- Current owner paid $27k; list at $50k implies a 85% gain — meaningful room to come down on a strong offer.
Risks & watch-outs
- Watch-outs: built in 1900 — expect roof / HVAC / electrical / plumbing capex.
Questions for the listing agent
- It's been on market 62 days. Have you received any prior offers? Is the seller open to a 6% concession, seller financing, or rate buy-down credit?
- Built in 1900 — when were the roof, HVAC, electrical panel, plumbing, and water heater last replaced?
- Why hasn't it sold? Are there any deal-killer items the seller is aware of (foundation, flood, title, zoning, code violations)?
- Is there a deadline driving the sale (1031 exchange, divorce, estate, relocation)? That informs how much negotiation room exists.
- Schools are A-rated — typically a magnet for longer-tenancy family renters. What's the average tenant stay here, and is there a school-zone premium baked into asking?
- Crime grade is D in this area — have there been break-ins, vandalism, or insurance claims at this property in the last 3 years? What carrier currently insures it and at what premium?
- What's the average days-on-market for RENTAL listings here right now (not sales)? A rising rental-DOM trend means longer vacancies and softer asking-rent achievability than the comps imply.
- What's the recent tenant-quality profile in this submarket — average credit score on applications, eviction rate, late-payment / NSF rate, and stable-employment percentage? A property-management company in the area should have these aggregated.
- How much new for-sale + rental construction is in the pipeline within 1–3 miles? Heavy new supply typically softens prices + rents 12–24 months out; constrained supply supports both.
Investment metrics
- 1% rule
- 2.04% ✓
- Cap rate
- 17.13%
- Cash-on-cash
- 38.71%
- DSCR
- 2.72
- GRM
- 4.1
CMA / ARV
- ARV (median comp)
- $70,026
- List price
- $50,000
- Delta
- -28.60%
- Verdict
- UNDERPRICED
- Comps
- 15 within 1.0 mi
Show comp detail 5 sales within ~0.75 mi
| Address | Dist | Beds/Ba | Sqft | Sold | Price | $/sf | Match |
|---|---|---|---|---|---|---|---|
| 113 American Ave | 0.48mi | 2/1.0 (-1) | 770 (-1%) | 3mo | $91,000 | $118 | 68 |
| 145 Remil Dr | 0.28mi | 3/1.0 | 720 (-8%) | 7mo | $180,000 | $250 | 68 |
| 117 N 9th Ave | 0.43mi | 2/1.5 (-1) | 768 (-1%) | 8mo | $58,000 | $76 | 64 |
| 120 N 6th Ave | 0.45mi | 2/1.0 (-1) | 700 (-10%) | 12mo | $59,750 | $85 | 47 |
| 107 Remil Dr | 0.49mi | 3/1.0 | 894 (+15%) | 12mo | $110,000 | $123 | 42 |
Match score weights: distance 35% · size 25% · config 20% · recency 20%. Top-matched comps best support the ARV.
Projected returns pro-forma
-3.0% appreciation · 8.0% rent growth · sell at horizon
- IRR
- 40.5%
- Equity multiple
- 2.86×
- Total profit
- $26,061
- Equity at exit
- $7,455
- IRR
- 49.2%
- Equity multiple
- 7.02×
- Total profit
- $84,299
- Equity at exit
- $4,323
Cash invested: $14,000 (down + closing). Projections, not guarantees.
Landlord ↔ Tenant lean methodology
- Overall (STATE)
- 62 Landlord-Friendly
- State Pennsylvania
- 62 Landlord-Friendly · EVEN
- County
- — inherits STATE
- City
- — inherits STATE
ZIP-level market 16001
- Home prices YoY
- -31.7%
- Rents YoY
- 20.4%
- Active inventory
- 206
- Price-to-rent
- 4.1×
Monthly cashflow live
- Estimated rent
- $1,018 high interval (Pro) →
- Mortgage (P&I)
- −$262
- Tax from tax record
- −$70 /mo · $836/yr
- Insurance
- −$21
- HOA
- −$0
- Vacancy / Maint / Mgmt
- −$214
- Net cashflow
- $452
Break-even live
UW: 25.0% down · 7.5% · 30yr · 1.5% tax · 5.0% vac · 8.0% maint · 8.0% mgmt
Financing live
Cash to close
- Down payment
- $12,500
- Closing costs
- $1,500
- Reserves months
- —
- Total cash needed
- —
Loan-product check · same deal, 3 products live
Conventional
25% down · 7.5% · 30yr
- Down + closing
- —
- Monthly P&I
- —
- Monthly cashflow
- —
- DSCR
- —
- Eligible?
- —
Personal DTI + credit; lowest rate.
DSCR
20% down · 8.5% · 30yr
- Down + closing
- —
- Monthly P&I
- —
- Monthly cashflow
- —
- DSCR
- —
- Eligible?
- —
No personal income docs; deal must DSCR.
Hard money
10% down · 12.0% · 12mo
- Down + closing
- —
- Monthly P&I
- —
- Monthly cashflow
- —
- DSCR
- —
- Eligible?
- —
Short-term bridge; refi at stabilization.
Rent comps 8 comps
| Address | Beds | Baths | Sqft | Rent | $/sqft | DOM | Units | Dist |
|---|---|---|---|---|---|---|---|---|
| 305 American Ave Butler, PA | 2.0 | 1.0 | 986 | $995 | $1.01 | 43d | 1 | 0.38mi |
| 529 Federal St Unit 2 Butler, PA | 2.0 | 1.0 | 900 | $850 | $0.94 | 43d | 1 | 0.54mi |
| 313 Wilson Ave Butler, PA | 3.0 | 1.0 | 894 | $1,005 | $1.12 | 16d | 1 | 0.63mi |
| 303 Wilson Ave Unit Wilson-313 Butler, PA | 3.0 | 1.0 | 894 | $1,005 | $1.12 | 16d | 1 | 0.64mi |
| 327 W Brady St Unit 2 Butler, PA | 2.0 | 1.0 | 900 | $850 | $0.94 | 21d | 1 | 0.78mi |
| 404 W Cunningham St Butler, PA | 2.0 | 1.0 | 800 | $850 | $1.06 | 43d | 1 | 0.87mi |
| 530 N Main St Butler, PA | 2.0 | 2.0 | 1052 | $1,088 | $1.03 | 1d | 2 | 0.91mi |
| 139 Whitestown Vlg Unit B Butler, PA | 3.0 | 1.0 | 1000 | $1,100 | $1.10 | 4d | 1 | 1.40mi |
Listing history 17 events
-
2026-06-18days on market $50,000 Active 62 DOM
-
2026-06-17days on market $50,000 Active 61 DOM
-
2026-06-16days on market $50,000 Active 60 DOM
-
2026-06-15days on market $50,000 Active 59 DOM
-
2026-06-13days on market $50,000 Active 57 DOM
-
2026-06-13days on market $50,000 Active 56 DOM
-
2026-06-09days on market $50,000 Active 53 DOM
-
2026-06-08days on market $50,000 Active 52 DOM
-
2026-06-07days on market $50,000 Active 51 DOM
-
2026-06-03days on market $50,000 Active 47 DOM
-
2026-06-02days on market $50,000 Active 46 DOM
-
2026-06-01days on market $50,000 Active 45 DOM
-
2026-05-31days on market $50,000 Active 44 DOM
-
2026-04-29price $50,000 632-char remark
Show marketing remark (632 chars)
Charming and efficient 2 bed, 1 bath home—perfect for first-time buyers, downsizers, or investors seeking a turnkey rental. Thoughtfully compact layout maximizes space and livability, offering cozy common area and two comfortable bedrooms. Enjoy the convenience of two off-street parking spots and a private backyard ideal for morning coffee, small gatherings, or container gardening. Low-maintenance yard and straightforward floorplan make upkeep easy. Located in a friendly neighborhood with quick access to shops and transit, this home blends affordability and practicality for those ready to own or add to their portfolio.
-
2026-04-17$59,000 Active 632-char remark
Show marketing remark (632 chars)
Charming and efficient 2 bed, 1 bath home—perfect for first-time buyers, downsizers, or investors seeking a turnkey rental. Thoughtfully compact layout maximizes space and livability, offering cozy common area and two comfortable bedrooms. Enjoy the convenience of two off-street parking spots and a private backyard ideal for morning coffee, small gatherings, or container gardening. Low-maintenance yard and straightforward floorplan make upkeep easy. Located in a friendly neighborhood with quick access to shops and transit, this home blends affordability and practicality for those ready to own or add to their portfolio.
-
2002-01-23soldstatus $27,000 83-char remark
Show marketing remark (83 chars)
VINYL RANCH WITH BAY WINDOW AND WOODED BACK YARD CUTE HOUSE TO RAISE A SMALL FAMILY
-
2001-09-24$34,900 83-char remark
Show marketing remark (83 chars)
VINYL RANCH WITH BAY WINDOW AND WOODED BACK YARD CUTE HOUSE TO RAISE A SMALL FAMILY
ⓘ Source: listings_history table (triggers on properties + properties_extension) + one-shot
backfill from property_details.listing_events for pre-trigger history.
Tax reassessment forecast PA · Partial reset (capped growth)
- Current annual tax
- $836 · $70/mo
- Projected year-2 tax
- $836 · $70/mo
- Expected delta
- $0/yr ($0/mo · 0.0%)
ⓘ Screening estimate from a state-policy table — verify with the county assessor before closing.
Climate risk First Street
- Flood 1/10 Low FEMA zone X (unshaded) · 0% chance over 30 yrs
- Wildfire 1/10 Low
- Heat 3/10 Moderate 7 d/yr ≥95°F today · 16 d/yr by 30 yrs out
- Wind 1/10 Low 0% chance of damaging wind over 30 yrs
- Air quality 3/10 Moderate 2 unhealthy d/yr today · 4 by 30 yrs out
Nearby sold comps map
Loading sold comps map…
Walkable amenities ~0.75 mi
Loading nearby amenities…
Taxation est. · year 1
- Rental income
- $12,217
- − Mortgage interest
- −$2,801
- − Property taxes
- −$836
- − Insurance
- −$250
- − Repairs & maintenance
- −$977
- − Management
- −$977
- − Depreciation
- −$1,455
- Taxable income
- $4,921
- Est. tax owed @ 24.0%
- −$1,181
- After-tax cash flow
- $4,238/yr
For passive investors: Depreciation is non-cash, so a rental often shows a tax loss while cash-flowing — sheltering income. Rental losses are passive: they offset passive income freely, and up to $25,000/yr can offset ordinary (W-2) income if you actively participate and your MAGI is under $100k (phasing out to $0 by $150k); unused losses carry forward. On sale, claimed depreciation is recaptured at up to 25%, and gains may owe capital-gains tax (a 1031 exchange can defer both). Figures are a year-1 estimate at your 24.0% rate — not tax advice; consult a CPA.
Schools (NCES district)
- District
- Butler Area SD
- NCES district ID
- 4204590
- Math proficiency
- 41% ▼ -11.00%
- Reading proficiency
- 59% ▼ -10.00%
- Median HH income
- $49,348
- Composite
- 42.65/100
- National rank
- #3180
- State rank
- #181 of 539 in PA
Livability — Butler
- Score
- 71/100
- State rank
- #705
- US rank
- #6951
Category grades
Schools grade is shown separately in the Schools card above.
Census & demographics
- Census place
- Butler, PA
- County
- Butler County · 73,107 people
- City population
- 39,234
- Metro
- Pittsburgh, PA
- Population (ZIP)
- 39,234
- Household income
- $63,635
- Rent vs Own
- Severe rent burden
- 1441.0
Population outlook (Butler County) Hauer SSP2
- Today (2025)
- 190,777 people
- By 2030
- 191,476 · +0.4%
- By 2040
- 189,474 · -0.7%
- By 2050
- 182,050 · -4.6%
- By 2075
- 159,526 · -16.4%
- By 2100
- 129,028 · -32.4%
Race, ethnicity, and origin ACS 2023
- Neighborhood character
- Predominantly White (92%)
- Race & ethnicity
- White 92% Two or more races 4% Hispanic / Latino 2% Black 1%
- Common ancestry
- Romanian 8% Serbian 4% Slovak 2%
- Foreign-born
- 1% · Canada
- Languages at home
- 98% English-only · Spanish 1%
Political lean MEDSL · Butler
- 2024 margin
- Solid R (+32.2) · D 33.5% · R 65.7%
- 2008→2024 swing
- -4.8pp toward R · 2008: -27.4pp · 2024: -32.2pp
- All cycles
- 2024: R+32.2 2020: R+32.5 2016: R+37.5 2012: R+34.9 2008: R+27.4
Not yet ingested
- Civics
- —
Market trends
- HPI YoY
- ▼ -103.40%
- Current HPI
- 222.4445
- Rent YoY
- ▲ 20.36%
- Metro
- Pittsburgh, PA
- State GDP YoY
- ▲ 1.68%
- F500 in state
- 34
Industry mix (Fortune 500 HQ in PA)
| Industry | F500 HQs | Revenue |
|---|---|---|
| Healthcare | 2 | $309B |
|
||
| Insurance | 2 | $27B |
|
||
| Telecommunications / Media | 1 | $124B |
|
||
| Industrial Distribution | 1 | $22B |
|
||
| Financial Services | 1 | $20B |
|
||
| Chemicals / Materials | 1 | $18B |
|
||
Price history
+43.3% since first listed4 events — show timeline
- 2026-04-29 Price Changed $50,000 West Penn MLS
- 2026-04-17 Listed $59,000 West Penn MLS
- 2002-01-23 Sold (MLS) $27,000 West Penn MLS
- 2001-09-24 Listed $34,900 West Penn MLS
Property tax history
+0.8%/yrLatest (2026): $836 · -6.3% YoY. Source: county tax records.
Cash-flow waterfall
monthlySold comps — $/sqft
last 12 mo · ≤1 miLoading sold comps…