 Duplex
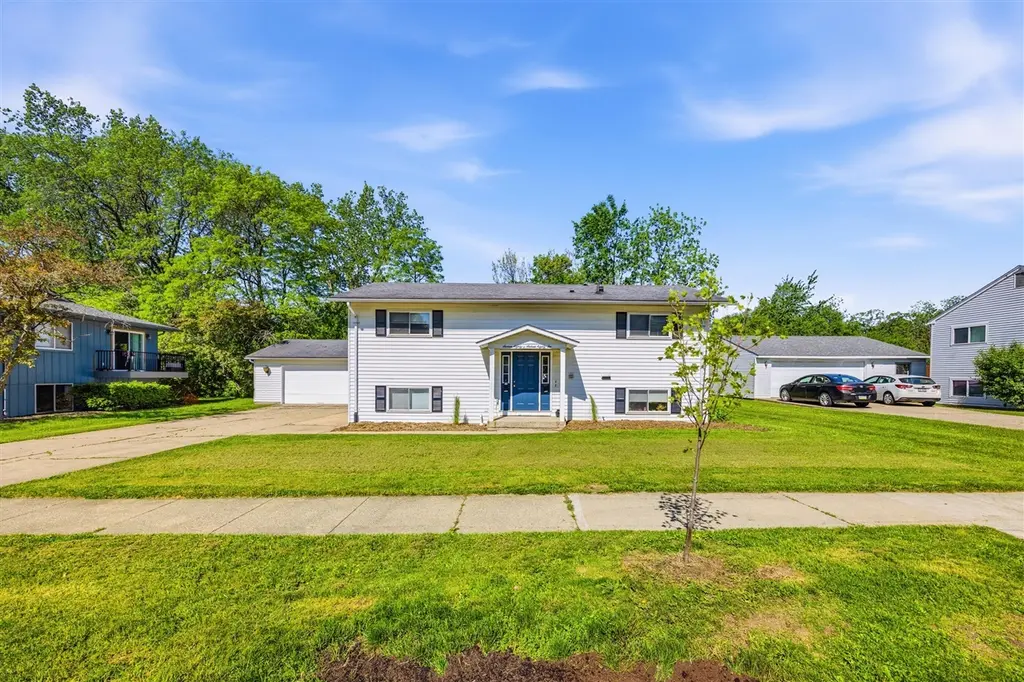
1680 Tudor Dr · Ann Arbor, MI
Flood risk 1/10 · Minimal
- FEMA flood zone
- X (unshaded)
- Chance of flooding over 30 yrs
- 0.0%
- Est. flood insurance / yr
- $507 – $1,088
Fire risk 1/10 · Minimal
- Est. fire insurance / yr
- $784 – $1,456
Heat risk 3/10 · Minor
- Hot days now (above 98°F)
- 7 days/yr
- Hot days in 30 yrs
- 14 days/yr
Wind risk 2/10 · Minimal
- Chance of severe wind over 30 yrs
- —
Air-quality risk 2/10 · Minimal
- Unhealthy air days now
- 1 days/yr
- Unhealthy air days in 30 yrs
- 2 days/yr
Risk factors via First Street. Map © Google.
Why this score? — see what drove the D+ grade
The composite is a weighted blend of 9 inputs, each scored 0–100. Each bar is that input's sub-score; the figure is the points it added to the 100-point composite (weight × sub-score).
- Cash flow +15.6/30.0
- ARV discount +7.5/15.0
- Schools +6.5/10.0
- DSCR +4.8/10.0
- Livability +4.4/5.0
- 1% rule +4.3/10.0
- Rent growth +2.5/5.0
- Condition / age +2.5/5.0
- Appreciation +0.0/10.0
$440,000
🖨 Deal sheet 📄 Offer letter ✓ Due diligence
Multi-family units
County records classify this as Multi-Family (2-4 Unit). Listing-text estimate: 2 units. confirmed
Listing remarks
PRICE IMPROVED- Multi-family home in Ann Arbor, a five minute drive to The Big House and ten to downtown! Both 1680 Tudor & 1682 Tudor included sale. Two units available-both with two bedrooms, full bath, washer and dryer, and appliances. The foyer acts as a common area, with updated carpet and access to the water heaters. Lower unit was renovated two years ago, offering an open floor plan and luxury vinyl plank flooring throughout. Featuring white appliances, and white countertops in the kitchen, plus enough space for an island or added storage. Upper unit updates include new carpet, light fixtures, and fresh paint. Same floor plan as the lower level. Enjoy the balcony overlooking th
Key facts
- 0.27 acre lot
- 2 parking spots
- Built 1971
Property features AI
Finance
- HOA & community: Landlord/association pays electric, trash removal, and water/sewer
Exterior
- Utilities: Water and sewer provided (landlord/association pays); Electric service (landlord/association pays); Trash removal included (landlord/association pays)
- Home design: Multi-Family property; Built in 1971
- Construction: Aluminum exterior; Slab foundation
- Exterior features: Paved street frontage; 87 feet of frontage
Interior
- Heating & cooling: Electric fuel; Baseboard heating
- Interior features: Two-unit multi-family property; One unit currently occupied
Neighborhood map
What this means for you Summary
Snapshot
- This is a 2 × 2-bed/1-bath units multifamily listed at $440k.
Deal economics
- At list price, monthly cash flow is $183 ($2k/yr) — positive. Per door: $91/mo.
- The deal already cash-flows at list — no discount required.
- To meet the 1% rule (rent ≥ 1% of price), the offer needs to be $411k (6.5% below list).
- Recommended offer: $411k (6.5% below list) — sets the bar for 1% rule.
- Cap rate 6.8% vs local median 2.5% in Ann Arbor — top-decile yield for the area; either an underpriced asset or a hidden risk that comps aren't pricing in. Stress-test before assuming the spread holds.
Location & tenants
- Location reads 88/100 on livability (#10 in MI, #155 nationally) — a professional / high-income tenant draw. Strengths: schools A+, amenities A+, commute A+; Watch: cost of living D.
- Ann Arbor Public Schools (urban): math 71% / reading 81% proficiency, ranked #6 of 540 in MI (top 1%) — strong family-tenant draw, lease renewals of 3-5y typical.
- Market conditions: Rents flat; 228 active listings in the ZIP; 9 comparable units currently listed for rent nearby; rentals at typical pace (median 21d on market — plan ~3-4 weeks tenant-placement turnaround); 44% of comp listings sitting > 30 days — soft ceiling on asking rent; high-income renter base; 996 units permitted in Washtenaw County in 2024 (492 in 5+ unit buildings).
- This rent runs 42% of the median local income ($116k/yr) — at the standard rent-burdened threshold; future hikes will face affordability resistance.
Forward outlook
- Local home prices are declining (-3.0%/yr); year-one equity from $3k of loan paydown is wiped out by about $13k of value loss. Plan a longer hold.
- Washtenaw County population projected at +25% by 2050 — long-run rental-demand tailwind backs the buy-and-hold thesis.
Negotiation context
- It's been on market 17 days — a 2% lower offer ($433k) is reasonable based on typical stale-listing flexibility.
- 8 sale attempts since 13y ago; this cycle's ask is 145% above the opening price — seller raised mid-cycle; expect resistance to lowballs.
- Current owner paid $180k; list at $440k implies a 145% gain — meaningful room to come down on a strong offer.
Questions for the listing agent
- Can we see the unit-by-unit rent roll, current vacancy, and any below-market leases? What's the average tenancy length?
- What capital expenditures (roof, boiler, parking lot, exteriors) have been made in the last 5 years, and what's planned in the next 2?
- Built in 1971 — when were the roof, HVAC, electrical panel, plumbing, and water heater last replaced?
- Is there a deadline driving the sale (1031 exchange, divorce, estate, relocation)? That informs how much negotiation room exists.
- Schools are A-rated — typically a magnet for longer-tenancy family renters. What's the average tenant stay here, and is there a school-zone premium baked into asking?
- The area grade is low — what's the realistic commute time and amenity access for the typical tenant pool here? Any planned neighborhood developments (good or bad) we should know about?
- What's the average days-on-market for RENTAL listings here right now (not sales)? A rising rental-DOM trend means longer vacancies and softer asking-rent achievability than the comps imply.
- What's the recent tenant-quality profile in this submarket — average credit score on applications, eviction rate, late-payment / NSF rate, and stable-employment percentage? A property-management company in the area should have these aggregated.
- How much new apartment / multifamily construction is in the pipeline within 1–3 miles? Heavy new supply (>2% of stock underway) typically softens rents 12–24 months out; light construction supports rent growth.
Investment metrics
- 1% rule
- 0.93% ✗
- Cap rate
- 6.79%
- Cash-on-cash
- 1.78%
- DSCR
- 1.08
- GRM
- 8.9
CMA / ARV
No comps found within radius.
Projected returns pro-forma
-3.0% appreciation · 0.12% rent growth · sell at horizon
- IRR
- -16.8%
- Equity multiple
- 0.42×
- Total profit
- $-71,170
- Equity at exit
- $65,605
- IRR
- -15.0%
- Equity multiple
- 0.26×
- Total profit
- $-91,547
- Equity at exit
- $38,043
Cash invested: $123,200 (down + closing). Projections, not guarantees.
Landlord ↔ Tenant lean methodology
- Overall (STATE)
- 62 Landlord-Friendly
- State Michigan
- 62 Landlord-Friendly · EVEN
- County
- — inherits STATE
- City
- — inherits STATE
ZIP-level market 48103
- Rents YoY
- 0.1%
- Active inventory
- 228
- Price-to-rent
- 17.8×
Monthly cashflow live
- Estimated rent
- $4,112 high interval (Pro) →
- Mortgage (P&I)
- −$2,307
- Tax from tax record
- −$575 /mo · $6,901/yr
- Insurance
- −$183
- HOA
- −$0
- Vacancy / Maint / Mgmt
- −$864
- Net cashflow
- $183
Break-even live
2-unit breakdown (identical units grouped — click to expand)
| Units | Beds | Baths | Est. rent |
|---|---|---|---|
| 2× units | 2 | 1 | $4,112 |
| #1 | 2 | 1 | $2,056 |
| #2 | 2 | 1 | $2,056 |
| Total (2 units) | $4,112 | ||
UW: 25.0% down · 7.5% · 30yr · 1.5% tax · 5.0% vac · 8.0% maint · 8.0% mgmt
Financing live
Cash to close
- Down payment
- $110,000
- Closing costs
- $13,200
- Reserves months
- —
- Total cash needed
- —
Loan-product check · same deal, 3 products live
Conventional
25% down · 7.5% · 30yr
- Down + closing
- —
- Monthly P&I
- —
- Monthly cashflow
- —
- DSCR
- —
- Eligible?
- —
Personal DTI + credit; lowest rate.
DSCR
20% down · 8.5% · 30yr
- Down + closing
- —
- Monthly P&I
- —
- Monthly cashflow
- —
- DSCR
- —
- Eligible?
- —
No personal income docs; deal must DSCR.
Hard money
10% down · 12.0% · 12mo
- Down + closing
- —
- Monthly P&I
- —
- Monthly cashflow
- —
- DSCR
- —
- Eligible?
- —
Short-term bridge; refi at stabilization.
Rent comps 9 comps
| Address | Beds | Baths | Sqft | Rent | $/sqft | DOM | Units | Dist |
|---|---|---|---|---|---|---|---|---|
| 2802 Green Valley Dr Ann Arbor, MI | 3.0 | 2.5 | 2262 | $3,200 | $1.41 | 21d | 1 | 0.86mi |
| 1848 Arbordale St Ann Arbor, MI | 4.0 | 3.5 | 1959 | $3,150 | $1.61 | 13d | 1 | 0.89mi |
| 3234 Chamberlain Cir Unit 3234 Ann Arbor, MI | 3.0 | 3.0 | 2400 | $2,995 | $1.25 | 43d | 1 | 0.91mi |
| 3234 Chamberlain Cir Unit 3234 Ann Arbor, MI | 3.0 | 3.0 | 2400 | $2,995 | $1.25 | 21d | 1 | 0.91mi |
| 856 W Summerfield Glen Cir Unit 2 Ann Arbor, MI | 3.0 | 2.0 | 1412 | $2,200 | $1.56 | 43d | 1 | 0.95mi |
| 854 W Summerfield Glen Cir Unit 2 Ann Arbor, MI | 3.0 | 2.0 | 1412 | $2,200 | $1.56 | 43d | 1 | 0.95mi |
| 815 Hewett Dr Ann Arbor, MI | 4.0 | 2.5 | 2500 | $3,000 | $1.20 | 43d | 1 | 1.18mi |
| 243 Fieldcrest St Ann Arbor, MI | 3.0 | 4.0 | 1747 | $2,995 | $1.71 | 21d | 1 | 1.37mi |
| 3300 Ann Arbor Saline Rd Ann Arbor, MI | 1.0–3.0 | 1.0–2.0 | 1156 | $3,137 | $2.71 | 13d | 5 | 1.41mi |
Listing history 36 events
-
2026-06-18days on market $440,000 Active 17 DOM
-
2026-06-17days on market $440,000 Active 16 DOM
-
2026-06-16days on market $440,000 Active 15 DOM
-
2026-06-15pricedays on market $440,000 Active 14 DOM
-
2026-06-14days on market $450,000 Active 12 DOM
-
2026-06-10days on market $450,000 Active 9 DOM
-
2026-06-09days on market $450,000 Active 8 DOM
-
2026-06-08days on market $450,000 Active 7 DOM
-
2026-06-07days on market $450,000 Active 6 DOM
-
2026-06-03days on market $450,000 Active 2 DOM
-
2026-06-01statusdays on market $450,000 Active 1 DOM
-
2026-05-31days on market $450,000 Coming Soon 2 DOM
-
2026-05-29historical $450,000
-
2013-05-17historical
-
2013-05-17soldstatus $179,900
-
2013-05-17historical
-
2013-05-17soldstatus $179,900
-
2013-05-17soldstatus $179,900
-
2013-05-07soldstatus $179,900
-
2013-05-06soldstatus $179,900
-
2013-05-06soldstatus $179,900
-
2013-05-06soldstatus $179,900
-
2013-04-13historical
-
2013-04-13historical
-
2013-04-13historical
-
2013-04-13historical
-
2013-04-09$379,900
-
2013-04-09$179,900
-
2013-04-09
-
2013-04-09$179,900
-
2013-04-09$179,900
-
2013-04-08$179,900
-
2013-04-08$179,900
-
2013-04-08$179,900
-
1995-03-16soldstatus $124,000
-
1995-03-16soldstatus $124,000
ⓘ Source: listings_history table (triggers on properties + properties_extension) + one-shot
backfill from property_details.listing_events for pre-trigger history.
Tax reassessment forecast MI · Partial reset (capped growth)
- Current annual tax
- $6,901 · $575/mo
- Projected year-2 tax
- $6,901 · $575/mo
- Expected delta
- $0/yr ($0/mo · 0.0%)
ⓘ Screening estimate from a state-policy table — verify with the county assessor before closing.
Climate risk First Street
- Flood 1/10 Low FEMA zone X (unshaded) · 0% chance over 30 yrs
- Wildfire 1/10 Low
- Heat 3/10 Moderate 7 d/yr ≥98°F today · 14 d/yr by 30 yrs out
- Wind 2/10 Low
- Air quality 2/10 Low 1 unhealthy d/yr today · 2 by 30 yrs out
Nearby sold comps map
Loading sold comps map…
Walkable amenities ~0.75 mi
Loading nearby amenities…
Taxation est. · year 1
- Rental income
- $49,344
- − Mortgage interest
- −$24,647
- − Property taxes
- −$6,901
- − Insurance
- −$2,200
- − Repairs & maintenance
- −$3,948
- − Management
- −$3,948
- − Depreciation
- −$12,800
- Taxable loss
- −$5,099
- Est. tax savings @ 24.0%
- +$1,224
- After-tax cash flow
- $3,416/yr
For passive investors: Depreciation is non-cash, so a rental often shows a tax loss while cash-flowing — sheltering income. Rental losses are passive: they offset passive income freely, and up to $25,000/yr can offset ordinary (W-2) income if you actively participate and your MAGI is under $100k (phasing out to $0 by $150k); unused losses carry forward. On sale, claimed depreciation is recaptured at up to 25%, and gains may owe capital-gains tax (a 1031 exchange can defer both). Figures are a year-1 estimate at your 24.0% rate — not tax advice; consult a CPA.
Schools (NCES district)
- District
- Ann Arbor Public Schools
- NCES district ID
- 2602820
- Math proficiency
- 71% ▲ 5.00%
- Reading proficiency
- 81% ▲ 11.00%
- Median HH income
- $60,768
- Composite
- 65.34/100
- National rank
- #487
- State rank
- #6 of 540 in MI
Livability — Ann Arbor
- Score
- 88/100
- State rank
- #10
- US rank
- #155
Category grades
Schools grade is shown separately in the Schools card above.
Census & demographics
- Census place
- Ann Arbor, MI
- County
- Washtenaw County · 306,860 people
- City population
- 163,747
- Metro
- Ann Arbor, MI
- Population (ZIP)
- 55,054
- Household income
- $116,194
- Rent vs Own
- Severe rent burden
- 2033.0
Population outlook (Washtenaw County) Hauer SSP2
- Today (2025)
- 402,878 people
- By 2030
- 424,104 · +5.3%
- By 2040
- 464,633 · +15.3%
- By 2050
- 504,728 · +25.3%
- By 2075
- 614,463 · +52.5%
- By 2100
- 676,181 · +67.8%
Race, ethnicity, and origin ACS 2023
- Neighborhood character
- Predominantly White (70%)
- Race & ethnicity
- White 70% Asian 10% Two or more races 9% Hispanic / Latino 6% Black 6%
- Hispanic origin (detail)
- Mexican 2%
- Common ancestry
- Romanian 6% Slovak 3% Iranian 3%
- Foreign-born
- 13% · Canada, China, South Korea
- Languages at home
- 83% English-only · Spanish 4% Chinese 3% Other Indo-European 2%
Political lean MEDSL · Washtenaw
- 2024 margin
- Solid D (+44.4) · D 71.0% · R 26.6% · Other 2.4%
- 2008→2024 swing
- +3.5pp toward D · 2008: 41.0pp · 2024: 44.4pp
- All cycles
- 2024: D+44.4 2020: D+46.6 2016: D+41.5 2012: D+36.0 2008: D+41.0
Not yet ingested
- Civics
- —
Market trends
- HPI YoY
- ▼ -472.49%
- Current HPI
- 244.6891
- Rent YoY
- ▲ 0.12%
- Metro
- Ann Arbor, MI
- State GDP YoY
- ▲ 1.37%
- F500 in state
- 28
Industry mix (Fortune 500 HQ in MI)
| Industry | F500 HQs | Revenue |
|---|---|---|
| Automotive Parts | 3 | $48B |
|
||
| Automotive | 2 | $372B |
|
||
| Chemicals | 1 | $45B |
|
||
| Automotive Retail | 1 | $29B |
|
||
| Healthcare / Medical Devices | 1 | $23B |
|
||
| Automotive Technology | 1 | $20B |
|
||
Price history
+262.9% since first listed24 events — show timeline
- 2026-05-29 Coming Soon $450,000 MiRealSource-MiMLS
- 2013-05-17 Sold (MLS) $179,900 SW Michigan MLS
- 2013-05-17 Sold (MLS) $179,900 AAMLS
- 2013-05-17 Delisted — AAMLS
- 2013-05-17 Sold (MLS) $179,900 MiRealSource-MiMLS
- 2013-05-17 Listing Removed — MiRealSource-MiMLS
- 2013-05-07 Sold (Public Records) $179,900 Public Records
- 2013-05-06 Sold (MLS) $179,900 SW Michigan MLS
- 2013-05-06 Sold (MLS) $179,900 AAMLS
- 2013-05-06 Sold (MLS) $179,900 MiRealSource-MiMLS
- 2013-04-13 Delisted — AAMLS
- 2013-04-13 Listing Removed — MiRealSource-MiMLS
- 2013-04-13 Delisted — AAMLS
- 2013-04-13 Listing Removed — MiRealSource-MiMLS
- 2013-04-09 Listed $179,900 SW Michigan MLS
- 2013-04-09 Listed $179,900 AAMLS
- 2013-04-09 Listed — AAMLS
- 2013-04-09 Listed $179,900 MiRealSource-MiMLS
- 2013-04-09 Listed $379,900 MiRealSource-MiMLS
- 2013-04-08 Listed $179,900 SW Michigan MLS
- 2013-04-08 Listed $179,900 AAMLS
- 2013-04-08 Listed $179,900 MiRealSource-MiMLS
- 1995-03-16 Sold (Public Records) $124,000 Public Records
- 1995-03-16 Sold (Public Records) $124,000 Public Records
Property tax history
+1.6%/yrLatest (2025): $6,901 · -20.3% YoY. Source: county tax records.
Cash-flow waterfall
monthlySold comps — $/sqft
last 12 mo · ≤1 miLoading sold comps…