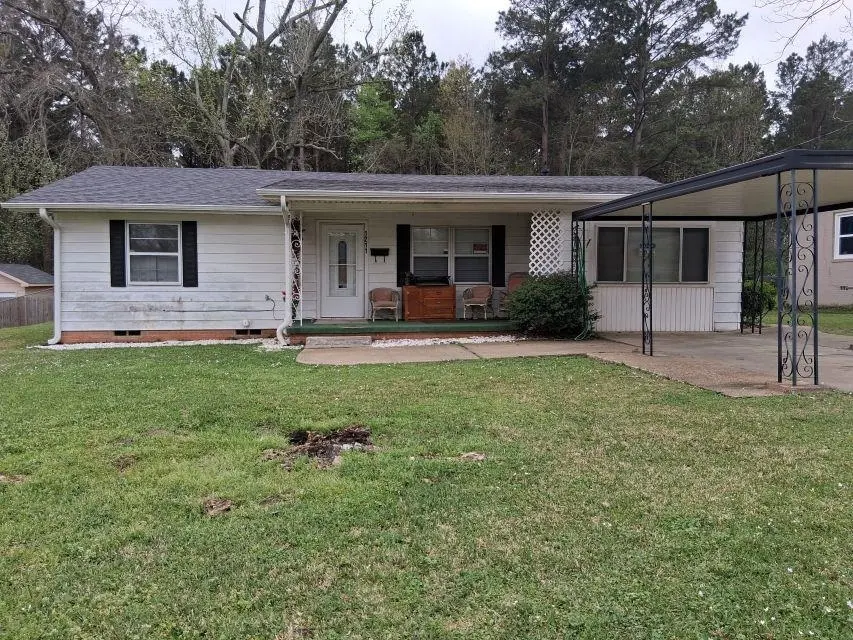
1211 Webb St · Henderson, TX
Flood risk 1/10 · Minimal
- FEMA flood zone
- X (unshaded)
- Chance of flooding over 30 yrs
- 0.0%
- Est. flood insurance / yr
- $507 – $1,088
Fire risk 5/10 · Moderate
- Est. fire insurance / yr
- $1,222 – $2,270
Heat risk 7/10 · Major
- Hot days now (above 110°F)
- 7 days/yr
- Hot days in 30 yrs
- 24 days/yr
Wind risk 6/10 · Moderate
- Chance of severe wind over 30 yrs
- 67.0%
Air-quality risk 1/10 · Minimal
- Unhealthy air days now
- 0 days/yr
- Unhealthy air days in 30 yrs
- 0 days/yr
Risk factors via First Street. Map © Google.
Why this score? — see what drove the D grade
The composite is a weighted blend of 9 inputs, each scored 0–100. Each bar is that input's sub-score; the figure is the points it added to the 100-point composite (weight × sub-score).
- Appreciation +10.0/10.0
- Cash flow +8.1/30.0
- ARV discount +7.5/15.0
- Livability +3.5/5.0
- Schools +2.8/10.0
- 1% rule +2.5/10.0
- Rent growth +2.5/5.0
- Condition / age +2.5/5.0
- DSCR +2.1/10.0
$138,900
🖨 Deal sheet (PDF) 📄 Offer letter ✓ Due diligence
Listing remarks
Welcome home! Many of the most expensive, invisible updates have been completed on this home. All new wiring, beam repairs, all new sub-flooring and flooring, and a new roof. Now you can make it your own with fresh paint and your style. The third bedroom is a flexible converted garage space with built-ins. At this price point, it won't last long, so make your appointment today.
Key facts
- 0.26 acre lot
- Garage
- Built 1958
Neighborhood map
What this means for you Summary
Snapshot
- This is a 3-bed/1.0-bath single-family listed at $139k.
Deal economics
- At list price, monthly cash flow is $-136 ($-2k/yr) — negative.
- To cash-flow at today's rent, offer at most $115k (17.3% below list).
- To meet the 1% rule (rent ≥ 1% of price), the offer needs to be $105k (24.6% below list).
- Recommended offer: $105k (24.6% below list) — sets the bar for 1% rule.
- Cap rate 5.1% vs local median 2.9% in Henderson — top-decile yield for the area; either an underpriced asset or a hidden risk that comps aren't pricing in. Stress-test before assuming the spread holds.
Location & tenants
- Location reads 69/100 on livability (#408 in TX) — a middle-class / working-renter tenant base. Strengths: cost of living A+, housing A+, health & safety A+; Watch: employment D+, crime F, amenities F.
- Henderson ISD (town): math 30% / reading 35% proficiency, ranked #573 of 826 in TX (top 69%) — families likely to look elsewhere, expect single-tenant / working-renter base with shorter leases.
- Zoned schools: William E Wylie El (math 31% / reading 39%, grade F, #1,965 of 4,322 statewide, top 46%, 671 students, 66% FRL); Henderson Middle (math 29% / reading 33%, grade F, #1,015 of 1,662 statewide, top 62%, 785 students, 58% FRL); Henderson H S (math 39% / reading 53%, grade D-, #627 of 1,632 statewide, top 38%, 1,042 students, 60% FRL).
- Market conditions: 181 active listings in the ZIP; 3 comparable units currently listed for rent nearby; rentals at typical pace (median 16d on market — plan ~3-4 weeks tenant-placement turnaround); 4 units permitted in Rusk County in 2024 (0 in 5+ unit buildings).
Forward outlook
- In year one you build about $15k of equity ($960 loan paydown + $14k appreciation (10.0% local appreciation)).
- Rusk County population projected to shrink 5% by 2050 — rents likely to lag national; underwrite the cash flow, not the appreciation.
- By year 3, paydown + projected appreciation supports a ~$38k cash-out refi (75% LTV) — recoverable capital for the next deal without selling this one.
Negotiation context
- It's been on market 19 days — a 2% lower offer ($137k) is reasonable based on typical stale-listing flexibility.
Risks & watch-outs
- Watch-outs: built in 1958 — expect roof / HVAC / electrical / plumbing capex.
- Climate carrying-cost: major wind risk, 67% chance of damaging wind over 30y; moderate wildfire risk; extreme-heat days projected 7→24/yr by 2055 (HVAC capex compounding) — expect insurance premiums to compound above CPI over the hold.
Questions for the listing agent
- What do current leases actually rent for vs. the listed asking? Can we see a recent rent roll and the last 12 months of T-12 income?
- Built in 1958 — when were the roof, HVAC, electrical panel, plumbing, and water heater last replaced?
- Is there a deadline driving the sale (1031 exchange, divorce, estate, relocation)? That informs how much negotiation room exists.
- Schools are D-rated, which usually means shorter tenancies and higher turnover. Who's the typical renter profile here, and what's been the actual vacancy rate?
- Crime grade is F in this area — have there been break-ins, vandalism, or insurance claims at this property in the last 3 years? What carrier currently insures it and at what premium?
- The area grade is low — what's the realistic commute time and amenity access for the typical tenant pool here? Any planned neighborhood developments (good or bad) we should know about?
- What's the average days-on-market for RENTAL listings here right now (not sales)? A rising rental-DOM trend means longer vacancies and softer asking-rent achievability than the comps imply.
- What's the recent tenant-quality profile in this submarket — average credit score on applications, eviction rate, late-payment / NSF rate, and stable-employment percentage? A property-management company in the area should have these aggregated.
- How much new for-sale + rental construction is in the pipeline within 1–3 miles? Heavy new supply typically softens prices + rents 12–24 months out; constrained supply supports both.
Investment metrics
- 1% rule
- 0.75% ✗
- Cap rate
- 5.12%
- Cash-on-cash
- -4.19%
- DSCR
- 0.81
- GRM
- 11.0
CMA / ARV
No comps found within radius.
Projected returns pro-forma
10.0% appreciation · 3.0% rent growth · sell at horizon
- IRR
- 21.3%
- Equity multiple
- 2.72×
- Total profit
- $67,015
- Equity at exit
- $125,132
- IRR
- 19.3%
- Equity multiple
- 6.25×
- Total profit
- $204,188
- Equity at exit
- $269,852
Cash invested: $38,892 (down + closing). Projections, not guarantees.
Landlord ↔ Tenant lean methodology
- Overall (STATE)
- 87 Strongly Landlord-Friendly
- State Texas
- 87 Strongly Landlord-Friendly · R+5
- County
- — inherits STATE
- City
- — inherits STATE
ZIP-level market 75654
- Home prices YoY
- 7.8%
- Active inventory
- 181
- Price-to-rent
- 11.0×
Monthly cashflow live
- Estimated rent
- $1,048 medium interval (Pro) →
- Mortgage (P&I)
- −$728
- Tax from tax record
- −$177 /mo · $2,126/yr
- Insurance
- −$58
- HOA
- −$0
- Vacancy / Maint / Mgmt
- −$220
- Net cashflow
- $-136
Break-even live
Sensitivity live
| Price | -10% $-57 | -5% $-97 | +0% $-136 | +5% $-175 | +10% $-214 |
|---|---|---|---|---|---|
| Rent | -10% $-219 | -5% $-177 | +0% $-136 | +5% $-94 | +10% $-53 |
| Rate | -1.0pp $-66 | -0.5pp $-101 | base $-136 | +0.5pp $-172 | +1.0pp $-208 |
UW: 25.0% down · 7.5% · 30yr · 1.5% tax · 5.0% vac · 8.0% maint · 8.0% mgmt
Financing live
Cash to close
- Down payment
- $34,725
- Closing costs
- $4,167
- Reserves months
- —
- Total cash needed
- —
Loan-product check · same deal, 3 products live
Conventional
25% down · 7.5% · 30yr
- Down + closing
- —
- Monthly P&I
- —
- Monthly cashflow
- —
- DSCR
- —
- Eligible?
- —
Personal DTI + credit; lowest rate.
DSCR
20% down · 8.5% · 30yr
- Down + closing
- —
- Monthly P&I
- —
- Monthly cashflow
- —
- DSCR
- —
- Eligible?
- —
No personal income docs; deal must DSCR.
Hard money
10% down · 12.0% · 12mo
- Down + closing
- —
- Monthly P&I
- —
- Monthly cashflow
- —
- DSCR
- —
- Eligible?
- —
Short-term bridge; refi at stabilization.
Rent comps 3 comps
| Address | Beds | Baths | Sqft | Rent | $/sqft | DOM | Units | Dist |
|---|---|---|---|---|---|---|---|---|
| 1802 Elm St Unit 407 Henderson, TX | 2.0 | 2.0 | 864 | $930 | $1.08 | 15d | 1 | 0.87mi |
| 1802 Elm St Unit 307 Henderson, TX | 2.0 | 2.0 | 864 | $895 | $1.04 | 15d | 1 | 0.87mi |
| 504 S Van Buren St Henderson, TX | 1.0–2.0 | 1.0 | 832 | $1,336 | $1.60 | 15d | 3 | 0.90mi |
Listing history 5 events
-
2026-04-25status Pending
-
2026-04-06$138,900 Active
-
2026-03-10soldstatus
-
2022-12-07soldstatus
-
1988-01-27soldstatus
ⓘ Source: listings_history table (triggers on properties + properties_extension) + one-shot
backfill from property_details.listing_events for pre-trigger history.
Tax reassessment forecast TX · Resets to sale price
- Current annual tax
- $2,126 · $177/mo
- Projected year-2 tax
- $2,542 · $212/mo
- Expected delta
- +$416/yr (+$35/mo · 19.5%)
ⓘ Screening estimate from a state-policy table — verify with the county assessor before closing.
Climate risk First Street
- Flood 1/10 Low FEMA zone X (unshaded) · 0% chance over 30 yrs
- Wildfire 5/10 Major
- Heat 7/10 Severe 7 d/yr ≥110°F today · 24 d/yr by 30 yrs out
- Wind 6/10 Major 67% chance of damaging wind over 30 yrs
- Air quality 1/10 Low 0 unhealthy d/yr today · 0 by 30 yrs out
Nearby sold comps map
Loading sold comps map…
Walkable amenities ~0.75 mi
Loading nearby amenities…
Taxation est. · year 1
- Rental income
- $12,572
- − Mortgage interest
- −$7,781
- − Property taxes
- −$2,126
- − Insurance
- −$694
- − Repairs & maintenance
- −$1,006
- − Management
- −$1,006
- − Depreciation
- −$4,041
- Taxable loss
- −$4,082
- Est. tax savings @ 24.0%
- +$980
- After-tax cash flow
- $-650/yr
For passive investors: Depreciation is non-cash, so a rental often shows a tax loss while cash-flowing — sheltering income. Rental losses are passive: they offset passive income freely, and up to $25,000/yr can offset ordinary (W-2) income if you actively participate and your MAGI is under $100k (phasing out to $0 by $150k); unused losses carry forward. On sale, claimed depreciation is recaptured at up to 25%, and gains may owe capital-gains tax (a 1031 exchange can defer both). Figures are a year-1 estimate at your 24.0% rate — not tax advice; consult a CPA.
Schools (NCES district)
- District
- Henderson ISD
- NCES district ID
- 4822970
- Math proficiency
- 30% ▼ -23.00%
- Reading proficiency
- 35% ▼ -13.00%
- Median HH income
- $46,296
- Composite
- 27.91/100
- National rank
- #6868
- State rank
- #573 of 826 in TX
Livability — Henderson
- Score
- 69/100
- State rank
- #408
- US rank
- #8434
Category grades
Schools grade is shown separately in the Schools card above.
Census & demographics
- Census place
- Henderson, TX
- Population (ZIP)
- 12,184
Population outlook (Rusk County) Hauer SSP2
- Today (2025)
- 52,498 people
- By 2030
- 52,093 · -0.8%
- By 2040
- 50,866 · -3.1%
- By 2050
- 49,696 · -5.3%
- By 2075
- 48,583 · -7.5%
- By 2100
- 43,265 · -17.6%
Race, ethnicity, and origin ACS 2023
- Neighborhood character
- Predominantly White (65%)
- Race & ethnicity
- White 65% Hispanic / Latino 24% Two or more races 16% Black 7%
- Hispanic origin (detail)
- Mexican 20%
- Common ancestry
- Lithuanian 1% Italian 1% Slovak 1%
- Foreign-born
- 11% · Canada
- Languages at home
- 81% English-only · Spanish 18%
Political lean MEDSL · Rusk
- 2024 margin
- Solid R (+59.4) · D 20.0% · R 79.4%
- 2008→2024 swing
- -13.2pp toward R · 2008: -46.3pp · 2024: -59.4pp
- All cycles
- 2024: R+59.4 2020: R+55.7 2016: R+56.5 2012: R+51.1 2008: R+46.3
Not yet ingested
- Civics
- —
Market trends
- HPI YoY
- ▲ 28.83%
- Current HPI
- 397.5
- Rent YoY
- —
- Metro
- —
- State GDP YoY
- ▲ 3.95%
- F500 in state
- 110
Industry mix (Fortune 500 HQ in TX)
| Industry | F500 HQs | Revenue |
|---|---|---|
| Energy | 16 | $1,198B |
|
||
| Technology | 5 | $198B |
|
||
| Engineering / Construction | 4 | $72B |
|
||
| Energy Services | 3 | $60B |
|
||
| Utilities | 3 | $41B |
|
||
| Healthcare | 2 | $330B |
|
||
Price history
5 events — show timeline
- 2026-04-25 Pending — LAAR
- 2026-04-06 Listed $138,900 LAAR
- 2026-03-10 Sold (Public Records) — Public Records
- 2022-12-07 Sold (Public Records) — Public Records
- 1988-01-27 Sold (Public Records) — Public Records
Property tax history
+2.5%/yrLatest (2025): $2,126 · -8.0% YoY. Source: county tax records.
Cash-flow waterfall
monthlySold comps — $/sqft
last 12 mo · ≤1 miLoading sold comps…