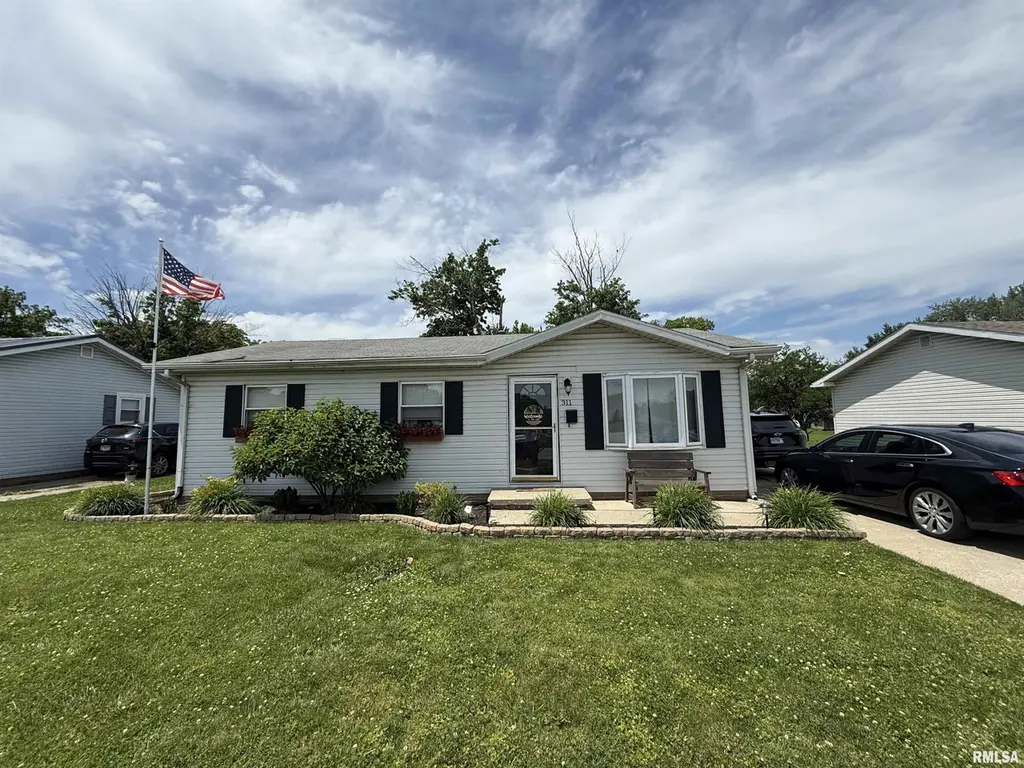
311 N Westgate Ave · Jacksonville, IL
Flood risk 1/10 · Minimal
- FEMA flood zone
- X (unshaded)
- Chance of flooding over 30 yrs
- 0.0%
- Est. flood insurance / yr
- $473 – $860
Fire risk 1/10 · Minimal
- Est. fire insurance / yr
- $804 – $1,492
Heat risk 4/10 · Minor
- Hot days now (above 105°F)
- 7 days/yr
- Hot days in 30 yrs
- 19 days/yr
Wind risk 2/10 · Minimal
- Chance of severe wind over 30 yrs
- 1.0%
Air-quality risk 2/10 · Minimal
- Unhealthy air days now
- 1 days/yr
- Unhealthy air days in 30 yrs
- 2 days/yr
Risk factors via First Street. Map © Google.
Why this score? — see what drove the C- grade
The composite is a weighted blend of 9 inputs, each scored 0–100. Each bar is that input's sub-score; the figure is the points it added to the 100-point composite (weight × sub-score).
- Cash flow +19.9/30.0
- ARV discount +11.1/15.0
- DSCR +6.3/10.0
- 1% rule +5.3/10.0
- Livability +3.8/5.0
- Rent growth +2.5/5.0
- Condition / age +2.5/5.0
- Schools +1.9/10.0
- Appreciation +0.0/10.0
$109,900
🖨 Deal sheet 📄 Offer letter ✓ Due diligence
Listing remarks MLS
Make this house your home! 3 bedrooms, 1 bathroom, laundry room off the kitchen and a cute living room! The best part, the back yard! Newly installed privacy fence for kids, pets and private get togethers! Replacement windows. Eisenhower School. Could be a great income property as well!
Key facts
- 7,200 sq ft lot
- Parking
- Built 1972
Property features AI
Exterior
- Parking: Parking pad (no garage)
- Utilities: Public water; Public sewer
- Home design: Single-family residence; One-story layout with additional lower/basement levels noted; Shingle roof
- Construction: Built in 1972; Shingle roof; Crawl space foundation
- Exterior features: Fenced yard; Level lot; Lot dimensions approximately 60 x 120
Interior
- Kitchen: Kitchen on main level (approx. 12 x 11)
- Bedrooms: 3 bedrooms (main level: Bedroom 1 — 9 x 13; main level: Bedroom 2 — 12 x 9; main level: Bedroom 3 — 10 x 8)
- Flooring: Hardwood in living room, kitchen and laundry; Carpet in bedrooms
- Bathrooms: 1 full bathroom
- Interior features: No fireplaces; Crawl space basement
- Laundry & utility: Main-level laundry room
Neighborhood map
What this means for you Summary
Snapshot
- This is a 3-bed/1.0-bath single-family listed at $110k.
Deal economics
- At list price, monthly cash flow is $133 ($2k/yr) — positive.
- The deal already cash-flows at list — no discount required.
- Meets the 1% rule at list price ($1k rent vs $110k).
- Cap rate 7.7% vs local median 5.4% in Jacksonville — top-decile yield for the area; either an underpriced asset or a hidden risk that comps aren't pricing in. Stress-test before assuming the spread holds.
Location & tenants
- Location reads 76/100 on livability (#187 in IL, #3,543 nationally) — a middle-class / working-renter tenant base. Strengths: cost of living A+, housing A+, health & safety A+; Watch: crime C-, amenities C-, schools D.
- Jacksonville SD 117 (town): math 20% / reading 23% proficiency, ranked #407 of 620 in IL (top 66%) — low school quality limits family demand, transient renter base, plan for 1-2y turnover.
- Market conditions: 141 active listings in the ZIP; 3 units permitted in Morgan County in 2024 (0 in 5+ unit buildings).
Forward outlook
- Local home prices are declining (-3.0%/yr); year-one equity from $760 of loan paydown is wiped out by about $3k of value loss. Plan a longer hold.
- Morgan County population projected at -20% by 2050 — secular population decline; favor cash flow + early exit over multi-decade hold.
Negotiation context
- Only 2 days on market — expect competitive offers; lowballing is unlikely to land.
- 3 sale attempts since 12y ago; this cycle's ask is 52% above the opening price — seller raised mid-cycle; expect resistance to lowballs.
- Current owner paid $68k; list at $110k implies a 60% gain — meaningful room to come down on a strong offer.
Questions for the listing agent
- Built in 1972 — when were the roof, HVAC, electrical panel, plumbing, and water heater last replaced?
- Is there a deadline driving the sale (1031 exchange, divorce, estate, relocation)? That informs how much negotiation room exists.
- Schools are D-rated, which usually means shorter tenancies and higher turnover. Who's the typical renter profile here, and what's been the actual vacancy rate?
- What's the average days-on-market for RENTAL listings here right now (not sales)? A rising rental-DOM trend means longer vacancies and softer asking-rent achievability than the comps imply.
- What's the recent tenant-quality profile in this submarket — average credit score on applications, eviction rate, late-payment / NSF rate, and stable-employment percentage? A property-management company in the area should have these aggregated.
- How much new for-sale + rental construction is in the pipeline within 1–3 miles? Heavy new supply typically softens prices + rents 12–24 months out; constrained supply supports both.
Investment metrics
- 1% rule
- 1.03% ✓
- Cap rate
- 7.74%
- Cash-on-cash
- 5.18%
- DSCR
- 1.23
- GRM
- 8.1
CMA / ARV
- ARV (on-the-fly)
- $119,472
- Comps found
- 12
Show comp detail 12 sales within ~0.75 mi
| Address | Dist | Beds/Ba | Sqft | Sold | Price | $/sf | Match |
|---|---|---|---|---|---|---|---|
| 23 Lavan Dr | 0.24mi | 3/1.0 | 912 (0%) | 8mo | $112,500 | $123 | 82 |
| 309 N Westgate Ave | 0.01mi | 3/1.0 | 912 (0%) | 23mo | $94,900 | $104 | 80 |
| 17 Merrygrove Dr | 0.30mi | 3/1.0 | 925 (+1%) | 7mo | $132,000 | $143 | 78 |
| 2 Harmony Dr | 0.13mi | 3/1.0 | 912 (0%) | 24mo | $119,900 | $131 | 74 |
| 13 Morningside Dr | 0.16mi | 2/1.0 (-1) | 952 (+4%) | 7mo | $112,000 | $118 | 74 |
| 1453 Passavant Dr | 0.49mi | 3/1.0 | 912 (0%) | 21mo | $120,400 | $132 | 60 |
| 12B Gettysburg Dr | 0.34mi | 2/1.0 (-1) | 1,008 (+10%) | 10mo | $129,900 | $129 | 54 |
| 10A Gettysburg Dr | 0.35mi | 2/1.0 (-1) | 1,008 (+10%) | 9mo | $95,000 | $94 | 53 |
| 1856 Plum St | 0.60mi | 2/1.0 (-1) | 960 (+5%) | 6mo | $129,900 | $135 | 53 |
| 208 Locust St | 0.65mi | 3/2.0 | 1,004 (+10%) | 12mo | $136,500 | $136 | 39 |
| 209 Locust St | 0.67mi | 2/1.0 (-1) | 784 (-14%) | 5mo | $87,000 | $111 | 37 |
| 1839 Mound Rd | 0.73mi | 2/1.0 (-1) | 1,016 (+11%) | 20mo | $148,900 | $147 | 25 |
Match score weights: distance 35% · size 25% · config 20% · recency 20%. Top-matched comps best support the ARV.
Projected returns pro-forma
-3.0% appreciation · 3.0% rent growth · sell at horizon
- IRR
- -8.2%
- Equity multiple
- 0.70×
- Total profit
- $-9,331
- Equity at exit
- $16,386
- IRR
- 1.3%
- Equity multiple
- 1.09×
- Total profit
- $2,844
- Equity at exit
- $9,502
Cash invested: $30,772 (down + closing). Projections, not guarantees.
Landlord ↔ Tenant lean methodology
- Overall (STATE)
- 43 Moderately Tenant-Leaning
- State Illinois
- 43 Moderately Tenant-Leaning · D+7
- County
- — inherits STATE
- City
- — inherits STATE
ZIP-level market 62650
- Active inventory
- 141
- Price-to-rent
- 8.1×
Monthly cashflow live
- Estimated rent
- $1,133 medium interval (Pro) →
- Mortgage (P&I)
- −$576
- Tax from tax record
- −$141 /mo · $1,686/yr
- Insurance
- −$46
- HOA
- −$0
- Vacancy / Maint / Mgmt
- −$238
- Net cashflow
- $133
Break-even live
UW: 25.0% down · 7.5% · 30yr · 1.5% tax · 5.0% vac · 8.0% maint · 8.0% mgmt
Financing live
Cash to close
- Down payment
- $27,475
- Closing costs
- $3,297
- Reserves months
- —
- Total cash needed
- —
Loan-product check · same deal, 3 products live
Conventional
25% down · 7.5% · 30yr
- Down + closing
- —
- Monthly P&I
- —
- Monthly cashflow
- —
- DSCR
- —
- Eligible?
- —
Personal DTI + credit; lowest rate.
DSCR
20% down · 8.5% · 30yr
- Down + closing
- —
- Monthly P&I
- —
- Monthly cashflow
- —
- DSCR
- —
- Eligible?
- —
No personal income docs; deal must DSCR.
Hard money
10% down · 12.0% · 12mo
- Down + closing
- —
- Monthly P&I
- —
- Monthly cashflow
- —
- DSCR
- —
- Eligible?
- —
Short-term bridge; refi at stabilization.
Listing history 12 events
-
2026-06-01status $109,900 Pending 2 DOM
-
2026-05-31days on market $109,900 Active 2 DOM
-
2026-05-26historical $109,900
-
2020-05-06soldstatus $68,500
-
2020-05-01soldstatus $68,500 287-char remark
Show marketing remark (287 chars)
Make this house your home! 3 bedrooms, 1 bathroom, laundry room off the kitchen and a cute living room! The best part, the back yard! Newly installed privacy fence for kids, pets and private get togethers! Replacement windows. Eisenhower School. Could be a great income property as well!
-
2020-02-10$72,500 287-char remark
Show marketing remark (287 chars)
Make this house your home! 3 bedrooms, 1 bathroom, laundry room off the kitchen and a cute living room! The best part, the back yard! Newly installed privacy fence for kids, pets and private get togethers! Replacement windows. Eisenhower School. Could be a great income property as well!
-
2016-10-14soldstatus $68,500
-
2016-10-13soldstatus $68,500 301-char remark
Show marketing remark (301 chars)
Great location for a Starter home or nice rental property. Kitchen was remodeled in 2014, new bath in 2013. New carpet in all bedrooms 2014. Roof is approx 12 years old and furnace has been updated. Replacement windows. Covered back porch and storage closet on back of home. Eisenhower School District
-
2016-08-23$71,000 301-char remark
Show marketing remark (301 chars)
Great location for a Starter home or nice rental property. Kitchen was remodeled in 2014, new bath in 2013. New carpet in all bedrooms 2014. Roof is approx 12 years old and furnace has been updated. Replacement windows. Covered back porch and storage closet on back of home. Eisenhower School District
-
2014-06-30soldstatus $63,000
-
2014-06-27soldstatus $63,000
-
2014-05-27$62,900
ⓘ Source: listings_history table (triggers on properties + properties_extension) + one-shot
backfill from property_details.listing_events for pre-trigger history.
Tax reassessment forecast IL · Partial reset (capped growth)
- Current annual tax
- $1,686 · $141/mo
- Projected year-2 tax
- $2,091 · $174/mo
- Expected delta
- +$404/yr (+$34/mo · 24.0%)
ⓘ Screening estimate from a state-policy table — verify with the county assessor before closing.
Climate risk First Street
- Flood 1/10 Low FEMA zone X (unshaded) · 0% chance over 30 yrs
- Wildfire 1/10 Low
- Heat 4/10 Moderate 7 d/yr ≥105°F today · 19 d/yr by 30 yrs out
- Wind 2/10 Low 100% chance of damaging wind over 30 yrs
- Air quality 2/10 Low 1 unhealthy d/yr today · 2 by 30 yrs out
Nearby sold comps map
Loading sold comps map…
Walkable amenities ~0.75 mi
Loading nearby amenities…
Taxation est. · year 1
- Rental income
- $13,602
- − Mortgage interest
- −$6,156
- − Property taxes
- −$1,686
- − Insurance
- −$550
- − Repairs & maintenance
- −$1,088
- − Management
- −$1,088
- − Depreciation
- −$3,197
- Taxable loss
- −$163
- Est. tax savings @ 24.0%
- +$39
- After-tax cash flow
- $1,633/yr
For passive investors: Depreciation is non-cash, so a rental often shows a tax loss while cash-flowing — sheltering income. Rental losses are passive: they offset passive income freely, and up to $25,000/yr can offset ordinary (W-2) income if you actively participate and your MAGI is under $100k (phasing out to $0 by $150k); unused losses carry forward. On sale, claimed depreciation is recaptured at up to 25%, and gains may owe capital-gains tax (a 1031 exchange can defer both). Figures are a year-1 estimate at your 24.0% rate — not tax advice; consult a CPA.
Schools (NCES district)
- District
- Jacksonville SD 117
- NCES district ID
- 1720280
- Math proficiency
- 20% ▼ -3.00%
- Reading proficiency
- 23% ▼ -6.00%
- Median HH income
- $44,909
- Composite
- 18.66/100
- National rank
- #8888
- State rank
- #407 of 620 in IL
Livability — Jacksonville
- Score
- 76/100
- State rank
- #187
- US rank
- #3543
Category grades
Schools grade is shown separately in the Schools card above.
Census & demographics
- Census place
- Jacksonville, IL
- City population
- 24,318
- Population (ZIP)
- 24,318
Population outlook (Morgan County) Hauer SSP2
- Today (2025)
- 32,874 people
- By 2030
- 31,698 · -3.6%
- By 2040
- 29,050 · -11.6%
- By 2050
- 26,381 · -19.8%
- By 2075
- 20,235 · -38.4%
- By 2100
- 14,324 · -56.4%
Race, ethnicity, and origin ACS 2023
- Neighborhood character
- Predominantly White (85%)
- Race & ethnicity
- White 85% Black 7% Two or more races 5% Hispanic / Latino 3%
- Common ancestry
- Lithuanian 2% Slovak 1% Iranian 1%
- Foreign-born
- 1% · Canada, South Korea
- Languages at home
- 97% English-only · Spanish 2%
Political lean MEDSL · Morgan
- 2024 margin
- Solid R (+32.5) · D 33.1% · R 65.6% · Other 1.3%
- 2008→2024 swing
- -31.7pp toward R · 2008: -0.8pp · 2024: -32.5pp
- All cycles
- 2024: R+32.5 2020: R+31.8 2016: R+29.9 2012: R+15.4 2008: R+0.8
Not yet ingested
- Civics
- —
Market trends
- HPI YoY
- ▼ -84.33%
- Current HPI
- 126.5712
- Rent YoY
- —
- Metro
- —
- State GDP YoY
- ▲ 1.59%
- F500 in state
- 60
Industry mix (Fortune 500 HQ in IL)
| Industry | F500 HQs | Revenue |
|---|---|---|
| Insurance | 4 | $201B |
|
||
| Consumer Goods | 4 | $87B |
|
||
| Industrial Machinery | 3 | $64B |
|
||
| Healthcare | 2 | $55B |
|
||
| Retail / Pharmacy | 1 | $148B |
|
||
| Agriculture / Food | 1 | $86B |
|
||
Price history
+74.7% since first listed10 events — show timeline
- 2026-05-26 Coming Soon $109,900 RMLSA as Distributed by MLS Grid
- 2020-05-06 Sold (Public Records) $68,500 Public Records
- 2020-05-01 Sold (MLS) $68,500 RMLSA as Distributed by MLS Grid
- 2020-02-10 Listed $72,500 RMLSA as Distributed by MLS Grid
- 2016-10-14 Sold (Public Records) $68,500 Public Records
- 2016-10-13 Sold (MLS) $68,500 RMLSA as Distributed by MLS Grid
- 2016-08-23 Listed $71,000 RMLSA as Distributed by MLS Grid
- 2014-06-30 Sold (Public Records) $63,000 Public Records
- 2014-06-27 Sold (MLS) $63,000 RMLSA as Distributed by MLS Grid
- 2014-05-27 Listed $62,900 RMLSA as Distributed by MLS Grid
Property tax history
+1.9%/yrLatest (2024): $1,686 · -2.9% YoY. Source: county tax records.
Cash-flow waterfall
monthlySold comps — $/sqft
last 12 mo · ≤1 miLoading sold comps…