2110 Wilcrest Dr #111 · Houston, TX
Flood risk 4/10 · Minor
- FEMA flood zone
- X (unshaded)
- Chance of flooding over 30 yrs
- 0.21%
- Est. flood insurance / yr
- $507 – $1,088
Fire risk 1/10 · Minimal
- Est. fire insurance / yr
- $1,222 – $2,270
Heat risk 9/10 · Severe
- Hot days now (above 110°F)
- 7 days/yr
- Hot days in 30 yrs
- 23 days/yr
Wind risk 9/10 · Severe
- Chance of severe wind over 30 yrs
- 99.0%
Air-quality risk 2/10 · Minimal
- Unhealthy air days now
- 2 days/yr
- Unhealthy air days in 30 yrs
- 2 days/yr
Risk factors via First Street. Map © Google.
Why this score? — see what drove the D grade
The composite is a weighted blend of 9 inputs, each scored 0–100. Each bar is that input's sub-score; the figure is the points it added to the 100-point composite (weight × sub-score).
- ARV discount +15.0/15.0
- 1% rule +8.3/10.0
- Cash flow +6.9/30.0
- Livability +3.7/5.0
- Schools +2.7/10.0
- Condition / age +2.5/5.0
- Rent growth +1.9/5.0
- DSCR +1.1/10.0
- Appreciation +0.0/10.0
$69,900
🖨 Deal sheet (PDF) 📄 Offer letter ✓ Due diligence
Listing remarks MLS
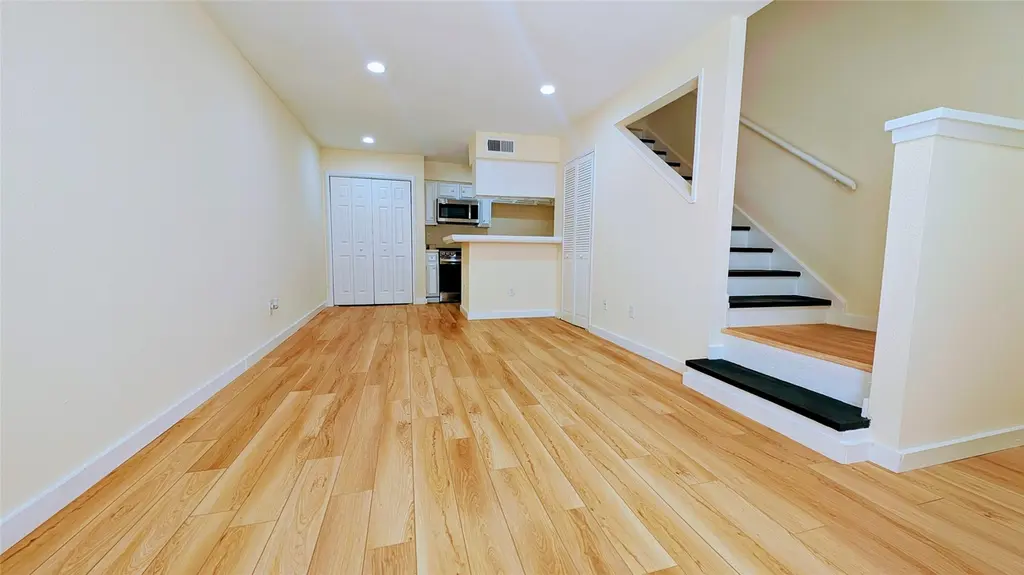
Move-in-ready and updated, this 1-bedroom, 1-bath condo is located in the heart of Houston’s Energy Corridor. Featuring a brand-new AC, new first-floor flooring, fresh interior paint, updated stairs, a remodeled bath and shower combo, and brand-new kitchen appliances, this home offers modern comfort with low-maintenance living. Enjoy a prime location with quick access to shopping, dining, entertainment, and major freeways, making daily commuting throughout Houston simple and convenient. Whether you’re a first-time homebuyer, looking to downsize, or searching for a rental-ready investment, this Energy Corridor condo delivers strong value, recent upgrades, and an unbeatable location.
Key facts
- Brand-new ac
- Updated stairs
- Fresh interior paint
Tags
Neighborhood map
What this means for you Summary
Snapshot
- This is a 1-bed/1.0-bath condo listed at $70k.
Deal economics
- At list price, monthly cash flow is $-105 ($-1k/yr) — negative.
- To cash-flow at today's rent, offer at most $51k (26.4% below list).
- Meets the 1% rule at list price ($932 rent vs $70k).
- Recommended offer: $51k (26.4% below list) — sets the bar for cash-flow.
- Cap rate 4.5% vs local median 3.2% in Houston — top-decile yield for the area; either an underpriced asset or a hidden risk that comps aren't pricing in. Stress-test before assuming the spread holds.
Location & tenants
- Location reads 74/100 on livability (#184 in TX, #4,771 nationally) — a middle-class / working-renter tenant base. Strengths: amenities A+, cost of living A+, housing A+; Watch: crime F.
- Houston ISD (urban): math 27% / reading 35% proficiency, ranked #593 of 826 in TX (top 72%) — families likely to look elsewhere, expect single-tenant / working-renter base with shorter leases; 71% free/reduced lunch — lower-income household profile, screen leases tightly.
- Zoned schools: Askew El (math 38% / reading 45%, grade F, #1,437 of 4,322 statewide, top 34%, 896 students, 74% FRL); Revere Middle (math 12% / reading 17%, grade F, #1,583 of 1,662 statewide, top 96%, 1,112 students, 93% FRL); Westside H S (math 33% / reading 63%, grade D, #571 of 1,632 statewide, top 36%, 2,882 students, 66% FRL).
- Market conditions: Rents soft (-2.3%/yr); 249 active listings in the ZIP; 40 comparable units currently listed for rent nearby; rentals at typical pace (median 16d on market — plan ~3-4 weeks tenant-placement turnaround); 29,883 units permitted in Harris County in 2024 (8,621 in 5+ unit buildings).
Forward outlook
- Local home prices are declining (-3.0%/yr); year-one equity from $483 of loan paydown is wiped out by about $2k of value loss. Plan a longer hold.
- Harris County population projected at +47% by 2050 — long-run rental-demand tailwind backs the buy-and-hold thesis.
Negotiation context
- It's been on market 142 days — a 12% lower offer ($62k) is reasonable based on typical stale-listing flexibility.
- 6 sale attempts since 2y ago; this cycle's ask has dropped $5k (7%) from the opening price — seller is motivated, your offer sets the floor, not the list.
Risks & watch-outs
- Watch-outs: property tax is 2.5% of price; HOA is 32% of rent.
- Climate carrying-cost: severe wind risk, 99% chance of damaging wind over 30y; extreme-heat days projected 7→23/yr by 2055 (HVAC capex compounding) — expect insurance premiums to compound above CPI over the hold.
Questions for the listing agent
- What do current leases actually rent for vs. the listed asking? Can we see a recent rent roll and the last 12 months of T-12 income?
- It's been on market 142 days. Have you received any prior offers? Is the seller open to a 26% concession, seller financing, or rate buy-down credit?
- Built in 1979 — when were the roof, HVAC, electrical panel, plumbing, and water heater last replaced?
- Property tax is high relative to price — has the assessment been appealed recently, and will the sale trigger a re-assessment?
- What does the HOA fee cover, when was the last increase, and are there any pending special assessments or reserve-fund shortfalls?
- Any open or pending special assessments — roof, HVAC, plumbing, elevator, façade? What's the per-unit balance and payoff schedule, and is the seller paying it off at close or rolling it to the buyer?
- Why hasn't it sold? Are there any deal-killer items the seller is aware of (foundation, flood, title, zoning, code violations)?
- Is there a deadline driving the sale (1031 exchange, divorce, estate, relocation)? That informs how much negotiation room exists.
- Schools are D-rated, which usually means shorter tenancies and higher turnover. Who's the typical renter profile here, and what's been the actual vacancy rate?
- Crime grade is F in this area — have there been break-ins, vandalism, or insurance claims at this property in the last 3 years? What carrier currently insures it and at what premium?
- The area grade is low — what's the realistic commute time and amenity access for the typical tenant pool here? Any planned neighborhood developments (good or bad) we should know about?
- What's the average days-on-market for RENTAL listings here right now (not sales)? A rising rental-DOM trend means longer vacancies and softer asking-rent achievability than the comps imply.
- What's the recent tenant-quality profile in this submarket — average credit score on applications, eviction rate, late-payment / NSF rate, and stable-employment percentage? A property-management company in the area should have these aggregated.
- How much new apartment / multifamily construction is in the pipeline within 1–3 miles? Heavy new supply (>2% of stock underway) typically softens rents 12–24 months out; light construction supports rent growth.
Investment metrics
- 1% rule
- 1.33% ✓
- Cap rate
- 4.50%
- Cash-on-cash
- -6.41%
- DSCR
- 0.71
- GRM
- 6.2
CMA / ARV
- ARV (median comp)
- $96,624
- List price
- $69,900
- Delta
- -27.66%
- Verdict
- UNDERPRICED
- Comps
- 20 within 1.0 mi
Projected returns pro-forma
-3.0% appreciation · 0.0% rent growth · sell at horizon
- IRR
- -33.6%
- Equity multiple
- -0.05×
- Total profit
- $-20,484
- Equity at exit
- $10,422
- IRR
- -89.9%
- Equity multiple
- -0.84×
- Total profit
- $-36,020
- Equity at exit
- $6,044
Cash invested: $19,572 (down + closing). Projections, not guarantees.
Landlord ↔ Tenant lean methodology
- Overall (STATE)
- 87 Strongly Landlord-Friendly
- State Texas
- 87 Strongly Landlord-Friendly · R+5
- County
- — inherits STATE
- City
- — inherits STATE
ZIP-level market 77042
- Rents YoY
- -2.3%
- Active inventory
- 249
- Price-to-rent
- 6.2×
Monthly cashflow live
- Estimated rent
- $932 high interval (Pro) →
- Mortgage (P&I)
- −$367
- Tax from tax record
- −$147 /mo · $1,769/yr
- Insurance
- −$29
- HOA
- −$298
- Vacancy / Maint / Mgmt
- −$196
- Net cashflow
- $-105
Break-even live
Sensitivity live
| Price | -10% $-65 | -5% $-85 | +0% $-105 | +5% $-124 | +10% $-144 |
|---|---|---|---|---|---|
| Rent | -10% $-178 | -5% $-141 | +0% $-105 | +5% $-68 | +10% $-31 |
| Rate | -1.0pp $-69 | -0.5pp $-87 | base $-105 | +0.5pp $-123 | +1.0pp $-141 |
UW: 25.0% down · 7.5% · 30yr · 1.5% tax · 5.0% vac · 8.0% maint · 8.0% mgmt
Financing live
Cash to close
- Down payment
- $17,475
- Closing costs
- $2,097
- Reserves months
- —
- Total cash needed
- —
Loan-product check · same deal, 3 products live
Conventional
25% down · 7.5% · 30yr
- Down + closing
- —
- Monthly P&I
- —
- Monthly cashflow
- —
- DSCR
- —
- Eligible?
- —
Personal DTI + credit; lowest rate.
DSCR
20% down · 8.5% · 30yr
- Down + closing
- —
- Monthly P&I
- —
- Monthly cashflow
- —
- DSCR
- —
- Eligible?
- —
No personal income docs; deal must DSCR.
Hard money
10% down · 12.0% · 12mo
- Down + closing
- —
- Monthly P&I
- —
- Monthly cashflow
- —
- DSCR
- —
- Eligible?
- —
Short-term bridge; refi at stabilization.
Rent comps 40 comps
| Address | Beds | Baths | Sqft | Rent | $/sqft | DOM | Units | Dist |
|---|---|---|---|---|---|---|---|---|
| 2100 Wilcrest Dr Houston, TX | 2.0 | 1.5–2.0 | 925 | $1,025 | $1.11 | 45d | 3 | 0.03mi |
| 11201 Olympia Dr Houston, TX | 2.0 | 2.0 | 1040 | $1,109 | $1.07 | 45d | 1 | 0.10mi |
| 2300 Wilcrest Dr Houston, TX | 1.0–2.0 | 1.0–2.0 | 714 | $809 | $1.13 | 9d | 12 | 0.15mi |
| 2300 Wilcrest Dr Houston, TX | 2.0 | 1.0–2.0 | 732 | $1,004 | $1.37 | 45d | 1 | 0.15mi |
| 2101 Hayes Rd Unit 2152 Houston, TX | 1.0 | 1.0 | 690 | $707 | $1.02 | 14d | 1 | 0.16mi |
| 2101 Hayes Rd Unit 2175 Houston, TX | 1.0 | 1.0 | 690 | $753 | $1.09 | 16d | 1 | 0.16mi |
| 2101 Hayes Rd Unit 2175 Houston, TX | 1.0 | 1.0 | 690 | $758 | $1.10 | 0d | 1 | 0.16mi |
| 11201 Olympia Dr Unit 4902 Houston, TX | 1.0 | 1.0 | 690 | $669 | $0.97 | 45d | 1 | 0.19mi |
| 2306 Wilcrest Dr Houston, TX | 1.0 | 1.0 | 550 | $844 | $1.53 | 24d | 1 | 0.23mi |
| 2306 Wilcrest Dr Houston, TX | 2.0 | 2.0 | 950 | $1,095 | $1.15 | 16d | 1 | 0.23mi |
| 2306 Wilcrest Dr Houston, TX | 1.0 | 1.0 | 550 | $844 | $1.53 | 22d | 1 | 0.23mi |
| 2306 Wilcrest Dr Houston, TX | 2.0 | 2.0 | 950 | $1,095 | $1.15 | 45d | 1 | 0.23mi |
| 2301 Hayes Rd Houston, TX | 1.0 | 1.0 | 730 | $910 | $1.25 | 16d | 1 | 0.25mi |
| 2301 Hayes Rd Unit 2375 Houston, TX | 1.0 | 1.0 | 690 | $755 | $1.09 | 0d | 1 | 0.25mi |
| 2301 Hayes Rd Unit 2352 Houston, TX | 1.0 | 1.0 | 690 | $704 | $1.02 | 14d | 1 | 0.25mi |
| 2301 Hayes Rd Unit 2322 Houston, TX | 1.0 | 1.0 | 730 | $915 | $1.25 | 16d | 1 | 0.25mi |
| 10931 Briar Forest Dr Houston, TX | 1.0 | 1.0 | 639 | $945 | $1.48 | 45d | 1 | 0.36mi |
| 10950 Briar Forest Dr Houston, TX | 1.0–4.0 | 1.0–2.0 | 1019 | $650 | $0.64 | 9d | 1 | 0.36mi |
| 10956 Briar Forest Dr Houston, TX | 2.0 | 1.0 | 951 | $975 | $1.03 | 26d | 1 | 0.36mi |
| 10956 Briar Forest Dr Houston, TX | 1.0 | 1.0 | 660 | $865 | $1.31 | 45d | 1 | 0.36mi |
| 10956 Briar Forest Dr Houston, TX | 1.0 | 1.0 | 660 | $865 | $1.31 | 22d | 1 | 0.36mi |
| 10925 Briar Forest Dr Houston, TX | 1.0–3.0 | 1.0–2.0 | 944 | $849 | $0.90 | 1d | 14 | 0.36mi |
| 10950 Briar Forest Dr Unit 1047 Houston, TX | 1.0 | 1.0 | 660 | $675 | $1.02 | 13d | 1 | 0.38mi |
| 10950 Briar Forest Dr Unit 2047 Houston, TX | 2.0 | 2.0 | 951 | $975 | $1.03 | 0d | 1 | 0.38mi |
| 10950 Briar Forest Dr Unit 1162 Houston, TX | 1.0 | 1.0 | 660 | $635 | $0.96 | 9d | 1 | 0.38mi |
| 10950 Briar Forest Dr Apt 311 Houston, TX | 1.0 | 1.0 | 660 | $675 | $1.02 | 0d | 1 | 0.44mi |
| 10950 Briar Forest Dr Unit 2162 Houston, TX | 2.0 | 2.0 | 951 | $940 | $0.99 | 9d | 1 | 0.44mi |
| 1307 Wilcrest Dr Unit 2174 Houston, TX | 2.0 | 2.0 | 924 | $1,083 | $1.17 | 1d | 1 | 0.46mi |
| 1307 Wilcrest Dr Unit 1364 Houston, TX | 2.0 | 2.0 | 924 | $1,134 | $1.23 | 14d | 1 | 0.46mi |
| 1307 Wilcrest Dr Unit 1174 Houston, TX | 1.0 | 1.0 | 619 | $805 | $1.30 | 16d | 1 | 0.46mi |
| 1307 Wilcrest Dr Unit 1358 Houston, TX | 1.0 | 1.0 | 619 | $775 | $1.25 | 18d | 1 | 0.46mi |
| 1307 Wilcrest Dr Unit 3305 Houston, TX | 2.0 | 2.0 | 924 | $1,129 | $1.22 | 26d | 1 | 0.46mi |
| 1307 Wilcrest Dr Unit 1381 Houston, TX | 1.0 | 1.0 | 619 | $810 | $1.31 | 16d | 1 | 0.46mi |
| 1307 Wilcrest Dr Unit 2165 Houston, TX | 2.0 | 2.0 | 924 | $1,124 | $1.22 | 1d | 1 | 0.48mi |
| 1307 Wilcrest Dr Unit 2165 Houston, TX | 2.0 | 2.0 | 924 | $1,134 | $1.23 | 0d | 1 | 0.48mi |
| 1251 Wilcrest Dr Houston, TX | 1.0 | 1.0 | 670 | $799 | $1.19 | 14d | 1 | 0.54mi |
| 1251 Wilcrest Dr Unit 1272 Houston, TX | 1.0 | 1.0 | 670 | $870 | $1.30 | 17d | 1 | 0.55mi |
| 1251 Wilcrest Dr Unit 1272 Houston, TX | 1.0 | 1.0 | 670 | $850 | $1.27 | 0d | 1 | 0.55mi |
| 1251 Wilcrest Dr Unit 1302 Houston, TX | 1.0 | 1.0 | 670 | $865 | $1.29 | 45d | 1 | 0.55mi |
| 1251 Wilcrest Dr Unit 324 Houston, TX | 1.0 | 1.0 | 670 | $810 | $1.21 | 9d | 1 | 0.55mi |
HOA detail condo
- Monthly dues
- $298 · $3,576/yr
- Assessments
- None detected in remarks — confirm with the listing agent.
Listing history 35 events
-
2026-06-21days on market $69,900 Active 142 DOM
-
2026-06-18days on market $69,900 Active 139 DOM
-
2026-06-17days on market $69,900 Active 138 DOM
-
2026-06-16days on market $69,900 Active 137 DOM
-
2026-06-15days on market $69,900 Active 136 DOM
-
2026-06-13days on market $69,900 Active 134 DOM
-
2026-06-10days on market $69,900 Active 130 DOM
-
2026-06-08days on market $69,900 Active 129 DOM
-
2026-06-07days on market $69,900 Active 128 DOM
-
2026-06-04days on market $69,900 Active 125 DOM
-
2026-06-01days on market $69,900 Active 122 DOM
-
2026-05-31days on market $69,900 Active 121 DOM
-
2026-05-07price $73,900 704-char remark
Show marketing remark (704 chars)
Move-in-ready and updated, this 1-bedroom, 1-bath condo is located in the heart of Houston’s Energy Corridor. Featuring a brand-new AC, new first-floor flooring, fresh interior paint, updated stairs, a remodeled bath and shower combo, and brand-new kitchen appliances, this home offers modern comfort with low-maintenance living. Enjoy a prime location with quick access to shopping, dining, entertainment, and major freeways, making daily commuting throughout Houston simple and convenient. Whether you’re a first-time homebuyer, looking to downsize, or searching for a rental-ready investment, this Energy Corridor condo delivers strong value, recent upgrades, and an unbeatable location.
-
2026-04-21price $74,500 704-char remark
Show marketing remark (704 chars)
Move-in-ready and updated, this 1-bedroom, 1-bath condo is located in the heart of Houston’s Energy Corridor. Featuring a brand-new AC, new first-floor flooring, fresh interior paint, updated stairs, a remodeled bath and shower combo, and brand-new kitchen appliances, this home offers modern comfort with low-maintenance living. Enjoy a prime location with quick access to shopping, dining, entertainment, and major freeways, making daily commuting throughout Houston simple and convenient. Whether you’re a first-time homebuyer, looking to downsize, or searching for a rental-ready investment, this Energy Corridor condo delivers strong value, recent upgrades, and an unbeatable location.
-
2026-03-28status Active 704-char remark
Show marketing remark (704 chars)
Move-in-ready and updated, this 1-bedroom, 1-bath condo is located in the heart of Houston’s Energy Corridor. Featuring a brand-new AC, new first-floor flooring, fresh interior paint, updated stairs, a remodeled bath and shower combo, and brand-new kitchen appliances, this home offers modern comfort with low-maintenance living. Enjoy a prime location with quick access to shopping, dining, entertainment, and major freeways, making daily commuting throughout Houston simple and convenient. Whether you’re a first-time homebuyer, looking to downsize, or searching for a rental-ready investment, this Energy Corridor condo delivers strong value, recent upgrades, and an unbeatable location.
-
2026-03-10status Pending 704-char remark
Show marketing remark (704 chars)
Move-in-ready and updated, this 1-bedroom, 1-bath condo is located in the heart of Houston’s Energy Corridor. Featuring a brand-new AC, new first-floor flooring, fresh interior paint, updated stairs, a remodeled bath and shower combo, and brand-new kitchen appliances, this home offers modern comfort with low-maintenance living. Enjoy a prime location with quick access to shopping, dining, entertainment, and major freeways, making daily commuting throughout Houston simple and convenient. Whether you’re a first-time homebuyer, looking to downsize, or searching for a rental-ready investment, this Energy Corridor condo delivers strong value, recent upgrades, and an unbeatable location.
-
2026-03-04status Pending 704-char remark
Show marketing remark (704 chars)
Move-in-ready and updated, this 1-bedroom, 1-bath condo is located in the heart of Houston’s Energy Corridor. Featuring a brand-new AC, new first-floor flooring, fresh interior paint, updated stairs, a remodeled bath and shower combo, and brand-new kitchen appliances, this home offers modern comfort with low-maintenance living. Enjoy a prime location with quick access to shopping, dining, entertainment, and major freeways, making daily commuting throughout Houston simple and convenient. Whether you’re a first-time homebuyer, looking to downsize, or searching for a rental-ready investment, this Energy Corridor condo delivers strong value, recent upgrades, and an unbeatable location.
-
2026-01-12$75,000 Active 704-char remark
Show marketing remark (704 chars)
Move-in-ready and updated, this 1-bedroom, 1-bath condo is located in the heart of Houston’s Energy Corridor. Featuring a brand-new AC, new first-floor flooring, fresh interior paint, updated stairs, a remodeled bath and shower combo, and brand-new kitchen appliances, this home offers modern comfort with low-maintenance living. Enjoy a prime location with quick access to shopping, dining, entertainment, and major freeways, making daily commuting throughout Houston simple and convenient. Whether you’re a first-time homebuyer, looking to downsize, or searching for a rental-ready investment, this Energy Corridor condo delivers strong value, recent upgrades, and an unbeatable location.
-
2025-12-07historical
-
2025-11-09status Active
-
2025-11-04status Pending
-
2025-10-08price $84,000
-
2025-09-03price $85,000
-
2025-08-13price $87,000
-
2025-07-28$88,000 Active
-
2025-02-10historical
-
2024-09-23price $81,000
-
2024-09-03price $81,999
-
2024-08-21$89,000 Active
-
2024-08-19historical
-
2024-07-23historical
-
2024-07-04$99,999 Active
-
2024-05-13soldstatus
-
2024-03-26soldstatus
-
1988-03-17soldstatus
ⓘ Source: listings_history table (triggers on properties + properties_extension) + one-shot
backfill from property_details.listing_events for pre-trigger history.
Tax reassessment forecast TX · Resets to sale price
- Current annual tax
- $1,769 · $147/mo
- Projected year-2 tax
- $1,769 · $147/mo
- Expected delta
- $0/yr ($0/mo · 0.0%)
ⓘ Screening estimate from a state-policy table — verify with the county assessor before closing.
Climate risk First Street
- Flood 4/10 Moderate FEMA zone X (unshaded) · 21% chance over 30 yrs
- Wildfire 1/10 Low
- Heat 9/10 Extreme 7 d/yr ≥110°F today · 23 d/yr by 30 yrs out
- Wind 9/10 Extreme 99% chance of damaging wind over 30 yrs
- Air quality 2/10 Low 2 unhealthy d/yr today · 2 by 30 yrs out
Nearby sold comps map
Loading sold comps map…
Walkable amenities ~0.75 mi
Loading nearby amenities…
Taxation est. · year 1
- Rental income
- $11,188
- − Mortgage interest
- −$3,915
- − Property taxes
- −$1,769
- − Insurance
- −$350
- − Repairs & maintenance
- −$895
- − Management
- −$895
- − HOA
- −$3,576
- − Depreciation
- −$2,033
- Taxable loss
- −$2,245
- Est. tax savings @ 24.0%
- +$539
- After-tax cash flow
- $-716/yr
For passive investors: Depreciation is non-cash, so a rental often shows a tax loss while cash-flowing — sheltering income. Rental losses are passive: they offset passive income freely, and up to $25,000/yr can offset ordinary (W-2) income if you actively participate and your MAGI is under $100k (phasing out to $0 by $150k); unused losses carry forward. On sale, claimed depreciation is recaptured at up to 25%, and gains may owe capital-gains tax (a 1031 exchange can defer both). Figures are a year-1 estimate at your 24.0% rate — not tax advice; consult a CPA.
Schools (NCES district)
- District
- Houston ISD
- NCES district ID
- 4823640
- Math proficiency
- 27% ▼ -18.00%
- Reading proficiency
- 35% ▼ -6.00%
- Median HH income
- $46,054
- Composite
- 26.63/100
- National rank
- #7173
- State rank
- #593 of 826 in TX
Livability — Houston
- Score
- 74/100
- State rank
- #184
- US rank
- #4771
Category grades
Schools grade is shown separately in the Schools card above.
Census & demographics
- Census place
- Houston, TX
- County
- Harris County · 4,702,590 people
- City population
- 3,226,434
- Metro
- Houston-The Woodlands-Sugar Land, TX
- Population (ZIP)
- 38,721
- Household income
- $59,097
- Rent vs Own
- Severe rent burden
- 3994.0
Population outlook (Harris County) Hauer SSP2
- Today (2025)
- 5,571,493 people
- By 2030
- 6,089,821 · +9.3%
- By 2040
- 7,142,806 · +28.2%
- By 2050
- 8,185,864 · +46.9%
- By 2075
- 10,574,329 · +89.8%
- By 2100
- 12,109,958 · +117.4%
Race, ethnicity, and origin ACS 2023
- Neighborhood character
- Highly diverse neighborhood (Simpson 0.72)
- Race & ethnicity
- Hispanic / Latino 36% White 31% Black 24% Two or more races 18% Asian 6% Native American 1%
- Hispanic origin (detail)
- Mexican 14% Cuban 4%
- Common ancestry
- Romanian 1% Serbian 1% Italian 1%
- Foreign-born
- 35% · Canada, Jamaica, China
- Languages at home
- 55% English-only · Spanish 31% Other Indo-European 2% Russian/Polish/Slavic 2%
Political lean MEDSL · Harris
- 2024 margin
- Lean D (+5.5) · D 52.0% · R 46.4% · Other 1.6%
- 2008→2024 swing
- +3.9pp toward D · 2008: 1.6pp · 2024: 5.5pp
- All cycles
- 2024: D+5.5 2020: D+13.3 2016: D+12.4 2012: D+0.1 2008: D+1.6
Not yet ingested
- Civics
- —
Market trends
- HPI YoY
- ▼ -234.36%
- Current HPI
- 215.9671
- Rent YoY
- ▼ -2.30%
- Metro
- Houston-The Woodlands-Sugar Land, TX
- State GDP YoY
- ▲ 3.95%
- F500 in state
- 110
Industry mix (Fortune 500 HQ in TX)
| Industry | F500 HQs | Revenue |
|---|---|---|
| Energy | 16 | $1,198B |
|
||
| Technology | 5 | $198B |
|
||
| Engineering / Construction | 4 | $72B |
|
||
| Energy Services | 3 | $60B |
|
||
| Utilities | 3 | $41B |
|
||
| Healthcare | 2 | $330B |
|
||
Price history
-26.1% since first listed23 events — show timeline
- 2026-05-07 Price Changed $73,900 HARMLS
- 2026-04-21 Price Changed $74,500 HARMLS
- 2026-03-28 Relisted — HARMLS
- 2026-03-10 Pending — HARMLS
- 2026-03-04 Pending — HARMLS
- 2026-01-12 Listed $75,000 HARMLS
- 2025-12-07 Listing Removed — HARMLS
- 2025-11-09 Relisted — HARMLS
- 2025-11-04 Pending — HARMLS
- 2025-10-08 Price Changed $84,000 HARMLS
- 2025-09-03 Price Changed $85,000 HARMLS
- 2025-08-13 Price Changed $87,000 HARMLS
- 2025-07-28 Listed $88,000 HARMLS
- 2025-02-10 Listing Removed — HARMLS
- 2024-09-23 Price Changed $81,000 HARMLS
- 2024-09-03 Price Changed $81,999 HARMLS
- 2024-08-21 Listed $89,000 HARMLS
- 2024-08-19 Coming Soon — HARMLS
- 2024-07-23 Listing Removed — HARMLS
- 2024-07-04 Listed $99,999 HARMLS
- 2024-05-13 Sold (Public Records) — Public Records
- 2024-03-26 Sold (Public Records) — Public Records
- 1988-03-17 Sold (Public Records) — Public Records
Property tax history
+4.3%/yrLatest (2025): $1,769 · +11.7% YoY. Source: county tax records.
Cash-flow waterfall
monthlySold comps — $/sqft
last 12 mo · ≤1 miLoading sold comps…