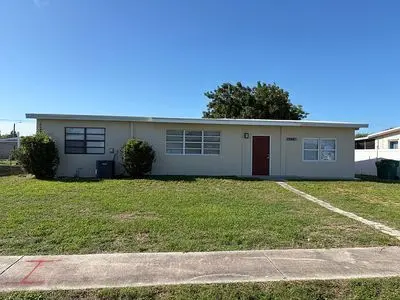
22481 Catherine Ave · Port Charlotte, FL
Flood risk 6/10 · Moderate
- FEMA flood zone
- X (shaded)
- Chance of flooding over 30 yrs
- 0.57%
- Est. flood insurance / yr
- $507 – $1,088
Fire risk 1/10 · Minimal
- Est. fire insurance / yr
- $947 – $1,759
Heat risk 10/10 · Severe
- Hot days now (above 107°F)
- 7 days/yr
- Hot days in 30 yrs
- 28 days/yr
Wind risk 10/10 · Severe
- Chance of severe wind over 30 yrs
- 99.0%
Air-quality risk 3/10 · Minor
- Unhealthy air days now
- 2 days/yr
- Unhealthy air days in 30 yrs
- 2 days/yr
Risk factors via First Street. Map © Google.
Why this score? — see what drove the C grade
The composite is a weighted blend of 9 inputs, each scored 0–100. Each bar is that input's sub-score; the figure is the points it added to the 100-point composite (weight × sub-score).
- Cash flow +19.8/30.0
- ARV discount +15.0/15.0
- DSCR +6.3/10.0
- 1% rule +5.3/10.0
- Schools +4.6/10.0
- Livability +3.2/5.0
- Condition / age +2.5/5.0
- Rent growth +2.2/5.0
- Appreciation +0.0/10.0
$180,000
🖨 Deal sheet 📄 Offer letter ✓ Due diligence
Listing remarks MLS
AFFORDABLE 3 BED/2.5 BATH HOME ALREADY SET UP FOR POSSIBLE IN-LAW LAY OUT (BEDROOM, BATH, KITCHEN). 200 AMP ELECTRICAL. TANKLESS HOT WATER SYSTEM. SQUARE FOOTAGE DOES NOT REFLECT CC APPRAISER # s. HOME LAYOUT OFFERS BUYERS MANY POSSIBILITIES. MINOR DAMAGEBEING REPAIRED.
Key facts
- Newer roof
- New central ac
- All tile floor
Tags
Neighborhood map
What this means for you Summary
Snapshot
- This is a 3-bed/1.0-bath single-family listed at $180k.
Deal economics
- At list price, monthly cash flow is $215 ($3k/yr) — positive.
- The deal already cash-flows at list — no discount required.
- Meets the 1% rule at list price ($2k rent vs $180k).
- Recommended offer: $177k (1.5% below list) — sets the bar for market timing.
- Cap rate 7.7% vs local median 4.4% in Port Charlotte — top-decile yield for the area; either an underpriced asset or a hidden risk that comps aren't pricing in. Stress-test before assuming the spread holds.
Location & tenants
- Location reads 65/100 on livability (#655 in FL) — a middle-class / working-renter tenant base. Strengths: cost of living A+, housing A+; Watch: schools D+, employment D, amenities F.
- Charlotte (suburban): math 54% / reading 54% proficiency, ranked #22 of 73 in FL (top 30%) — acceptable for families but not a draw, mixed tenant base, ~2y average lease.
- Market conditions: Rents soft (-1.4%/yr); 707 active listings in the ZIP; 38 comparable units currently listed for rent nearby; rentals at typical pace (median 21d on market — plan ~3-4 weeks tenant-placement turnaround); 4,585 units permitted in Charlotte County in 2024 (703 in 5+ unit buildings).
- This rent runs 36% of the median local income ($61k/yr) — at the standard rent-burdened threshold; future hikes will face affordability resistance.
Forward outlook
- Local home prices are declining (-3.0%/yr); year-one equity from $1k of loan paydown is wiped out by about $5k of value loss. Plan a longer hold.
- Charlotte County population projected at +24% by 2050 — long-run rental-demand tailwind backs the buy-and-hold thesis.
Negotiation context
- It's been on market 15 days — a 2% lower offer ($177k) is reasonable based on typical stale-listing flexibility.
- 3 sale attempts since 21y ago with the ask held roughly flat each time — persistent listings suggest the price (not the market) is what's stuck; bring a comps-based counter.
- Current owner paid $130k; 38% above their basis — modest negotiation headroom, anchor on the comps not their cost.
Risks & watch-outs
- Climate carrying-cost: major flood risk; severe wind risk, 99% chance of damaging wind over 30y; extreme-heat days projected 7→28/yr by 2055 (HVAC capex compounding) — expect insurance premiums to compound above CPI over the hold.
Questions for the listing agent
- Built in 1962 — when were the roof, HVAC, electrical panel, plumbing, and water heater last replaced?
- Is there a deadline driving the sale (1031 exchange, divorce, estate, relocation)? That informs how much negotiation room exists.
- Schools are D-rated, which usually means shorter tenancies and higher turnover. Who's the typical renter profile here, and what's been the actual vacancy rate?
- What's the average days-on-market for RENTAL listings here right now (not sales)? A rising rental-DOM trend means longer vacancies and softer asking-rent achievability than the comps imply.
- What's the recent tenant-quality profile in this submarket — average credit score on applications, eviction rate, late-payment / NSF rate, and stable-employment percentage? A property-management company in the area should have these aggregated.
- How much new for-sale + rental construction is in the pipeline within 1–3 miles? Heavy new supply typically softens prices + rents 12–24 months out; constrained supply supports both.
Investment metrics
- 1% rule
- 1.03% ✓
- Cap rate
- 7.72%
- Cash-on-cash
- 5.11%
- DSCR
- 1.23
- GRM
- 8.1
CMA / ARV
- ARV (on-the-fly)
- $233,442
- Comps found
- 8
Show comp detail 8 sales within ~0.75 mi
| Address | Dist | Beds/Ba | Sqft | Sold | Price | $/sf | Match |
|---|---|---|---|---|---|---|---|
| 2191 Morley St | 0.18mi | 3/2.0 | 1,539 (+7%) | 17mo | $250,000 | $162 | 62 |
| 22318 Alcorn Ave | 0.59mi | 4/2.0 (+1) | 1,426 (-1%) | 10mo | $305,000 | $214 | 53 |
| 22126 Gatewood Ave | 0.44mi | 2/1.0 (-1) | 1,326 (-8%) | 16mo | $165,000 | $124 | 48 |
| 1365 Alton Rd | 0.67mi | 3/2.0 | 1,332 (-8%) | 7mo | $205,000 | $154 | 46 |
| 1525 Alton Rd | 0.40mi | 2/2.0 (-1) | 1,558 (+8%) | 20mo | $255,000 | $164 | 42 |
| 23046 Foote Ave | 0.50mi | 4/2.0 (+1) | 1,579 (+10%) | 16mo | $285,000 | $180 | 38 |
| 2055 Hariet St | 0.62mi | 3/2.0 | 1,248 (-13%) | 9mo | $192,000 | $154 | 37 |
| 2548 Starlite Ln | 0.69mi | 2/2.0 (-1) | 1,269 (-12%) | 13mo | $175,000 | $138 | 28 |
Match score weights: distance 35% · size 25% · config 20% · recency 20%. Top-matched comps best support the ARV.
Projected returns pro-forma
-3.0% appreciation · 0.0% rent growth · sell at horizon
- IRR
- -11.8%
- Equity multiple
- 0.59×
- Total profit
- $-20,894
- Equity at exit
- $26,839
- IRR
- -7.8%
- Equity multiple
- 0.57×
- Total profit
- $-21,456
- Equity at exit
- $15,563
Cash invested: $50,400 (down + closing). Projections, not guarantees.
Landlord ↔ Tenant lean methodology
- Overall (STATE)
- 87 Strongly Landlord-Friendly
- State Florida
- 87 Strongly Landlord-Friendly · R+3
- County
- — inherits STATE
- City
- — inherits STATE
ZIP-level market 33952
- Home prices YoY
- -4.8%
- Rents YoY
- -1.4%
- Active inventory
- 707
- Price-to-rent
- 8.1×
Monthly cashflow live
- Estimated rent
- $1,854 high interval (Pro) →
- Mortgage (P&I)
- −$944
- Tax from tax record
- −$231 /mo · $2,774/yr
- Insurance
- −$75
- HOA
- −$0
- Vacancy / Maint / Mgmt
- −$389
- Net cashflow
- $215
Break-even live
UW: 25.0% down · 7.5% · 30yr · 1.5% tax · 5.0% vac · 8.0% maint · 8.0% mgmt
Financing live
Cash to close
- Down payment
- $45,000
- Closing costs
- $5,400
- Reserves months
- —
- Total cash needed
- —
Loan-product check · same deal, 3 products live
Conventional
25% down · 7.5% · 30yr
- Down + closing
- —
- Monthly P&I
- —
- Monthly cashflow
- —
- DSCR
- —
- Eligible?
- —
Personal DTI + credit; lowest rate.
DSCR
20% down · 8.5% · 30yr
- Down + closing
- —
- Monthly P&I
- —
- Monthly cashflow
- —
- DSCR
- —
- Eligible?
- —
No personal income docs; deal must DSCR.
Hard money
10% down · 12.0% · 12mo
- Down + closing
- —
- Monthly P&I
- —
- Monthly cashflow
- —
- DSCR
- —
- Eligible?
- —
Short-term bridge; refi at stabilization.
Rent comps 38 comps
| Address | Beds | Baths | Sqft | Rent | $/sqft | DOM | Units | Dist |
|---|---|---|---|---|---|---|---|---|
| 1636 Hayworth Rd Port Charlotte, FL | 2.0 | 2.0 | 884 | $1,300 | $1.47 | 21d | 1 | 0.27mi |
| 2377 Starlite Ln Port Charlotte, FL | 3.0 | 1.5 | 1253 | $1,575 | $1.26 | 21d | 1 | 0.37mi |
| 22137 Midway Blvd Port Charlotte, FL | 4.0 | 1.0 | 1500 | $1,350 | $0.90 | 21d | 1 | 0.40mi |
| 2451 Aquilos Ct Port Charlotte, FL | 2.0 | 2.0 | 1307 | $2,000 | $1.53 | 13d | 1 | 0.50mi |
| 1516 Abel St Port Charlotte, FL | 3.0 | 2.0 | 1874 | $2,200 | $1.17 | 21d | 1 | 0.58mi |
| 22086 Beverly Ave Port Charlotte, FL | 2.0 | 1.0 | 1031 | $1,250 | $1.21 | 21d | 1 | 0.58mi |
| 2055 Hariet St Port Charlotte, FL | 2.0 | 2.0 | 1650 | $1,900 | $1.15 | 21d | 1 | 0.60mi |
| 2421 Ivanhoe St Port Charlotte, FL | 2.0 | 2.0 | 1396 | $3,300 | $2.36 | 13d | 1 | 0.61mi |
| 2171 Birchcrest Blvd Port Charlotte, FL | 2.0 | 1.5 | 1162 | $1,500 | $1.29 | 21d | 1 | 0.66mi |
| 21988 Cellini Ave Port Charlotte, FL | 4.0 | 3.0 | 1500 | $2,000 | $1.33 | 21d | 1 | 0.68mi |
| 22017 Beverly Ave Port Charlotte, FL | 3.0 | 2.0 | 1472 | $1,600 | $1.09 | 13d | 1 | 0.69mi |
| 1365 Alton Rd Port Charlotte, FL | 3.0 | 2.0 | 1640 | $1,800 | $1.10 | 21d | 1 | 0.70mi |
| 21499 Glendale Ave Port Charlotte, FL | 3.0 | 1.0 | 1077 | $1,600 | $1.49 | 21d | 1 | 0.73mi |
| 22153 Olean Blvd Port Charlotte, FL | 2.0 | 2.0 | 1337 | $1,425 | $1.07 | 21d | 1 | 0.80mi |
| 21426 Glendale Ave Port Charlotte, FL | 3.0 | 1.5 | 1423 | $1,511 | $1.06 | 13d | 1 | 0.86mi |
| 1235 Desmond St Port Charlotte, FL | 4.0 | 2.0 | 1833 | $1,866 | $1.02 | 21d | 1 | 0.93mi |
| 21385 Gibralter Dr Port Charlotte, FL | 2.0 | 2.0 | 1172 | $1,650 | $1.41 | 21d | 1 | 0.97mi |
| 1314 Beacon Dr Port Charlotte, FL | 3.0 | 2.0 | 1783 | $2,500 | $1.40 | 21d | 1 | 0.97mi |
| 22148 Lockport Ave Port Charlotte, FL | 3.0 | 2.0 | 1760 | $1,850 | $1.05 | 13d | 1 | 0.99mi |
| 1195 Desmond St Port Charlotte, FL | 3.0 | 2.0 | 1388 | $1,716 | $1.24 | 21d | 1 | 1.01mi |
| 1299 Birchcrest Blvd Port Charlotte, FL | 3.0 | 2.0 | 1176 | $1,800 | $1.53 | 21d | 1 | 1.03mi |
| 21322 Stillwater Ave Port Charlotte, FL | 2.0 | 1.0 | 1080 | $1,300 | $1.20 | 21d | 1 | 1.10mi |
| 21422 Kenyon Ave Port Charlotte, FL | 2.0 | 2.0 | 1149 | $1,400 | $1.22 | 21d | 1 | 1.12mi |
| 1506 Dewitt St Port Charlotte, FL | 3.0 | 2.0 | 1198 | $1,800 | $1.50 | 21d | 1 | 1.12mi |
| 21440 Mallory Ave Port Charlotte, FL | 2.0 | 1.0 | 930 | $1,550 | $1.67 | 21d | 1 | 1.13mi |
| 21298 Stillwater Ave Port Charlotte, FL | 2.0 | 1.0 | 1798 | $1,300 | $0.72 | 21d | 1 | 1.14mi |
| 3185 Clifford St Port Charlotte, FL | 3.0 | 2.0 | 1776 | $2,400 | $1.35 | 13d | 1 | 1.15mi |
| 1138 Presque Isle Dr Port Charlotte, FL | 3.0 | 2.0 | 1739 | $1,891 | $1.09 | 13d | 1 | 1.17mi |
| 21307 Gertrude Ave Port Charlotte, FL | 2.0 | 3.0 | 1170 | $1,650 | $1.41 | 21d | 1 | 1.19mi |
| 23367 Mayville Ave Punta Gorda, FL | 4.0 | 2.0 | 1532 | $2,300 | $1.50 | 21d | 1 | 1.24mi |
| 23184 Glory Ave Port Charlotte, FL | 2.0 | 2.0 | 1370 | $2,000 | $1.46 | 21d | 1 | 1.25mi |
| 3281 Easy St Port Charlotte, FL | 3.0 | 2.0 | 1196 | $1,750 | $1.46 | 13d | 1 | 1.28mi |
| 3100 Harbor Blvd Port Charlotte, FL | 2.0 | 1.0–1.5 | 994 | $1,472 | $1.48 | 21d | 2 | 1.30mi |
| 3126 Harbor Blvd Unit 3A Port Charlotte, FL | 2.0 | 2.0 | 1100 | $1,500 | $1.36 | 13d | 1 | 1.31mi |
| 21212 Burkhart Dr Port Charlotte, FL | 3.0 | 2.0 | 1863 | $2,350 | $1.26 | 21d | 1 | 1.31mi |
| 1057 Presque Isle Dr Port Charlotte, FL | 3.0 | 2.0 | 1673 | $2,950 | $1.76 | 21d | 1 | 1.33mi |
| 21155 Meehan Ave Port Charlotte, FL | 3.0 | 1.0 | 1060 | $1,300 | $1.23 | 21d | 1 | 1.36mi |
| 21262 Quesada Ave Port Charlotte, FL | 4.0 | 2.0 | 1650 | $1,845 | $1.12 | 21d | 1 | 1.44mi |
Listing history 7 events
-
2026-05-12$180,000 Active
-
2011-11-05historical
-
2011-05-09$39,000
-
2005-05-24soldstatus $130,000
-
2005-05-17soldstatus $130,000 271-char remark
Show marketing remark (271 chars)
AFFORDABLE 3 BED/2.5 BATH HOME ALREADY SET UP FOR POSSIBLE IN-LAW LAY OUT (BEDROOM, BATH, KITCHEN). 200 AMP ELECTRICAL. TANKLESS HOT WATER SYSTEM. SQUARE FOOTAGE DOES NOT REFLECT CC APPRAISER # s. HOME LAYOUT OFFERS BUYERS MANY POSSIBILITIES. MINOR DAMAGEBEING REPAIRED.
-
2005-04-06$140,000 271-char remark
Show marketing remark (271 chars)
AFFORDABLE 3 BED/2.5 BATH HOME ALREADY SET UP FOR POSSIBLE IN-LAW LAY OUT (BEDROOM, BATH, KITCHEN). 200 AMP ELECTRICAL. TANKLESS HOT WATER SYSTEM. SQUARE FOOTAGE DOES NOT REFLECT CC APPRAISER # s. HOME LAYOUT OFFERS BUYERS MANY POSSIBILITIES. MINOR DAMAGEBEING REPAIRED.
-
1983-03-01soldstatus $39,000
ⓘ Source: listings_history table (triggers on properties + properties_extension) + one-shot
backfill from property_details.listing_events for pre-trigger history.
Tax reassessment forecast FL · Resets to sale price
- Current annual tax
- $2,774 · $231/mo
- Projected year-2 tax
- $2,774 · $231/mo
- Expected delta
- $0/yr ($0/mo · 0.0%)
ⓘ Screening estimate from a state-policy table — verify with the county assessor before closing.
Climate risk First Street
- Flood 6/10 Major FEMA zone X (shaded) · 57% chance over 30 yrs
- Wildfire 1/10 Low
- Heat 10/10 Extreme 7 d/yr ≥107°F today · 28 d/yr by 30 yrs out
- Wind 10/10 Extreme 99% chance of damaging wind over 30 yrs
- Air quality 3/10 Moderate 2 unhealthy d/yr today · 2 by 30 yrs out
Nearby sold comps map
Loading sold comps map…
Walkable amenities ~0.75 mi
Loading nearby amenities…
Taxation est. · year 1
- Rental income
- $22,250
- − Mortgage interest
- −$10,083
- − Property taxes
- −$2,774
- − Insurance
- −$900
- − Repairs & maintenance
- −$1,780
- − Management
- −$1,780
- − Depreciation
- −$5,236
- Taxable loss
- −$303
- Est. tax savings @ 24.0%
- +$73
- After-tax cash flow
- $2,649/yr
For passive investors: Depreciation is non-cash, so a rental often shows a tax loss while cash-flowing — sheltering income. Rental losses are passive: they offset passive income freely, and up to $25,000/yr can offset ordinary (W-2) income if you actively participate and your MAGI is under $100k (phasing out to $0 by $150k); unused losses carry forward. On sale, claimed depreciation is recaptured at up to 25%, and gains may owe capital-gains tax (a 1031 exchange can defer both). Figures are a year-1 estimate at your 24.0% rate — not tax advice; consult a CPA.
Schools (NCES district)
- District
- Charlotte
- NCES district ID
- 1200240
- Math proficiency
- 54% ▼ -6.00%
- Reading proficiency
- 54% ▼ -1.00%
- Median HH income
- $44,864
- Composite
- 45.62/100
- National rank
- #2586
- State rank
- #22 of 73 in FL
Livability — Port Charlotte
- Score
- 65/100
- State rank
- #655
- US rank
- #13081
Category grades
Schools grade is shown separately in the Schools card above.
Census & demographics
- Census place
- Port Charlotte, FL
- County
- Charlotte County · 196,994 people
- City population
- 102,180
- Metro
- Punta Gorda, FL
- Population (ZIP)
- 35,231
- Household income
- $61,382
- Rent vs Own
- Severe rent burden
- 733.0
Population outlook (Charlotte County) Hauer SSP2
- Today (2025)
- 198,646 people
- By 2030
- 210,507 · +6.0%
- By 2040
- 230,857 · +16.2%
- By 2050
- 247,148 · +24.4%
- By 2075
- 281,777 · +41.8%
- By 2100
- 293,609 · +47.8%
Race, ethnicity, and origin ACS 2023
- Neighborhood character
- Predominantly White (76%)
- Race & ethnicity
- White 76% Hispanic / Latino 14% Two or more races 8% Black 6% Asian 2%
- Hispanic origin (detail)
- Mexican 2% Puerto Rican 3% Cuban 2%
- Common ancestry
- Lithuanian 2% Romanian 2% Italian 2%
- Foreign-born
- 12% · Canada, Vietnam
- Languages at home
- 85% English-only · Spanish 10% French/Haitian/Cajun 1% Russian/Polish/Slavic 1%
Political lean MEDSL · Charlotte
- 2024 margin
- Solid R (+34.0) · D 32.7% · R 66.7%
- 2008→2024 swing
- -26.7pp toward R · 2008: -7.2pp · 2024: -34.0pp
- All cycles
- 2024: R+34.0 2020: R+26.6 2016: R+27.8 2012: R+14.3 2008: R+7.2
Not yet ingested
- Civics
- —
Market trends
- HPI YoY
- ▼ -17.18%
- Current HPI
- 339.0932
- Rent YoY
- ▼ -1.35%
- Metro
- Punta Gorda, FL
- State GDP YoY
- ▲ 3.28%
- F500 in state
- 36
Industry mix (Fortune 500 HQ in FL)
| Industry | F500 HQs | Revenue |
|---|---|---|
| Industrial Technology | 2 | $29B |
|
||
| Insurance | 2 | $17B |
|
||
| Retail | 1 | $60B |
|
||
| Technology Distribution | 1 | $58B |
|
||
| Homebuilding | 1 | $35B |
|
||
| Technology Manufacturing | 1 | $35B |
|
||
Price history
+361.5% since first listed7 events — show timeline
- 2026-05-12 Listed $180,000 FSBO.com
- 2011-11-05 Listing Removed — Stellar MLS as Distributed by MLS Grid
- 2011-05-09 Listed $39,000 Stellar MLS as Distributed by MLS Grid
- 2005-05-24 Sold (Public Records) $130,000 Public Records
- 2005-05-17 Sold (MLS) $130,000 Stellar MLS as Distributed by MLS Grid
- 2005-04-06 Listed $140,000 Stellar MLS as Distributed by MLS Grid
- 1983-03-01 Sold (Public Records) $39,000 Public Records
Property tax history
+7.9%/yrLatest (2025): $2,774 · +2.8% YoY. Source: county tax records.
Cash-flow waterfall
monthlySold comps — $/sqft
last 12 mo · ≤1 miLoading sold comps…