400 SE 22nd St #1 · Fort Lauderdale, FL
Flood risk 4/10 · Minor
- FEMA flood zone
- AH
- Chance of flooding over 30 yrs
- 0.22%
- Est. flood insurance / yr
- $1,142 – $2,507
Fire risk 2/10 · Minimal
- Est. fire insurance / yr
- $947 – $1,759
Heat risk 10/10 · Severe
- Hot days now (above 105°F)
- 7 days/yr
- Hot days in 30 yrs
- 26 days/yr
Wind risk 10/10 · Severe
- Chance of severe wind over 30 yrs
- 99.0%
Air-quality risk 2/10 · Minimal
- Unhealthy air days now
- 1 days/yr
- Unhealthy air days in 30 yrs
- 1 days/yr
Risk factors via First Street. Map © Google.
Why this score? — see what drove the D grade
The composite is a weighted blend of 9 inputs, each scored 0–100. Each bar is that input's sub-score; the figure is the points it added to the 100-point composite (weight × sub-score).
- ARV discount +10.9/15.0
- Cash flow +7.4/30.0
- Appreciation +7.1/10.0
- Schools +4.1/10.0
- Livability +4.1/5.0
- Rent growth +3.6/5.0
- Condition / age +2.5/5.0
- 1% rule +2.1/10.0
- DSCR +1.5/10.0
$655,000
🖨 Deal sheet (PDF) 📄 Offer letter ✓ Due diligence
Listing remarks
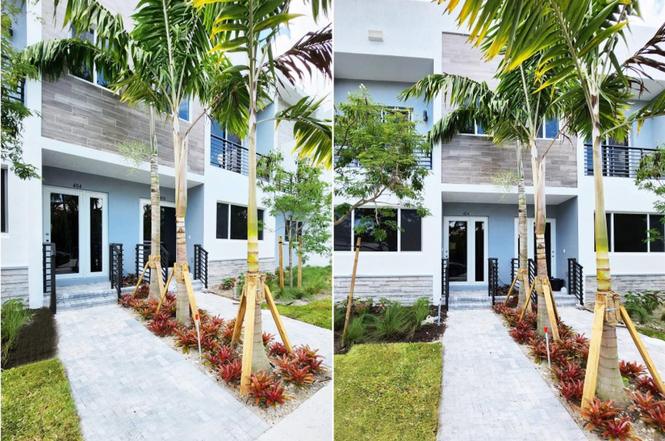
3 bedroom, 2.5 bath NEW CONSTRUCTION townhome with 2-car garage in boutique four-unit development in east Fort Lauderdale. BRAND NEW, never-lived-in, this townhome is totally turnkey and ready to occupy for an end-user. Also PERFECT for an investor to Airbnb or lease out annually. With modern design and open floorplan, each unit features high-end interiors, wood and tile floors, stainless appliances, glass shower enclosures, full size washer/dryer in laundry room. Ideally situated in east Fort Lauderdale (less than 10minutes to the beach, 5 to downtown or FLL International Airport).
Key facts
- 2 garage spots
- Built 2025
Neighborhood map
What this means for you Summary
Snapshot
- This is a 3-bed/2.5-bath townhouse listed at $655k.
Deal economics
- At list price, monthly cash flow is $-1k ($-12k/yr) — negative.
- To cash-flow at today's rent, offer at most $509k (22.3% below list).
- To meet the 1% rule (rent ≥ 1% of price), the offer needs to be $465k (29.1% below list).
- Recommended offer: $465k (29.1% below list) — sets the bar for 1% rule.
- Cap rate 4.7% vs local median 2.2% in Fort Lauderdale — top-decile yield for the area; either an underpriced asset or a hidden risk that comps aren't pricing in. Stress-test before assuming the spread holds.
Location & tenants
- Location reads 82/100 on livability (#78 in FL, #1,293 nationally) — a professional / high-income tenant draw. Strengths: crime A+, amenities A+, health & safety A+; Watch: cost of living D-.
- Broward (suburban): math 42% / reading 53% proficiency, ranked #46 of 73 in FL (top 63%) — families likely to look elsewhere, expect single-tenant / working-renter base with shorter leases.
- Zoned schools: Croissant Park Elementary School (math 36% / reading 37%, grade F, #1,656 of 2,144 statewide, top 78%, 692 students, 83% FRL); New River Middle School (math 36% / reading 44%, grade F, #368 of 571 statewide, top 65%, 1,587 students, 70% FRL); Stranahan High School (math 18% / reading 36%, grade F, #478 of 667 statewide, top 73%, 1,438 students, 77% FRL) — zoned schools average 77% FRL vs 51% district-wide (26 pts higher); higher-poverty schools than district average — tighter screening recommended.
- Zoned-school proficiency averages 34% at this address vs 48% district-wide (-13 pts) — the specific schools serving this property underperform the Broward average; the district grade overstates school quality for this exact location.
- Market conditions: Rents rising fast (+4.5%/yr); 406 active listings in the ZIP; 40 comparable units currently listed for rent nearby; rentals at typical pace (median 22d on market — plan ~3-4 weeks tenant-placement turnaround); solid renter incomes; 2,111 units permitted in Broward County in 2024 (1,265 in 5+ unit buildings).
- At $4,647/mo this rent would consume 58% of the median local household income ($97k/yr) (locally 770% of renters already pay >50% of income on rent) — very limited rent-growth headroom before tenants either downsize or default.
Forward outlook
- In year one you build about $32k of equity ($5k loan paydown + $27k appreciation (4.2% local appreciation)).
- Broward County population projected at +34% by 2050 — long-run rental-demand tailwind backs the buy-and-hold thesis.
- By year 2, paydown + projected appreciation supports a ~$51k cash-out refi (75% LTV) — recoverable capital for the next deal without selling this one.
Negotiation context
- Only 0 days on market — expect competitive offers; lowballing is unlikely to land.
Risks & watch-outs
- Watch-outs: flood insurance adds $152/mo.
- Climate carrying-cost: in FEMA flood zone AH (mandatory federal flood insurance); severe wind risk, 99% chance of damaging wind over 30y; extreme-heat days projected 7→26/yr by 2055 (HVAC capex compounding) — expect insurance premiums to compound above CPI over the hold.
Questions for the listing agent
- What do current leases actually rent for vs. the listed asking? Can we see a recent rent roll and the last 12 months of T-12 income?
- What's the actual annual flood-insurance premium (NFIP or private), and is the property in a SFHA with mandatory coverage?
- Is there a deadline driving the sale (1031 exchange, divorce, estate, relocation)? That informs how much negotiation room exists.
- Schools are B-rated — typically a magnet for longer-tenancy family renters. What's the average tenant stay here, and is there a school-zone premium baked into asking?
- The area grade is low — what's the realistic commute time and amenity access for the typical tenant pool here? Any planned neighborhood developments (good or bad) we should know about?
- What's the average days-on-market for RENTAL listings here right now (not sales)? A rising rental-DOM trend means longer vacancies and softer asking-rent achievability than the comps imply.
- What's the recent tenant-quality profile in this submarket — average credit score on applications, eviction rate, late-payment / NSF rate, and stable-employment percentage? A property-management company in the area should have these aggregated.
- How much new for-sale + rental construction is in the pipeline within 1–3 miles? Heavy new supply typically softens prices + rents 12–24 months out; constrained supply supports both.
Investment metrics
- 1% rule
- 0.71% ✗
- Cap rate
- 4.73%
- Cash-on-cash
- -5.60%
- DSCR
- 0.75
- GRM
- 11.7
CMA / ARV
- ARV (on-the-fly)
- $708,550
- Comps found
- 1
Show comp detail 1 sale within ~0.75 mi
| Address | Dist | Beds/Ba | Sqft | Sold | Price | $/sf | Match |
|---|---|---|---|---|---|---|---|
| 723 SE 16th Ct | 0.51mi | 3/3.5 | 1,762 (-5%) | 3mo | $675,000 | $383 | 62 |
Match score weights: distance 35% · size 25% · config 20% · recency 20%. Top-matched comps best support the ARV.
Projected returns pro-forma
4.15% appreciation · 4.54% rent growth · sell at horizon
- IRR
- 5.5%
- Equity multiple
- 1.34×
- Total profit
- $62,847
- Equity at exit
- $337,759
- IRR
- 8.7%
- Equity multiple
- 2.51×
- Total profit
- $277,523
- Equity at exit
- $557,000
Cash invested: $183,400 (down + closing). Projections, not guarantees.
Landlord ↔ Tenant lean methodology
- Overall (STATE)
- 87 Strongly Landlord-Friendly
- State Florida
- 87 Strongly Landlord-Friendly · R+3
- County
- — inherits STATE
- City
- — inherits STATE
ZIP-level market 33316
- Home prices YoY
- 1.3%
- Rents YoY
- 4.5%
- Active inventory
- 406
- Price-to-rent
- 11.7×
Monthly cashflow live
- Estimated rent
- $4,647 high interval (Pro) →
- Mortgage (P&I)
- −$3,435
- Tax est. 1.5%
- −$819 /mo · $9,825/yr
- Insurance
- −$273
- Flood insurance flood zone
- −$152 /mo · $1,824/yr
- HOA
- −$0
- Vacancy / Maint / Mgmt
- −$976
- Net cashflow
- $-1,008
Break-even live
Sensitivity live
| Price | -10% $-555 | -5% $-781 | +0% $-1,008 | +5% $-1,234 | +10% $-1,460 |
|---|---|---|---|---|---|
| Rent | -10% $-1,375 | -5% $-1,191 | +0% $-1,008 | +5% $-824 | +10% $-641 |
| Rate | -1.0pp $-678 | -0.5pp $-841 | base $-1,008 | +0.5pp $-1,177 | +1.0pp $-1,350 |
UW: 25.0% down · 7.5% · 30yr · 1.5% tax · 5.0% vac · 8.0% maint · 8.0% mgmt
Financing live
Cash to close
- Down payment
- $163,750
- Closing costs
- $19,650
- Reserves months
- —
- Total cash needed
- —
Loan-product check · same deal, 3 products live
Conventional
25% down · 7.5% · 30yr
- Down + closing
- —
- Monthly P&I
- —
- Monthly cashflow
- —
- DSCR
- —
- Eligible?
- —
Personal DTI + credit; lowest rate.
DSCR
20% down · 8.5% · 30yr
- Down + closing
- —
- Monthly P&I
- —
- Monthly cashflow
- —
- DSCR
- —
- Eligible?
- —
No personal income docs; deal must DSCR.
Hard money
10% down · 12.0% · 12mo
- Down + closing
- —
- Monthly P&I
- —
- Monthly cashflow
- —
- DSCR
- —
- Eligible?
- —
Short-term bridge; refi at stabilization.
Rent comps 40 comps
| Address | Beds | Baths | Sqft | Rent | $/sqft | DOM | Units | Dist |
|---|---|---|---|---|---|---|---|---|
| 2100 Miami Rd Unit 401 Fort Lauderdale, FL | 3.0 | 3.0 | 1707 | $5,100 | $2.99 | 7d | 1 | 0.23mi |
| 2100 Miami Rd Unit 401 Fort Lauderdale, FL | 3.0 | 3.0 | 1707 | $4,980 | $2.92 | 19d | 1 | 0.23mi |
| 2100 Miami Rd Unit 204 Fort Lauderdale, FL | 3.0 | 3.0 | 1780 | $4,895 | $2.75 | 26d | 1 | 0.23mi |
| 2100 Miami Rd Unit 204 Fort Lauderdale, FL | 3.0 | 3.0 | 1780 | $4,950 | $2.78 | 19d | 1 | 0.23mi |
| 2100 Miami Rd Unit 302 Fort Lauderdale, FL | 3.0 | 3.0 | 1724 | $4,980 | $2.89 | 7d | 1 | 0.23mi |
| 412 SE 17th St Fort Lauderdale, FL | 4.0 | 2.0 | 1722 | $3,250 | $1.89 | 26d | 1 | 0.41mi |
| 1812 Miami Rd Unit 1369665P Fort Lauderdale, FL | 3.0 | 3.0 | 2454 | $10,040 | $4.09 | 23d | 1 | 0.41mi |
| 410 SE 16th Ct Fort Lauderdale, FL | 3.0 | 1.0–2.0 | 1175 | $2,831 | $2.41 | 0d | 1 | 0.47mi |
| 713 SE 16th St #2 Fort Lauderdale, FL | 3.0 | 3.5 | 1942 | $4,000 | $2.06 | 26d | 1 | 0.60mi |
| 316 SW 16th St Unit B Fort Lauderdale, FL | 3.0 | 2.5 | 2124 | $4,250 | $2.00 | 12d | 1 | 0.72mi |
| 316 SW 16th St Unit B Fort Lauderdale, FL | 3.0 | 2.5 | 2124 | $3,650 | $1.72 | 6d | 1 | 0.72mi |
| 400 SE 14th St Unit A Fort Lauderdale, FL | 3.0 | 2.0 | 1826 | $2,580 | $1.41 | 15d | 1 | 0.73mi |
| 325 SW 16th St Fort Lauderdale, FL | 4.0 | 4.0 | 2454 | $6,900 | $2.81 | 26d | 1 | 0.77mi |
| 1508 SW 4th Ave #1506 Fort Lauderdale, FL | 3.0 | 3.0 | 2556 | $4,500 | $1.76 | 9d | 1 | 0.79mi |
| 1508 SW 4th Ave Fort Lauderdale, FL | 3.0 | 3.5 | 2583 | $4,500 | $1.74 | 16d | 1 | 0.79mi |
| 1508 SW 4th Ave Fort Lauderdale, FL | 3.0 | 3.5 | 2583 | $4,500 | $1.74 | 15d | 1 | 0.79mi |
| 407 SE 13th St Fort Lauderdale, FL | 3.0 | 3.5 | 2048 | $4,000 | $1.95 | 26d | 1 | 0.82mi |
| 1430 SW 4th Ave Unit 1430 Fort Lauderdale, FL | 4.0 | 3.5 | 2120 | $5,000 | $2.36 | 26d | 1 | 0.85mi |
| 1490 SE 15th St #104 Fort Lauderdale, FL | 2.0 | 2.0 | 1459 | $4,250 | $2.91 | 19d | 1 | 0.85mi |
| 324 SW 14th Ct Unit 1 Fort Lauderdale, FL | 4.0 | 3.5 | 1910 | $4,500 | $2.36 | 22d | 1 | 0.85mi |
| 619 SW 17th St Fort Lauderdale, FL | 3.0 | 2.5 | 2538 | $5,500 | $2.17 | 26d | 1 | 0.85mi |
| 619 SW 17th St Unit 618 Fort Lauderdale, FL | 3.0 | 2.0 | 2538 | $5,500 | $2.17 | 26d | 1 | 0.85mi |
| 1500 SW 6th Ave Unit 1500 Fort Lauderdale, FL | 2.0 | 1.5 | 1811 | $2,800 | $1.55 | 7d | 1 | 0.90mi |
| 820 SE 12th Ct Unit 1 Fort Lauderdale, FL | 2.0 | 1.0 | 2094 | $2,500 | $1.19 | 26d | 1 | 0.90mi |
| 824 SE 12th Ct Unit 840 Fort Lauderdale, FL | 3.0 | 2.5 | 1852 | $5,000 | $2.70 | 22d | 1 | 0.90mi |
| 824 SE 12th Ct Unit 852 Fort Lauderdale, FL | 2.0 | 1.5 | 2000 | $5,000 | $2.50 | 22d | 1 | 0.90mi |
| 824 SE 12th Ct Unit 850 Fort Lauderdale, FL | 4.0 | 2.5 | 2050 | $8,250 | $4.02 | 26d | 1 | 0.90mi |
| 824 SE 12th Ct Unit 828 Fort Lauderdale, FL | 4.0 | 2.5 | 2050 | $6,500 | $3.17 | 22d | 1 | 0.90mi |
| 824 SE 12th Ct Unit 854 Fort Lauderdale, FL | 3.0 | 2.5 | 2000 | $6,500 | $3.25 | 22d | 1 | 0.90mi |
| 817 SE 12th Ct #1 Fort Lauderdale, FL | 2.0 | 2.5 | 1328 | $2,500 | $1.88 | 26d | 1 | 0.92mi |
| 607 SW 15th St Fort Lauderdale, FL | 3.0 | 2.0 | 1351 | $6,500 | $4.81 | 26d | 1 | 0.95mi |
| 1836 SW 9th Ave Fort Lauderdale, FL | 3.0 | 3.0 | 1581 | $4,500 | $2.85 | 26d | 1 | 0.95mi |
| 820 SE 12th St #1 Fort Lauderdale, FL | 2.0 | 1.0 | 2094 | $2,300 | $1.10 | 6d | 1 | 0.96mi |
| 820 SE 12th St #1 Fort Lauderdale, FL | 2.0 | 1.0 | 2094 | $2,500 | $1.19 | 26d | 1 | 0.96mi |
| 800 SE 11th Ct Fort Lauderdale, FL | 4.0 | 2.5 | 1787 | $10,000 | $5.60 | 14d | 1 | 0.98mi |
| 843 SW 29th St Unit 843 Fort Lauderdale, FL | 4.0 | 3.5 | 2447 | $5,250 | $2.15 | 3d | 1 | 0.98mi |
| 1436 SE 13th St Fort Lauderdale, FL | 4.0 | 3.5 | 1725 | $20,000 | $11.59 | 26d | 1 | 0.98mi |
| 1516 SW 8th Ave Unit 1475643P Fort Lauderdale, FL | 3.0 | 2.0 | 1302 | $7,742 | $5.95 | 0d | 1 | 0.99mi |
| 508 SW 13th St Fort Lauderdale, FL | 3.0 | 2.0 | 1680 | $4,500 | $2.68 | 26d | 1 | 1.02mi |
| 1617 SE 15th St #605 Fort Lauderdale, FL | 2.0 | 2.0 | 1240 | $2,400 | $1.94 | 26d | 1 | 1.04mi |
Listing history 2 events
-
2026-02-20historical
-
2024-02-15$655,000
ⓘ Source: listings_history table (triggers on properties + properties_extension) + one-shot
backfill from property_details.listing_events for pre-trigger history.
Climate risk First Street
- Flood 4/10 Moderate FEMA zone AH · 22% chance over 30 yrs
- Wildfire 2/10 Low
- Heat 10/10 Extreme 7 d/yr ≥105°F today · 26 d/yr by 30 yrs out
- Wind 10/10 Extreme 99% chance of damaging wind over 30 yrs
- Air quality 2/10 Low 1 unhealthy d/yr today · 1 by 30 yrs out
Nearby sold comps map
Loading sold comps map…
Walkable amenities ~0.75 mi
Loading nearby amenities…
Taxation est. · year 1
- Rental income
- $55,761
- − Mortgage interest
- −$36,690
- − Property taxes
- −$9,825
- − Insurance
- −$5,100
- − Repairs & maintenance
- −$4,461
- − Management
- −$4,461
- − Depreciation
- −$19,055
- Taxable loss
- −$23,830
- Est. tax savings @ 24.0%
- +$5,719
- After-tax cash flow
- $-6,373/yr
For passive investors: Depreciation is non-cash, so a rental often shows a tax loss while cash-flowing — sheltering income. Rental losses are passive: they offset passive income freely, and up to $25,000/yr can offset ordinary (W-2) income if you actively participate and your MAGI is under $100k (phasing out to $0 by $150k); unused losses carry forward. On sale, claimed depreciation is recaptured at up to 25%, and gains may owe capital-gains tax (a 1031 exchange can defer both). Figures are a year-1 estimate at your 24.0% rate — not tax advice; consult a CPA.
Schools (NCES district)
- District
- Broward
- NCES district ID
- 1200180
- Math proficiency
- 42% ▼ -18.00%
- Reading proficiency
- 53% ▼ -5.00%
- Median HH income
- $52,139
- Composite
- 40.88/100
- National rank
- #3621
- State rank
- #46 of 73 in FL
Livability — Fort Lauderdale
- Score
- 82/100
- State rank
- #78
- US rank
- #1293
Category grades
Schools grade is shown separately in the Schools card above.
Census & demographics
- Census place
- Fort Lauderdale, FL
- County
- Broward County · 1,963,430 people
- City population
- 235,769
- Metro
- Miami-Fort Lauderdale-Pompano Beach, FL
- Population (ZIP)
- 12,437
- Household income
- $96,641
- Rent vs Own
- Severe rent burden
- 770.0
Population outlook (Broward County) Hauer SSP2
- Today (2025)
- 2,207,033 people
- By 2030
- 2,360,704 · +7.0%
- By 2040
- 2,661,208 · +20.6%
- By 2050
- 2,946,698 · +33.5%
- By 2075
- 3,602,273 · +63.2%
- By 2100
- 3,970,984 · +79.9%
Race, ethnicity, and origin ACS 2023
- Neighborhood character
- Predominantly White (70%)
- Race & ethnicity
- White 70% Hispanic / Latino 17% Two or more races 8% Black 7% Asian 3% Native American 1%
- Hispanic origin (detail)
- Mexican 1% Puerto Rican 3% Cuban 3%
- Common ancestry
- Romanian 3% Italian 3% Slovak 3%
- Foreign-born
- 22% · Canada, Jamaica, Dominican Republic
- Languages at home
- 80% English-only · Spanish 13% Tagalog/Filipino 2% Other Indo-European 1%
Political lean MEDSL · Broward
- 2024 margin
- D (+17.0) · D 58.0% · R 41.0%
- 2008→2024 swing
- -17.8pp toward R · 2008: 34.7pp · 2024: 17.0pp
- All cycles
- 2024: D+17.0 2020: D+29.8 2016: D+35.0 2012: D+34.9 2008: D+34.7
Not yet ingested
- Civics
- —
Market trends
- HPI YoY
- ▲ 4.15%
- Current HPI
- 319.5598
- Rent YoY
- ▲ 4.54%
- Metro
- Miami-Fort Lauderdale-Pompano Beach, FL
- State GDP YoY
- ▲ 3.28%
- F500 in state
- 36
Industry mix (Fortune 500 HQ in FL)
| Industry | F500 HQs | Revenue |
|---|---|---|
| Industrial Technology | 2 | $29B |
|
||
| Insurance | 2 | $17B |
|
||
| Retail | 1 | $60B |
|
||
| Technology Distribution | 1 | $58B |
|
||
| Homebuilding | 1 | $35B |
|
||
| Technology Manufacturing | 1 | $35B |
|
||
Price history
2 events — show timeline
- 2026-02-20 Listing Removed — Beaches MLS
- 2024-02-15 Listed $655,000 Beaches MLS
Cash-flow waterfall
monthlySold comps — $/sqft
last 12 mo · ≤1 miLoading sold comps…