2811 Village Blvd #202 · West Palm Beach, FL
Flood risk 1/10 · Minimal
- FEMA flood zone
- X (unshaded)
- Chance of flooding over 30 yrs
- 0.0%
- Est. flood insurance / yr
- $507 – $1,088
Fire risk 1/10 · Minimal
- Est. fire insurance / yr
- $947 – $1,759
Heat risk 9/10 · Severe
- Hot days now (above 105°F)
- 5 days/yr
- Hot days in 30 yrs
- 17 days/yr
Wind risk 10/10 · Severe
- Chance of severe wind over 30 yrs
- 99.0%
Air-quality risk 2/10 · Minimal
- Unhealthy air days now
- 1 days/yr
- Unhealthy air days in 30 yrs
- 1 days/yr
Risk factors via First Street. Map © Google.
Why this score? — see what drove the C+ grade
The composite is a weighted blend of 9 inputs, each scored 0–100. Each bar is that input's sub-score; the figure is the points it added to the 100-point composite (weight × sub-score).
- Cash flow +22.2/30.0
- 1% rule +10.0/10.0
- ARV discount +7.5/15.0
- DSCR +7.1/10.0
- Schools +4.3/10.0
- Livability +4.1/5.0
- Rent growth +2.5/5.0
- Condition / age +2.5/5.0
- Appreciation +0.0/10.0
$215,000
🖨 Deal sheet 📄 Offer letter ✓ Due diligence
Listing remarks MLS
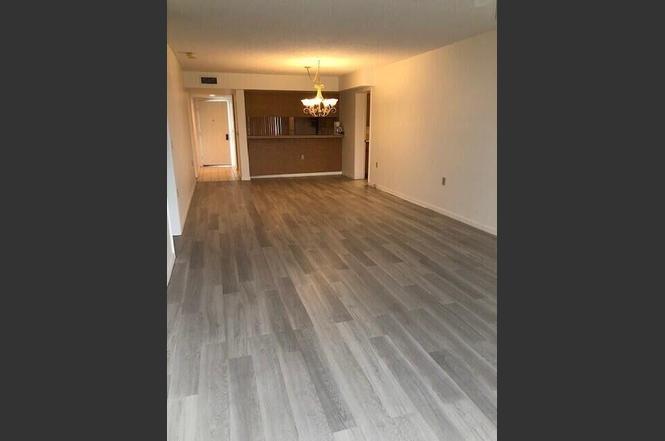
Very rare opporturnity to purchase a direct golfview unit with awesome views with over $20,000 worth of new expensive furnature, turnkey unit & all new appliances, a/c, waterheater, carpet, paint, ready to move in, plus 4pools/clubhses w/ game & exerzise rm.
Key facts
- Eat in kitchen
- Large laundry room
- View of lake
Tags
Property features AI
Finance
- Other: Directions: 45th St S to Village Blvd, turn to 2nd entrance of Whitehall Bldg 7
- Financial info: Pets not allowed; Community contains 480 units
- HOA & community: Has association; Monthly HOA fee (approx.); Association amenities: Clubhouse, Elevators, Fitness center, Pool; HOA includes cable TV and water
Exterior
- Parking: Assigned parking; Guest parking
- Security: Smoke detector(s)
- Utilities: Public water; Three-phase electric; Cable available; Water available
- Home design: Condominium; Resale property; Faces east
- Construction: CBS construction; 4-story building; Building area ~1,442 (public records)
- Exterior features: Not waterfront
Interior
- Kitchen: Disposal; Dishwasher; Electric range; Refrigerator; Electric water heater
- Bedrooms: 2 bedrooms on the main level
- Flooring: Ceramic tile; Laminate
- Bathrooms: 2 full bathrooms on the main level
- Heating & cooling: Central heating; Central air conditioning
- Interior features: Entrance foyer; Walk-in closet(s); Smoke detector(s)
- Laundry & utility: Indoor laundry
Neighborhood map
What this means for you Summary
Snapshot
- This is a 2-bed/2.0-bath condo listed at $215k.
Deal economics
- At list price, monthly cash flow is $351 ($4k/yr) — positive.
- The deal already cash-flows at list — no discount required.
- Meets the 1% rule at list price ($4k rent vs $215k).
- Recommended offer: $189k (12.0% below list) — sets the bar for market timing.
- Cap rate 8.2% vs local median 3.8% in West Palm Beach — top-decile yield for the area; either an underpriced asset or a hidden risk that comps aren't pricing in. Stress-test before assuming the spread holds.
Location & tenants
- Location reads 82/100 on livability (#75 in FL, #1,255 nationally) — a professional / high-income tenant draw. Strengths: commute A+, housing A+, health & safety A+; Watch: employment C-, crime F.
- Palm Beach (suburban): math 46% / reading 53% proficiency, ranked #34 of 73 in FL (top 47%) — families likely to look elsewhere, expect single-tenant / working-renter base with shorter leases.
- Market conditions: Rents soft (-0.1%/yr); 189 active listings in the ZIP; 17 comparable units currently listed for rent nearby; rentals at typical pace (median 22d on market — plan ~3-4 weeks tenant-placement turnaround); 3,974 units permitted in Palm Beach County in 2024 (1,012 in 5+ unit buildings).
- At $3,508/mo this rent would consume 63% of the median local household income ($67k/yr) (locally 1333% of renters already pay >50% of income on rent) — very limited rent-growth headroom before tenants either downsize or default.
Forward outlook
- Local home prices are declining (-3.0%/yr); year-one equity from $1k of loan paydown is wiped out by about $6k of value loss. Plan a longer hold.
- Palm Beach County population projected at +30% by 2050 — long-run rental-demand tailwind backs the buy-and-hold thesis.
Negotiation context
- It's been on market 399 days — a 12% lower offer ($189k) is reasonable based on typical stale-listing flexibility.
- 5 sale attempts since 23y ago with the ask held roughly flat each time — persistent listings suggest the price (not the market) is what's stuck; bring a comps-based counter.
- Current owner paid $110k; list at $215k implies a 95% gain — meaningful room to come down on a strong offer.
Risks & watch-outs
- Watch-outs: HOA is 25% of rent.
- Climate carrying-cost: severe wind risk, 99% chance of damaging wind over 30y; extreme-heat days projected 5→17/yr by 2055 (HVAC capex compounding) — expect insurance premiums to compound above CPI over the hold.
Questions for the listing agent
- It's been on market 399 days. Have you received any prior offers? Is the seller open to a 12% concession, seller financing, or rate buy-down credit?
- What does the HOA fee cover, when was the last increase, and are there any pending special assessments or reserve-fund shortfalls?
- Any open or pending special assessments — roof, HVAC, plumbing, elevator, façade? What's the per-unit balance and payoff schedule, and is the seller paying it off at close or rolling it to the buyer?
- Why hasn't it sold? Are there any deal-killer items the seller is aware of (foundation, flood, title, zoning, code violations)?
- Is there a deadline driving the sale (1031 exchange, divorce, estate, relocation)? That informs how much negotiation room exists.
- Crime grade is F in this area — have there been break-ins, vandalism, or insurance claims at this property in the last 3 years? What carrier currently insures it and at what premium?
- What's the average days-on-market for RENTAL listings here right now (not sales)? A rising rental-DOM trend means longer vacancies and softer asking-rent achievability than the comps imply.
- What's the recent tenant-quality profile in this submarket — average credit score on applications, eviction rate, late-payment / NSF rate, and stable-employment percentage? A property-management company in the area should have these aggregated.
- How much new apartment / multifamily construction is in the pipeline within 1–3 miles? Heavy new supply (>2% of stock underway) typically softens rents 12–24 months out; light construction supports rent growth.
Investment metrics
- 1% rule
- 1.63% ✓
- Cap rate
- 8.25%
- Cash-on-cash
- 6.99%
- DSCR
- 1.31
- GRM
- 5.1
CMA / ARV
No comps found within radius.
Projected returns pro-forma
-3.0% appreciation · 0.0% rent growth · sell at horizon
- IRR
- -10.6%
- Equity multiple
- 0.63×
- Total profit
- $-22,168
- Equity at exit
- $32,057
- IRR
- -9.4%
- Equity multiple
- 0.54×
- Total profit
- $-27,740
- Equity at exit
- $18,589
Cash invested: $60,200 (down + closing). Projections, not guarantees.
Landlord ↔ Tenant lean methodology
- Overall (STATE)
- 87 Strongly Landlord-Friendly
- State Florida
- 87 Strongly Landlord-Friendly · R+3
- County
- — inherits STATE
- City
- — inherits STATE
ZIP-level market 33409
- Home prices YoY
- -25.6%
- Rents YoY
- -0.1%
- Active inventory
- 189
- Price-to-rent
- 5.1×
Monthly cashflow live
- Estimated rent
- $3,508 high interval (Pro) →
- Mortgage (P&I)
- −$1,127
- Tax from tax record
- −$325 /mo · $3,898/yr
- Insurance
- −$90
- HOA
- −$879
- Vacancy / Maint / Mgmt
- −$737
- Net cashflow
- $351
Break-even live
UW: 25.0% down · 7.5% · 30yr · 1.5% tax · 5.0% vac · 8.0% maint · 8.0% mgmt
Financing live
Cash to close
- Down payment
- $53,750
- Closing costs
- $6,450
- Reserves months
- —
- Total cash needed
- —
Loan-product check · same deal, 3 products live
Conventional
25% down · 7.5% · 30yr
- Down + closing
- —
- Monthly P&I
- —
- Monthly cashflow
- —
- DSCR
- —
- Eligible?
- —
Personal DTI + credit; lowest rate.
DSCR
20% down · 8.5% · 30yr
- Down + closing
- —
- Monthly P&I
- —
- Monthly cashflow
- —
- DSCR
- —
- Eligible?
- —
No personal income docs; deal must DSCR.
Hard money
10% down · 12.0% · 12mo
- Down + closing
- —
- Monthly P&I
- —
- Monthly cashflow
- —
- DSCR
- —
- Eligible?
- —
Short-term bridge; refi at stabilization.
Rent comps 17 comps
| Address | Beds | Baths | Sqft | Rent | $/sqft | DOM | Units | Dist |
|---|---|---|---|---|---|---|---|---|
| 2480 Presidential Way #1903 West Palm Beach, FL | 2.0 | 2.0 | 1855 | $4,650 | $2.51 | 24d | 1 | 0.47mi |
| 2480 Presidential Way #902 West Palm Beach, FL | 2.0 | 2.0 | 1855 | $4,650 | $2.51 | 5d | 1 | 0.47mi |
| 2450 Presidential Way #7 West Palm Beach, FL | 2.0 | 2.0 | 1855 | $4,700 | $2.53 | 2d | 1 | 0.51mi |
| 2450 Presidential Way #7 West Palm Beach, FL | 2.0 | 2.0 | 1855 | $4,700 | $2.53 | 24d | 1 | 0.51mi |
| 2400 Presidential Way #1906 West Palm Beach, FL | 1.0 | 2.0 | 1294 | $3,000 | $2.32 | 24d | 1 | 0.63mi |
| 2425 Presidential Way West Palm Beach, FL | 2.0 | 2.0 | 1294 | $4,500 | $3.48 | 24d | 1 | 0.64mi |
| 1991 Presidential Way West Palm Beach, FL | 3.0 | 2.0 | 1485 | $4,905 | $3.30 | 16d | 1 | 0.73mi |
| 4400 Portofino Way West Palm Beach, FL | 1.0–3.0 | 1.0–2.0 | 1222 | $2,528 | $2.07 | 17d | 60 | 0.88mi |
| 1912 Stratford Way West Palm Beach, FL | 2.0 | 2.5 | 1350 | $3,000 | $2.22 | 24d | 1 | 0.88mi |
| 1979 Brandywine Rd Unit 1979-108 West Palm Beach, FL | 3.0 | 2.0 | 1395 | $3,205 | $2.30 | 24d | 1 | 0.88mi |
| 1714 Consulate Pl #101 West Palm Beach, FL | 3.0 | 3.0 | 1377 | $3,000 | $2.18 | 24d | 1 | 0.92mi |
| 1900 Consulate Pl #1005 West Palm Beach, FL | 2.0 | 2.0 | 1557 | $4,900 | $3.15 | 15d | 1 | 0.93mi |
| 3590 Village Blvd West Palm Beach, FL | 1.0–3.0 | 1.0–2.0 | 1074 | $2,798 | $2.60 | 2d | 29 | 0.94mi |
| 195 River Grove Way West Palm Beach, FL | 2.0 | 1.0–2.0 | 828 | $3,002 | $3.63 | 2d | 18 | 1.06mi |
| 4567 Brook Dr West Palm Beach, FL | 3.0 | 2.0 | 1528 | $3,000 | $1.96 | 24d | 1 | 1.11mi |
| 4385 Willow Brook Cir West Palm Beach, FL | 3.0 | 2.0 | 1468 | $3,200 | $2.18 | 22d | 1 | 1.24mi |
| 1211 Pine Sage Cir West Palm Beach, FL | 3.0 | 2.0 | 1367 | $3,200 | $2.34 | 5d | 1 | 1.33mi |
HOA detail condo
- Monthly dues
- $879 · $10,548/yr
- Likely covers
- waterpool
- Assessments
- None detected in remarks — confirm with the listing agent.
Listing history 28 events
-
2026-06-18days on market $215,000 Active 399 DOM
-
2026-06-17days on market $215,000 Active 398 DOM
-
2026-06-16days on market $215,000 Active 397 DOM
-
2026-06-15days on market $215,000 Active 396 DOM
-
2026-06-13days on market $215,000 Active 394 DOM
-
2026-06-09days on market $215,000 Active 390 DOM
-
2026-06-07days on market $215,000 Active 388 DOM
-
2026-06-04days on market $215,000 Active 385 DOM
-
2026-06-03days on market $215,000 Active 384 DOM
-
2026-06-01days on market $215,000 Active 382 DOM
-
2026-05-31days on market $215,000 Active 381 DOM
-
2025-12-05price $215,000
-
2025-12-05status Active
-
2025-09-04historical
-
2025-02-10$225,000 Active
-
2013-03-01soldstatus $110,000
-
2012-12-07historical
-
2012-05-02$104,900
-
2010-05-17soldstatus $102,500
-
2010-05-07soldstatus $102,500 268-char remark
Show marketing remark (268 chars)
Very rare opporturnity to purchase a direct golfview unit with awesome views with over $20,000 worth of new expensive furnature, turnkey unit & all new appliances, a/c, waterheater, carpet, paint, ready to move in, plus 4pools/clubhses w/ game & exerzise rm.
-
2010-04-15historical 268-char remark
Show marketing remark (268 chars)
Very rare opporturnity to purchase a direct golfview unit with awesome views with over $20,000 worth of new expensive furnature, turnkey unit & all new appliances, a/c, waterheater, carpet, paint, ready to move in, plus 4pools/clubhses w/ game & exerzise rm.
-
2010-01-19$129,900 268-char remark
Show marketing remark (268 chars)
Very rare opporturnity to purchase a direct golfview unit with awesome views with over $20,000 worth of new expensive furnature, turnkey unit & all new appliances, a/c, waterheater, carpet, paint, ready to move in, plus 4pools/clubhses w/ game & exerzise rm.
-
2003-09-10soldstatus $119,000
-
2003-08-29soldstatus $119,000
-
2003-06-12historical
-
2003-05-20$125,000
-
2002-03-19soldstatus $85,000
-
1987-01-01soldstatus $73,900
ⓘ Source: listings_history table (triggers on properties + properties_extension) + one-shot
backfill from property_details.listing_events for pre-trigger history.
Tax reassessment forecast FL · Resets to sale price
- Current annual tax
- $3,898 · $325/mo
- Projected year-2 tax
- $3,898 · $325/mo
- Expected delta
- $0/yr ($0/mo · -0.0%)
ⓘ Screening estimate from a state-policy table — verify with the county assessor before closing.
Climate risk First Street
- Flood 1/10 Low FEMA zone X (unshaded) · 0% chance over 30 yrs
- Wildfire 1/10 Low
- Heat 9/10 Extreme 5 d/yr ≥105°F today · 17 d/yr by 30 yrs out
- Wind 10/10 Extreme 99% chance of damaging wind over 30 yrs
- Air quality 2/10 Low 1 unhealthy d/yr today · 1 by 30 yrs out
Nearby sold comps map
Loading sold comps map…
Walkable amenities ~0.75 mi
Loading nearby amenities…
Taxation est. · year 1
- Rental income
- $42,097
- − Mortgage interest
- −$12,043
- − Property taxes
- −$3,898
- − Insurance
- −$1,075
- − Repairs & maintenance
- −$3,368
- − Management
- −$3,368
- − HOA
- −$10,548
- − Depreciation
- −$6,255
- Taxable income
- $1,543
- Est. tax owed @ 24.0%
- −$370
- After-tax cash flow
- $3,836/yr
For passive investors: Depreciation is non-cash, so a rental often shows a tax loss while cash-flowing — sheltering income. Rental losses are passive: they offset passive income freely, and up to $25,000/yr can offset ordinary (W-2) income if you actively participate and your MAGI is under $100k (phasing out to $0 by $150k); unused losses carry forward. On sale, claimed depreciation is recaptured at up to 25%, and gains may owe capital-gains tax (a 1031 exchange can defer both). Figures are a year-1 estimate at your 24.0% rate — not tax advice; consult a CPA.
Schools (NCES district)
- District
- Palm Beach
- NCES district ID
- 1201500
- Math proficiency
- 46% ▼ -16.00%
- Reading proficiency
- 53% ▼ -4.00%
- Median HH income
- $53,943
- Composite
- 42.72/100
- National rank
- #3160
- State rank
- #34 of 73 in FL
Livability — West Palm Beach
- Score
- 82/100
- State rank
- #75
- US rank
- #1255
Category grades
Schools grade is shown separately in the Schools card above.
Census & demographics
- Census place
- West Palm Beach, FL
- County
- Palm Beach County · 1,438,312 people
- City population
- 222,012
- Metro
- Miami-Fort Lauderdale-Pompano Beach, FL
- Population (ZIP)
- 33,489
- Household income
- $67,073
- Rent vs Own
- Severe rent burden
- 1333.0
Population outlook (Palm Beach County) Hauer SSP2
- Today (2025)
- 1,637,487 people
- By 2030
- 1,743,255 · +6.5%
- By 2040
- 1,948,712 · +19.0%
- By 2050
- 2,132,979 · +30.3%
- By 2075
- 2,530,027 · +54.5%
- By 2100
- 2,706,979 · +65.3%
Race, ethnicity, and origin ACS 2023
- Neighborhood character
- Highly diverse neighborhood (Simpson 0.70)
- Race & ethnicity
- Hispanic / Latino 36% Black 31% White 27% Two or more races 21% Asian 2%
- Hispanic origin (detail)
- Mexican 4% Puerto Rican 4% Cuban 8% Dominican 1%
- Common ancestry
- Hispanic 8% Romanian 1% Lithuanian 1%
- Foreign-born
- 34% · Canada, Jamaica
- Languages at home
- 55% English-only · Spanish 30% French/Haitian/Cajun 10% Other Indo-European 2%
Political lean MEDSL · Palm Beach
- 2024 margin
- Toss-up / Even · D 50.0% · R 49.2%
- 2008→2024 swing
- -22.1pp toward R · 2008: 22.9pp · 2024: 0.8pp
- All cycles
- 2024: D+0.8 2020: D+12.8 2016: D+15.3 2012: D+17.0 2008: D+22.9
Not yet ingested
- Civics
- —
Market trends
- HPI YoY
- ▼ -128.54%
- Current HPI
- 374.2506
- Rent YoY
- ▼ -0.15%
- Metro
- Miami-Fort Lauderdale-Pompano Beach, FL
- State GDP YoY
- ▲ 3.28%
- F500 in state
- 36
Industry mix (Fortune 500 HQ in FL)
| Industry | F500 HQs | Revenue |
|---|---|---|
| Industrial Technology | 2 | $29B |
|
||
| Insurance | 2 | $17B |
|
||
| Retail | 1 | $60B |
|
||
| Technology Distribution | 1 | $58B |
|
||
| Homebuilding | 1 | $35B |
|
||
| Technology Manufacturing | 1 | $35B |
|
||
Price history
+190.9% since first listed17 events — show timeline
- 2025-12-05 Price Changed $215,000 Beaches MLS
- 2025-12-05 Relisted — Beaches MLS
- 2025-09-04 Listing Removed — Beaches MLS
- 2025-02-10 Listed $225,000 Beaches MLS
- 2013-03-01 Sold (Public Records) $110,000 Public Records
- 2012-12-07 Listing Removed — Beaches MLS
- 2012-05-02 Listed $104,900 Beaches MLS
- 2010-05-17 Sold (Public Records) $102,500 Public Records
- 2010-05-07 Sold (MLS) $102,500 Beaches MLS
- 2010-04-15 Listing Removed — Beaches MLS
- 2010-01-19 Listed $129,900 Beaches MLS
- 2003-09-10 Sold (Public Records) $119,000 Public Records
- 2003-08-29 Sold (MLS) $119,000 Beaches MLS
- 2003-06-12 Listing Removed — Beaches MLS
- 2003-05-20 Listed $125,000 Beaches MLS
- 2002-03-19 Sold (Public Records) $85,000 Public Records
- 1987-01-01 Sold (Public Records) $73,900 Public Records
Property tax history
+11.5%/yrLatest (2025): $3,898 · +3.1% YoY. Source: county tax records.
Cash-flow waterfall
monthlySold comps — $/sqft
last 12 mo · ≤1 miLoading sold comps…