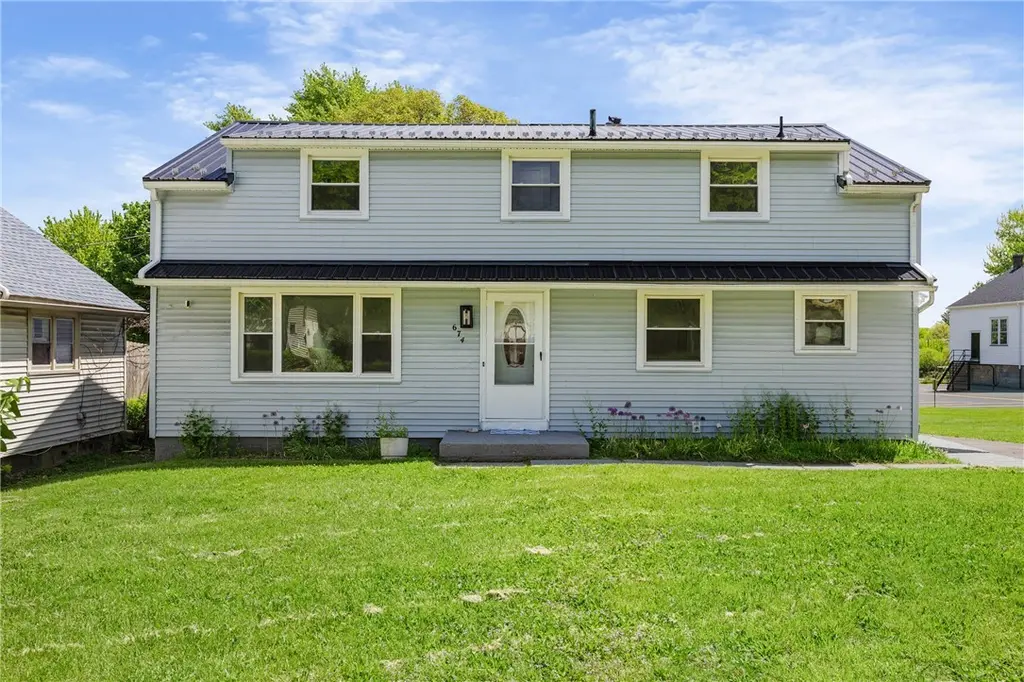
674 Merchants Rd · Rochester, NY
Flood risk 1/10 · Minimal
- FEMA flood zone
- X (unshaded)
- Chance of flooding over 30 yrs
- 0.0%
- Est. flood insurance / yr
- $473 – $860
Fire risk 3/10 · Minor
- Est. fire insurance / yr
- $691 – $1,283
Heat risk 2/10 · Minimal
- Hot days now (above 96°F)
- 7 days/yr
- Hot days in 30 yrs
- 15 days/yr
Wind risk 1/10 · Minimal
- Chance of severe wind over 30 yrs
- —
Air-quality risk 2/10 · Minimal
- Unhealthy air days now
- 1 days/yr
- Unhealthy air days in 30 yrs
- 2 days/yr
Risk factors via First Street. Map © Google.
Why this score? — see what drove the D grade
The composite is a weighted blend of 9 inputs, each scored 0–100. Each bar is that input's sub-score; the figure is the points it added to the 100-point composite (weight × sub-score).
- Cash flow +15.1/30.0
- ARV discount +7.6/15.0
- DSCR +4.6/10.0
- Rent growth +4.5/5.0
- Livability +3.8/5.0
- 1% rule +3.6/10.0
- Condition / age +2.5/5.0
- Schools +1.9/10.0
- Appreciation +0.0/10.0
$244,900
🖨 Deal sheet (PDF) 📄 Offer letter ✓ Due diligence
Listing remarks
Welcome to 674 Merchants Road! This beautifully updated home offers 4+ bedrooms and 2.5 bathrooms, providing exceptional space and flexibility for today's lifestyle. updated kitchen features brand-new appliances, modern finishes, and ample cabinet space. Both full bathrooms and the half bath have been updated. Enjoy new flooring throughout the home along with fresh paint from top to bottom, creating a truly move-in-ready experience. Additional improvements include a durable metal roof for long-term peace of mind and new driveway 100 feet long 10 feet wide 2025. Situated on just over half an acre, the property features a spacious backyard with plenty of room for entertaining, gardening, recr
Key facts
- Durable metal roof
- Spacious backyard
- New flooring
Tags
Property features AI
Exterior
- Parking: Attached garage; 2 garage spaces
- Utilities: Public water (connected); Sewer connected
- Home design: 3-story existing residence; Vinyl siding; Metal roof
- Construction: Block foundation
- Exterior features: Blacktop driveway; Rectangular residential lot, 65 x 346
Interior
- Kitchen: Electric oven; Electric range; Refrigerator
- Bedrooms: Bedrooms included in the total room count (11 rooms total)
- Flooring: Hardwood; Tile; Vinyl; Varies
- Bathrooms: 2 full bathrooms; 1 half bathroom
- Heating & cooling: Gas forced-air heating; Central air conditioning
- Interior features: Den; Separate/formal dining room; Eat-in kitchen; Separate/formal living room; Partially finished basement
- Laundry & utility: Washer and dryer; Laundry located in basement; Gas water heater
Neighborhood map
What this means for you Summary
Snapshot
- This is a 4-bed/1.5-bath single-family listed at $245k.
Deal economics
- At list price, monthly cash flow is $81 ($970/yr) — positive.
- The deal already cash-flows at list — no discount required.
- To meet the 1% rule (rent ≥ 1% of price), the offer needs to be $211k (13.9% below list).
- Recommended offer: $211k (13.9% below list) — sets the bar for 1% rule.
- Cap rate 6.7% vs local median 9.3% in Rochester — below-typical yield; the buyer is paying a premium for something (appreciation thesis, condition, location) that the cap rate doesn't capture.
Location & tenants
- Location reads 76/100 on livability (#222 in NY, #3,482 nationally) — a middle-class / working-renter tenant base. Strengths: commute A+, cost of living A+, housing A+; Watch: crime F, employment F.
- Rochester City School District (urban): math 21% / reading 26% proficiency, ranked #589 of 590 in NY (top 100%) — low school quality limits family demand, transient renter base, plan for 1-2y turnover; 82% free/reduced lunch — lower-income household profile, screen leases tightly.
- Zoned schools: Joseph C Wilson Foundation Academy (math 8% / reading 17%, grade F, #2,049 of 2,108 statewide, top 98%, 404 students, 91% FRL); East Lower School (math 2% / reading 22%, grade F, #715 of 729 statewide, top 98%, 304 students, 86% FRL); Edison Career And Technology High School (math 44% / reading 50%, grade D-, #1,007 of 1,100 statewide, top 93%, 1,233 students, 91% FRL).
- Market conditions: Rents rising fast (+7.9%/yr); 199 active listings in the ZIP; 3 comparable units currently listed for rent nearby; rentals leasing fast (median 5d on market — plan ~1-2 weeks tenant-placement turnaround); 1,169 units permitted in Monroe County in 2024 (591 in 5+ unit buildings).
- This rent runs 39% of the median local income ($65k/yr) — at the standard rent-burdened threshold; future hikes will face affordability resistance.
Forward outlook
- Local home prices are declining (-3.0%/yr); year-one equity from $2k of loan paydown is wiped out by about $7k of value loss. Plan a longer hold.
- Monroe County population projected to shrink 6% by 2050 — rents likely to lag national; underwrite the cash flow, not the appreciation.
Negotiation context
- Only 12 days on market — expect competitive offers; lowballing is unlikely to land.
Questions for the listing agent
- Built in 1960 — when were the roof, HVAC, electrical panel, plumbing, and water heater last replaced?
- Is there a deadline driving the sale (1031 exchange, divorce, estate, relocation)? That informs how much negotiation room exists.
- Schools are D-rated, which usually means shorter tenancies and higher turnover. Who's the typical renter profile here, and what's been the actual vacancy rate?
- Crime grade is F in this area — have there been break-ins, vandalism, or insurance claims at this property in the last 3 years? What carrier currently insures it and at what premium?
- The area grade is low — what's the realistic commute time and amenity access for the typical tenant pool here? Any planned neighborhood developments (good or bad) we should know about?
- What's the average days-on-market for RENTAL listings here right now (not sales)? A rising rental-DOM trend means longer vacancies and softer asking-rent achievability than the comps imply.
- What's the recent tenant-quality profile in this submarket — average credit score on applications, eviction rate, late-payment / NSF rate, and stable-employment percentage? A property-management company in the area should have these aggregated.
- How much new for-sale + rental construction is in the pipeline within 1–3 miles? Heavy new supply typically softens prices + rents 12–24 months out; constrained supply supports both.
Investment metrics
- 1% rule
- 0.86% ✗
- Cap rate
- 6.69%
- Cash-on-cash
- 1.41%
- DSCR
- 1.06
- GRM
- 9.7
CMA / ARV
- ARV (on-the-fly)
- $245,440
- Comps found
- 12
Show comp detail 12 sales within ~0.75 mi
| Address | Dist | Beds/Ba | Sqft | Sold | Price | $/sf | Match |
|---|---|---|---|---|---|---|---|
| 354 Melville St | 0.55mi | 4/1.5 | 2,448 (+4%) | 5mo | $200,004 | $82 | 64 |
| 563 Melville St | 0.25mi | 5/2.0 (+1) | 2,200 (-7%) | 8mo | $278,000 | $126 | 64 |
| 1579 Culver Rd | 0.58mi | 4/1.5 | 2,319 (-2%) | 9mo | $258,000 | $111 | 63 |
| 165 Culver Pkwy | 0.36mi | 5/3.5 (+1) | 2,334 (-1%) | 7mo | $412,500 | $177 | 62 |
| 388 Cedarwood Ter | 0.42mi | 3/1.5 (-1) | 2,110 (-11%) | 6mo | $200,000 | $95 | 53 |
| 438 Hazelwood Ter | 0.38mi | 3/1.5 (-1) | 2,020 (-14%) | 5mo | $203,000 | $100 | 50 |
| 47 Laurelton Rd | 0.51mi | 3/1.5 (-1) | 2,139 (-9%) | 9mo | $260,000 | $122 | 48 |
| 966 Culver Rd | 0.46mi | 3/1.0 (-1) | 2,156 (-9%) | 12mo | $155,000 | $72 | 47 |
| 255 Melville St | 0.69mi | 4/1.5 | 2,076 (-12%) | 4mo | $215,000 | $104 | 45 |
| 28 Minnesota St | 0.62mi | 4/2.5 | 2,143 (-9%) | 9mo | $295,000 | $138 | 44 |
| 96 Laurelton Rd | 0.50mi | 3/1.5 (-1) | 2,571 (+9%) | 16mo | $190,000 | $74 | 43 |
| 150 Westchester Ave | 0.53mi | 4/2.0 | 2,054 (-13%) | 18mo | $170,000 | $83 | 36 |
Match score weights: distance 35% · size 25% · config 20% · recency 20%. Top-matched comps best support the ARV.
Projected returns pro-forma
-3.0% appreciation · 7.89% rent growth · sell at horizon
- IRR
- -9.0%
- Equity multiple
- 0.65×
- Total profit
- $-23,677
- Equity at exit
- $36,515
- IRR
- 5.8%
- Equity multiple
- 1.52×
- Total profit
- $35,337
- Equity at exit
- $21,174
Cash invested: $68,572 (down + closing). Projections, not guarantees.
Landlord ↔ Tenant lean methodology
- Overall (STATE)
- 15 Strongly Tenant-Friendly
- State New York
- 15 Strongly Tenant-Friendly · D+10
- County
- — inherits STATE
- City
- — inherits STATE
ZIP-level market 14609
- Home prices YoY
- -30.4%
- Rents YoY
- 7.9%
- Active inventory
- 199
- Price-to-rent
- 9.7×
Monthly cashflow live
- Estimated rent
- $2,110 medium interval (Pro) →
- Mortgage (P&I)
- −$1,284
- Tax from tax record
- −$200 /mo · $2,395/yr
- Insurance
- −$102
- HOA
- −$0
- Vacancy / Maint / Mgmt
- −$443
- Net cashflow
- $81
Break-even live
Sensitivity live
| Price | -10% $219 | -5% $150 | +0% $81 | +5% $12 | +10% $-58 |
|---|---|---|---|---|---|
| Rent | -10% $-86 | -5% $-3 | +0% $81 | +5% $164 | +10% $248 |
| Rate | -1.0pp $204 | -0.5pp $143 | base $81 | +0.5pp $17 | +1.0pp $-47 |
UW: 25.0% down · 7.5% · 30yr · 1.5% tax · 5.0% vac · 8.0% maint · 8.0% mgmt
Financing live
Cash to close
- Down payment
- $61,225
- Closing costs
- $7,347
- Reserves months
- —
- Total cash needed
- —
Loan-product check · same deal, 3 products live
Conventional
25% down · 7.5% · 30yr
- Down + closing
- —
- Monthly P&I
- —
- Monthly cashflow
- —
- DSCR
- —
- Eligible?
- —
Personal DTI + credit; lowest rate.
DSCR
20% down · 8.5% · 30yr
- Down + closing
- —
- Monthly P&I
- —
- Monthly cashflow
- —
- DSCR
- —
- Eligible?
- —
No personal income docs; deal must DSCR.
Hard money
10% down · 12.0% · 12mo
- Down + closing
- —
- Monthly P&I
- —
- Monthly cashflow
- —
- DSCR
- —
- Eligible?
- —
Short-term bridge; refi at stabilization.
Rent comps 3 comps
| Address | Beds | Baths | Sqft | Rent | $/sqft | DOM | Units | Dist |
|---|---|---|---|---|---|---|---|---|
| 176 Merwin Ave Rochester, NY | 4.0 | 1.5 | 1750 | $2,200 | $1.26 | 45d | 1 | 0.53mi |
| 1788 Clifford Ave Rochester, NY | 3.0 | 1.0 | 2404 | $1,850 | $0.77 | 5d | 1 | 1.09mi |
| 1786 Clifford Ave Rochester, NY | 3.0 | 1.0 | 2404 | $1,850 | $0.77 | 5d | 1 | 1.09mi |
Listing history 10 events
-
2026-06-13status $244,900 Pending 12 DOM
-
2026-06-10days on market $244,900 Active 12 DOM
-
2026-06-09days on market $244,900 Active 11 DOM
-
2026-06-09days on market $244,900 Active 10 DOM
-
2026-06-07days on market $244,900 Active 9 DOM
-
2026-06-05days on market $244,900 Active 6 DOM
-
2026-06-03days on market $244,900 Active 5 DOM
-
2026-06-03days on market $244,900 Active 4 DOM
-
2026-06-01days on market $244,900 Active 3 DOM
-
2026-05-31days on market $244,900 Active 2 DOM
ⓘ Source: listings_history table (triggers on properties + properties_extension) + one-shot
backfill from property_details.listing_events for pre-trigger history.
Tax reassessment forecast NY · Partial reset (capped growth)
- Current annual tax
- $2,395 · $200/mo
- Projected year-2 tax
- $3,267 · $272/mo
- Expected delta
- +$872/yr (+$73/mo · 36.4%)
ⓘ Screening estimate from a state-policy table — verify with the county assessor before closing.
Climate risk First Street
- Flood 1/10 Low FEMA zone X (unshaded) · 0% chance over 30 yrs
- Wildfire 3/10 Moderate
- Heat 2/10 Low 7 d/yr ≥96°F today · 15 d/yr by 30 yrs out
- Wind 1/10 Low
- Air quality 2/10 Low 1 unhealthy d/yr today · 2 by 30 yrs out
Nearby sold comps map
Loading sold comps map…
Walkable amenities ~0.75 mi
Loading nearby amenities…
Taxation est. · year 1
- Rental income
- $25,317
- − Mortgage interest
- −$13,718
- − Property taxes
- −$2,395
- − Insurance
- −$1,224
- − Repairs & maintenance
- −$2,025
- − Management
- −$2,025
- − Depreciation
- −$7,124
- Taxable loss
- −$3,195
- Est. tax savings @ 24.0%
- +$767
- After-tax cash flow
- $1,737/yr
For passive investors: Depreciation is non-cash, so a rental often shows a tax loss while cash-flowing — sheltering income. Rental losses are passive: they offset passive income freely, and up to $25,000/yr can offset ordinary (W-2) income if you actively participate and your MAGI is under $100k (phasing out to $0 by $150k); unused losses carry forward. On sale, claimed depreciation is recaptured at up to 25%, and gains may owe capital-gains tax (a 1031 exchange can defer both). Figures are a year-1 estimate at your 24.0% rate — not tax advice; consult a CPA.
Schools (NCES district)
- District
- Rochester City School District
- NCES district ID
- 3624750
- Math proficiency
- 21% ▬ 0.00%
- Reading proficiency
- 26% ▲ 4.00%
- Median HH income
- $30,923
- Composite
- 18.98/100
- National rank
- #8850
- State rank
- #589 of 590 in NY
Livability — Rochester
- Score
- 76/100
- State rank
- #222
- US rank
- #3482
Category grades
Schools grade is shown separately in the Schools card above.
Census & demographics
- Census place
- Rochester, NY
- County
- Monroe County · 674,131 people
- City population
- 74,252
- Metro
- Rochester, NY
- Population (ZIP)
- 40,274
- Household income
- $64,603
- Rent vs Own
- Severe rent burden
- 2183.0
Population outlook (Monroe County) Hauer SSP2
- Today (2025)
- 759,460 people
- By 2030
- 757,154 · -0.3%
- By 2040
- 740,644 · -2.5%
- By 2050
- 714,443 · -5.9%
- By 2075
- 645,883 · -15.0%
- By 2100
- 547,084 · -28.0%
Race, ethnicity, and origin ACS 2023
- Neighborhood character
- Diverse neighborhood (Simpson 0.69)
- Race & ethnicity
- White 44% Black 28% Hispanic / Latino 20% Two or more races 10% Asian 2%
- Hispanic origin (detail)
- Puerto Rican 15% Cuban 1% Dominican 1%
- Common ancestry
- Romanian 4% Lithuanian 2% Iranian 1%
- Foreign-born
- 8% · Canada
- Languages at home
- 81% English-only · Spanish 14% Russian/Polish/Slavic 2% Other Indo-European 1%
Political lean MEDSL · Monroe
- 2024 margin
- D (+19.1) · D 59.5% · R 40.5%
- 2008→2024 swing
- +1.4pp toward D · 2008: 17.7pp · 2024: 19.1pp
- All cycles
- 2024: D+19.1 2020: D+21.0 2016: D+14.1 2012: D+17.4 2008: D+17.7
Not yet ingested
- Civics
- —
Market trends
- HPI YoY
- ▼ -143.57%
- Current HPI
- 328.7053
- Rent YoY
- ▲ 7.89%
- Metro
- Rochester, NY
- State GDP YoY
- ▲ 2.60%
- F500 in state
- 92
Industry mix (Fortune 500 HQ in NY)
| Industry | F500 HQs | Revenue |
|---|---|---|
| Financial Services | 10 | $950B |
|
||
| Consumer Goods | 9 | $162B |
|
||
| Insurance | 4 | $225B |
|
||
| Telecommunications | 2 | $144B |
|
||
| Pharmaceuticals | 2 | $112B |
|
||
| Media / Entertainment | 2 | $69B |
|
||
Price history
1 event — show timeline
- 2026-05-29 Listed $244,900 UNYREIS
Property tax history
+4.9%/yrLatest (2025): $2,395 · +0.0% YoY. Source: county tax records.
Cash-flow waterfall
monthlySold comps — $/sqft
last 12 mo · ≤1 miLoading sold comps…