 🏗️ New Construction
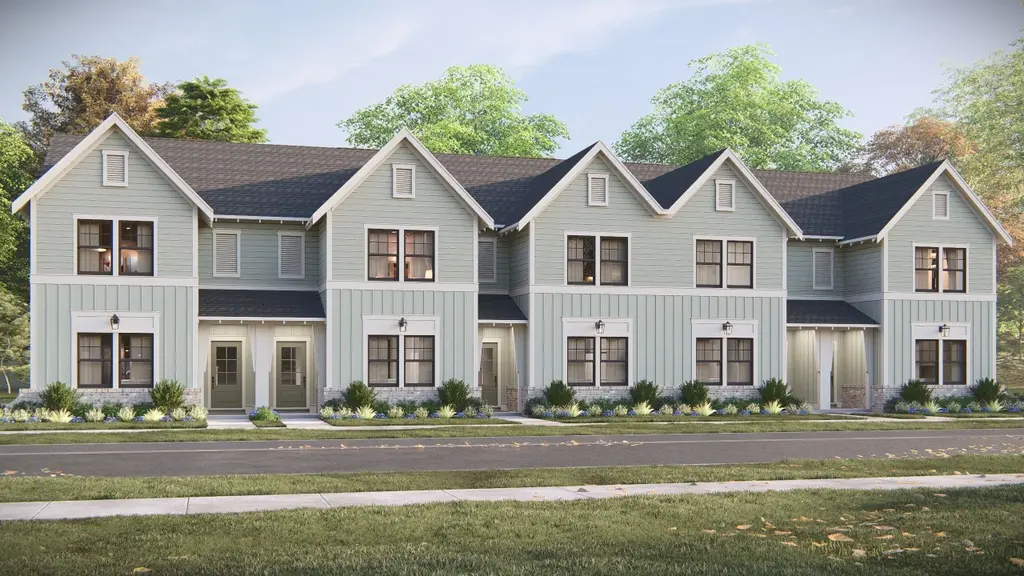
Darcy Plan · Auburn, AL
Flood risk 1/10 · Minimal
- FEMA flood zone
- X (unshaded)
- Chance of flooding over 30 yrs
- 0.0%
- Est. flood insurance / yr
- $507 – $1,088
Fire risk 5/10 · Moderate
- Est. fire insurance / yr
- $916 – $1,700
Heat risk 6/10 · Moderate
- Hot days now (above 105°F)
- 7 days/yr
- Hot days in 30 yrs
- 20 days/yr
Wind risk 6/10 · Moderate
- Chance of severe wind over 30 yrs
- 67.0%
Air-quality risk 2/10 · Minimal
- Unhealthy air days now
- 1 days/yr
- Unhealthy air days in 30 yrs
- 1 days/yr
Risk factors via First Street. Map © Google.
Why this score? — see what drove the F grade
The composite is a weighted blend of 9 inputs, each scored 0–100. Each bar is that input's sub-score; the figure is the points it added to the 100-point composite (weight × sub-score).
- ARV discount +7.5/15.0
- Schools +5.0/10.0
- Rent growth +4.0/5.0
- Livability +4.0/5.0
- Cash flow +3.6/30.0
- Condition / age +2.5/5.0
- 1% rule +0.0/10.0
- DSCR +0.0/10.0
- Appreciation +0.0/10.0
$315,000
🖨 Deal sheet (PDF) 📄 Offer letter ✓ Due diligence
Listing remarks
Mimms Trail - The Gables Townhomes are NOW SELLING! Mimms Trail is a thoughtfully designed single-family home community located in Auburn, Alabama, offering a peaceful setting ideal for families. Surrounded by green space and scenic views, the community features a strong emphasis on outdoor living and connection. Residents enjoy a well-rounded collection of amenities including a community pool, lake, garden, walking trails, and sidewalk-lined streets, perfect for active lifestyles and everyday enjoyment. Mimms Trail is zoned for Auburn City Schools, including the highly sought-after Ogletree Elementary School, making it a top choice for families. Conveniently located with quick access to I
Key facts
- Community pool
- Walking trails
- Quick access to i-85
Tags
Property features AI
Finance
- Other: Address: 2637 Rutland Rd, Auburn, AL 36832
- Financial info: List price $315,000
Exterior
- Home design: Darcy plan (new construction, Plan inventory type)
- Construction: Built in 2026
Interior
- Bedrooms: 3 bedrooms
- Bathrooms: 2 full bathrooms; 1 half bathroom (2.5 total bathrooms)
- Interior features: Open living area (1,707 finished square feet)
Neighborhood map
What this means for you Summary
Snapshot
- This is a 3-bed/2.5-bath single-family listed at $315k.
Deal economics
- At list price, monthly cash flow is $-1k ($-16k/yr) — negative.
- To cash-flow at today's rent, offer at most $260k (17.4% below list).
- To meet the 1% rule (rent ≥ 1% of price), the offer needs to be $228k (27.7% below list).
- Recommended offer: $228k (27.7% below list) — sets the bar for 1% rule.
Location & tenants
- Location reads 80/100 on livability (#6 in AL, #1,842 nationally) — a professional / high-income tenant draw. Strengths: crime A+, amenities A+, health & safety A+; Watch: commute F.
- Auburn City (urban): math 51% / reading 69% proficiency, ranked #7 of 129 in AL (top 5%) — acceptable for families but not a draw, mixed tenant base, ~2y average lease.
- Zoned schools: Ogletree Elementary School (math 62% / reading 74%, grade B+, #33 of 627 statewide, top 5%, 511 students, 25% FRL); Drake Middle School (math 44% / reading 69%, grade B, #16 of 257 statewide, top 6%, 711 students, 31% FRL); Auburn High School (math 54% / reading 50%, grade D+, #11 of 305 statewide, top 4%, 2,143 students, 27% FRL) — zoned schools at 28% FRL track the district average.
- Market conditions: Rents rising fast (+6.2%/yr); 368 active listings in the ZIP; 4 comparable units currently listed for rent nearby; rentals lingering (median 46d on market — plan ~5-8 weeks vacancy on turnover, expect pricing pressure); 50% of comp listings sitting > 30 days — soft ceiling on asking rent; lower-income renter base — watch delinquency; 1,858 units permitted in Lee County in 2024 (113 in 5+ unit buildings).
- At $2,276/mo this rent would consume 64% of the median local household income ($43k/yr) (locally 2503% of renters already pay >50% of income on rent) — very limited rent-growth headroom before tenants either downsize or default.
Forward outlook
- Local home prices are declining (-3.0%/yr); year-one equity from $3k of loan paydown is wiped out by about $14k of value loss. Plan a longer hold.
- Lee County population projected at +54% by 2050 — long-run rental-demand tailwind backs the buy-and-hold thesis.
Negotiation context
- It's been on market 48 days — a 3% lower offer ($306k) is reasonable based on typical stale-listing flexibility.
Risks & watch-outs
- Climate carrying-cost: major wind risk, 67% chance of damaging wind over 30y; moderate wildfire risk; extreme-heat days projected 7→20/yr by 2055 (HVAC capex compounding) — expect insurance premiums to compound above CPI over the hold.
Questions for the listing agent
- What do current leases actually rent for vs. the listed asking? Can we see a recent rent roll and the last 12 months of T-12 income?
- It's been on market 48 days. Have you received any prior offers? Is the seller open to a 28% concession, seller financing, or rate buy-down credit?
- Is there a deadline driving the sale (1031 exchange, divorce, estate, relocation)? That informs how much negotiation room exists.
- Schools are A-rated — typically a magnet for longer-tenancy family renters. What's the average tenant stay here, and is there a school-zone premium baked into asking?
- The area grade is low — what's the realistic commute time and amenity access for the typical tenant pool here? Any planned neighborhood developments (good or bad) we should know about?
- What's the average days-on-market for RENTAL listings here right now (not sales)? A rising rental-DOM trend means longer vacancies and softer asking-rent achievability than the comps imply.
- What's the recent tenant-quality profile in this submarket — average credit score on applications, eviction rate, late-payment / NSF rate, and stable-employment percentage? A property-management company in the area should have these aggregated.
- How much new for-sale + rental construction is in the pipeline within 1–3 miles? Heavy new supply typically softens prices + rents 12–24 months out; constrained supply supports both.
Investment metrics
- 1% rule
- 0.50% ✗
- Cap rate
- 2.74%
- Cash-on-cash
- -12.69%
- DSCR
- 0.44
- GRM
- 16.7
CMA / ARV
- ARV (median comp)
- $455,249
- List price
- $315,000
- Delta
- -30.81%
- Verdict
- UNDERPRICED
- Comps
- 20 within 1.0 mi
Show comp detail 12 sales within ~0.75 mi
| Address | Dist | Beds/Ba | Sqft | Sold | Price | $/sf | Match |
|---|---|---|---|---|---|---|---|
| 2606 Rutland Rd | 0.12mi | 3/2.0 | 1,649 (-3%) | 1mo | $413,030 | $250 | 86 |
| 2673 Rutland Rd | 0.05mi | 3/2.0 | 1,633 (-4%) | 9mo | $408,037 | $250 | 81 |
| 2622 Rutland Rd | 0.15mi | 3/2.0 | 1,807 (+6%) | 4mo | $423,720 | $234 | 78 |
| 3082 Mimms Trail Trl | 0.16mi | 3/2.0 | 1,807 (+6%) | 7mo | $415,790 | $230 | 75 |
| 2585 Rutland Rd | 0.13mi | 3/2.0 | 1,807 (+6%) | 9mo | $422,777 | $234 | 75 |
| 3073 Mimms Trail Trl | 0.18mi | 3/2.0 | 1,582 (-7%) | 8mo | $378,000 | $239 | 71 |
| 2611 Mimms Ln | 0.64mi | 3/2.0 | 1,799 (+5%) | 3mo | $440,000 | $245 | 57 |
| 2639 Mimms Ln | 0.56mi | 3/2.0 | 1,851 (+8%) | 6mo | $415,000 | $224 | 53 |
| 246 Driver Ln | 0.50mi | 4/3.0 (+1) | 1,942 (+14%) | 0mo | $395,250 | $204 | 46 |
| 2473 Mimms Ln | 0.61mi | 3/2.0 | 1,889 (+11%) | 8mo | $389,000 | $206 | 45 |
| 304 Nicklaus Ct | 0.56mi | 4/3.0 (+1) | 1,942 (+14%) | 1mo | $392,900 | $202 | 43 |
| 2456 Mimms Ln | 0.62mi | 3/2.0 | 1,959 (+15%) | 8mo | $427,000 | $218 | 38 |
Match score weights: distance 35% · size 25% · config 20% · recency 20%. Top-matched comps best support the ARV.
Projected returns pro-forma
-3.0% appreciation · 6.18% rent growth · sell at horizon
- IRR
- -36.6%
- Equity multiple
- -0.19×
- Total profit
- $-152,068
- Equity at exit
- $67,879
- IRR
- -34.3%
- Equity multiple
- -0.65×
- Total profit
- $-209,899
- Equity at exit
- $39,362
Cash invested: $127,470 (down + closing). Projections, not guarantees.
Landlord ↔ Tenant lean methodology
- Overall (STATE)
- 90 Strongly Landlord-Friendly
- State Alabama
- 90 Strongly Landlord-Friendly · R+15
- County
- — inherits STATE
- City
- — inherits STATE
ZIP-level market 36832
- Home prices YoY
- -23.3%
- Rents YoY
- 6.2%
- Active inventory
- 368
- Price-to-rent
- 11.5×
Monthly cashflow live
- Estimated rent
- $2,276 medium interval (Pro) →
- Mortgage (P&I)
- −$2,387
- Tax est. 1.5%
- −$569 /mo · $6,829/yr
- Insurance
- −$190
- HOA
- −$0
- Vacancy / Maint / Mgmt
- −$478
- Net cashflow
- $-1,348
Break-even live
Sensitivity live
| Price | -10% $-1,033 | -5% $-1,191 | +0% $-1,348 | +5% $-1,505 | +10% $-1,662 |
|---|---|---|---|---|---|
| Rent | -10% $-1,528 | -5% $-1,438 | +0% $-1,348 | +5% $-1,258 | +10% $-1,168 |
| Rate | -1.0pp $-1,119 | -0.5pp $-1,232 | base $-1,348 | +0.5pp $-1,466 | +1.0pp $-1,586 |
UW: 25.0% down · 7.5% · 30yr · 1.5% tax · 5.0% vac · 8.0% maint · 8.0% mgmt
Financing live
Cash to close
- Down payment
- $113,812
- Closing costs
- $13,657
- Reserves months
- —
- Total cash needed
- —
Loan-product check · same deal, 3 products live
Conventional
25% down · 7.5% · 30yr
- Down + closing
- —
- Monthly P&I
- —
- Monthly cashflow
- —
- DSCR
- —
- Eligible?
- —
Personal DTI + credit; lowest rate.
DSCR
20% down · 8.5% · 30yr
- Down + closing
- —
- Monthly P&I
- —
- Monthly cashflow
- —
- DSCR
- —
- Eligible?
- —
No personal income docs; deal must DSCR.
Hard money
10% down · 12.0% · 12mo
- Down + closing
- —
- Monthly P&I
- —
- Monthly cashflow
- —
- DSCR
- —
- Eligible?
- —
Short-term bridge; refi at stabilization.
Rent comps 4 comps
| Address | Beds | Baths | Sqft | Rent | $/sqft | DOM | Units | Dist |
|---|---|---|---|---|---|---|---|---|
| 632 Shropshire DR Auburn, AL | 3.0 | 2.0 | 1230 | $2,450 | $1.99 | 15d | 1 | 0.15mi |
| 138 Northern Flicker Dr Auburn, AL | 3.0 | 3.0 | 2085 | $2,500 | $1.20 | 15d | 1 | 0.60mi |
| 2472 Mimms Ln Auburn, AL | 3.0 | 2.0 | 1944 | $2,500 | $1.29 | 45d | 1 | 0.65mi |
| 3297 S College St Auburn, AL | 2.0–3.0 | 2.0 | 1232 | $1,500 | $1.22 | 45d | 1 | 0.80mi |
Listing history 18 events
-
2026-06-21days on market $315,000 Active 48 DOM
-
2026-06-18days on market $315,000 Active 45 DOM
-
2026-06-17days on market $315,000 Active 44 DOM
-
2026-06-16days on market $315,000 Active 43 DOM
-
2026-06-15days on market $315,000 Active 42 DOM
-
2026-06-14days on market $315,000 Active 40 DOM
-
2026-06-13days on market $315,000 Active 39 DOM
-
2026-06-10days on market $315,000 Active 37 DOM
-
2026-06-09days on market $315,000 Active 36 DOM
-
2026-06-08days on market $315,000 Active 35 DOM
-
2026-06-07days on market $315,000 Active 34 DOM
-
2026-06-05days on market $315,000 Active 31 DOM
-
2026-06-03days on market $315,000 Active 30 DOM
-
2026-06-02days on market $315,000 Active 29 DOM
-
2026-06-01days on market $315,000 Active 28 DOM
-
2026-05-31days on market $315,000 Active 27 DOM
-
2026-05-30days on market $315,000 Active 26 DOM
-
2026-05-04$315,000 Active 925-char remark
ⓘ Source: listings_history table (triggers on properties + properties_extension) + one-shot
backfill from property_details.listing_events for pre-trigger history.
Climate risk First Street
- Flood 1/10 Low FEMA zone X (unshaded) · 0% chance over 30 yrs
- Wildfire 5/10 Major
- Heat 6/10 Major 7 d/yr ≥105°F today · 20 d/yr by 30 yrs out
- Wind 6/10 Major 67% chance of damaging wind over 30 yrs
- Air quality 2/10 Low 1 unhealthy d/yr today · 1 by 30 yrs out
Nearby sold comps map
Loading sold comps map…
Walkable amenities ~0.75 mi
Loading nearby amenities…
Taxation est. · year 1
- Rental income
- $27,315
- − Mortgage interest
- −$25,501
- − Property taxes
- −$6,829
- − Insurance
- −$2,276
- − Repairs & maintenance
- −$2,185
- − Management
- −$2,185
- − Depreciation
- −$13,244
- Taxable loss
- −$24,905
- Est. tax savings @ 24.0%
- +$5,977
- After-tax cash flow
- $-10,197/yr
For passive investors: Depreciation is non-cash, so a rental often shows a tax loss while cash-flowing — sheltering income. Rental losses are passive: they offset passive income freely, and up to $25,000/yr can offset ordinary (W-2) income if you actively participate and your MAGI is under $100k (phasing out to $0 by $150k); unused losses carry forward. On sale, claimed depreciation is recaptured at up to 25%, and gains may owe capital-gains tax (a 1031 exchange can defer both). Figures are a year-1 estimate at your 24.0% rate — not tax advice; consult a CPA.
Schools (NCES district)
- District
- Auburn City
- NCES district ID
- 0100210
- Math proficiency
- 51% ▼ -21.00%
- Reading proficiency
- 69% ▲ 5.00%
- Median HH income
- $38,126
- Composite
- 49.87/100
- National rank
- #1944
- State rank
- #7 of 129 in AL
Livability — Auburn
- Score
- 80/100
- State rank
- #6
- US rank
- #1842
Category grades
Schools grade is shown separately in the Schools card above.
Census & demographics
- Census place
- Auburn, AL
- County
- Lee County · 144,175 people
- City population
- 80,251
- Metro
- Auburn-Opelika, AL
- Population (ZIP)
- 30,959
- Household income
- $42,717
- Rent vs Own
- Severe rent burden
- 2503.0
Population outlook (Lee County) Hauer SSP2
- Today (2025)
- 196,440 people
- By 2030
- 217,417 · +10.7%
- By 2040
- 259,467 · +32.1%
- By 2050
- 301,557 · +53.5%
- By 2075
- 402,186 · +104.7%
- By 2100
- 474,503 · +141.6%
Race, ethnicity, and origin ACS 2023
- Neighborhood character
- Diverse neighborhood (Simpson 0.58)
- Race & ethnicity
- White 59% Black 26% Asian 6% Hispanic / Latino 6% Two or more races 4%
- Hispanic origin (detail)
- Mexican 3%
- Common ancestry
- Italian 3% Slovak 2% Serbian 1%
- Foreign-born
- 8% · South Korea, Canada, China
- Languages at home
- 89% English-only · Spanish 4% Korean 2% Chinese 1%
Political lean MEDSL · Lee
- 2024 margin
- Strong R (+27.8) · D 35.5% · R 63.3% · Other 1.2%
- 2008→2024 swing
- -8.1pp toward R · 2008: -19.8pp · 2024: -27.8pp
- All cycles
- 2024: R+27.8 2020: R+20.1 2016: R+23.1 2012: R+19.9 2008: R+19.8
Not yet ingested
- Civics
- —
Market trends
- HPI YoY
- ▼ -75.65%
- Current HPI
- 248.9059
- Rent YoY
- ▲ 6.18%
- Metro
- Auburn-Opelika, AL
- State GDP YoY
- ▲ 2.94%
- F500 in state
- 4
Industry mix (Fortune 500 HQ in AL)
| Industry | F500 HQs | Revenue |
|---|---|---|
| Financial Services | 1 | $8B |
|
||
| Healthcare | 1 | $5B |
|
||
Cash-flow waterfall
monthlySold comps — $/sqft
last 12 mo · ≤1 miLoading sold comps…